Watertown: Fire Incidents, Minnesota (MN)
Where are fire incidents reported in Watertown, MN
Something went wrong! Please refresh the page.
|
| |||||||||||||||||||||||||||||||||||||||||||||||||||||||||||||||||||||||||||||||||||||||||||||||||||||||||||||
2002 - 2018 National Fire Incident Reporting System (NFIRS) incidents
- Incident types reported to NFIRS in Watertown, MN
- 96649.0%Rescue & EMS
- 32516.5%Fire
- 32416.4%Hazardous Condition
- 1969.9%Good Intent Call
- 894.5%False Alarm
- 492.5%Service Call
- 191.0%Severe Weather
- 50.3%Overpressure Rupture
- Fire incident types reported to NFIRS in Watertown, MN
- 13842.5%Outside Fires
- 13441.2%Structure Fires
- 4212.9%Mobile Property/Vehicle Fires
- 113.4%Other
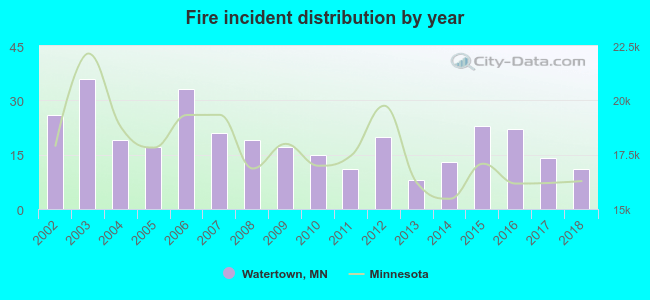 Based on the data from the years 2002 - 2018 the average number of fires per year is 19. The highest number of reported fires - 36 took place in 2003, and the least - 8 in 2013. The data has a declining trend.
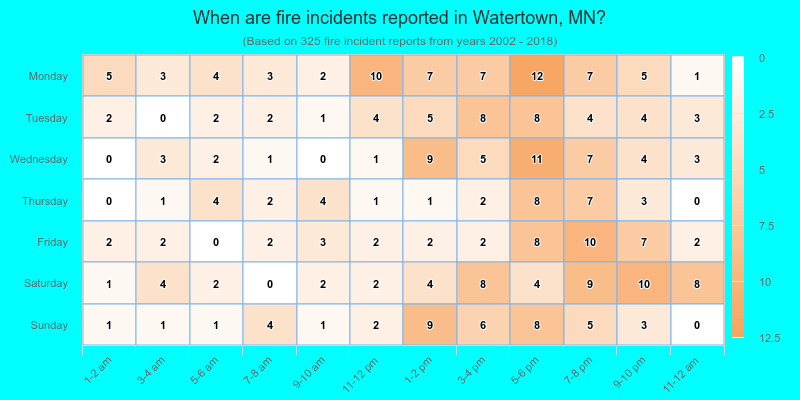
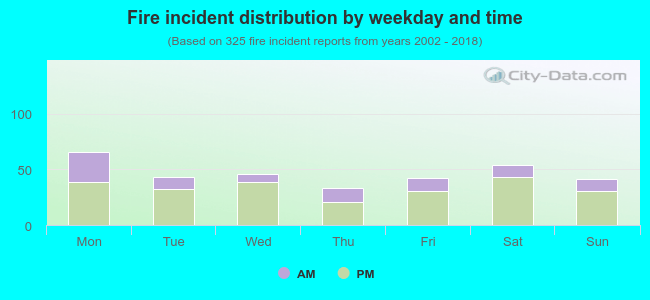 27.4% incidents where reported in the morning and 72.6% in the evening. The most fires (20.3%) took place on Monday, and the least (10.2%) on Thursday.
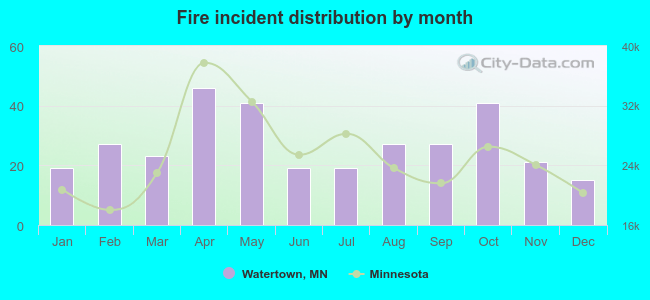 Based on the 325 fire incident reports from years 2002 - 2018 most fires (14.2%) took place during April, and the least (4.6%) in December.
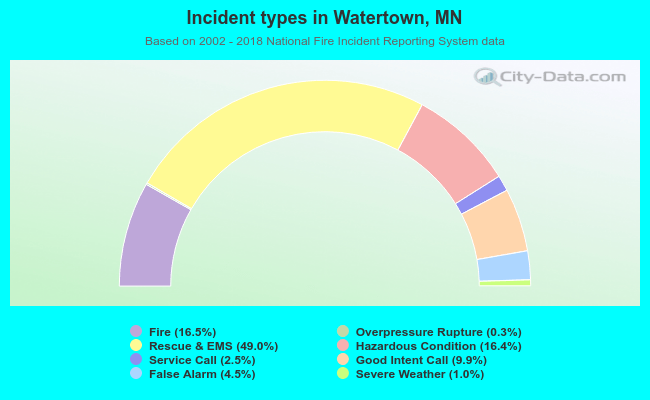 Out of all 1,973 cases reported during the years 2002 - 2018, the most belonged to the categories: Rescue & EMS (49.0%), Fire (16.5%), and Hazardous Condition (16.4%).
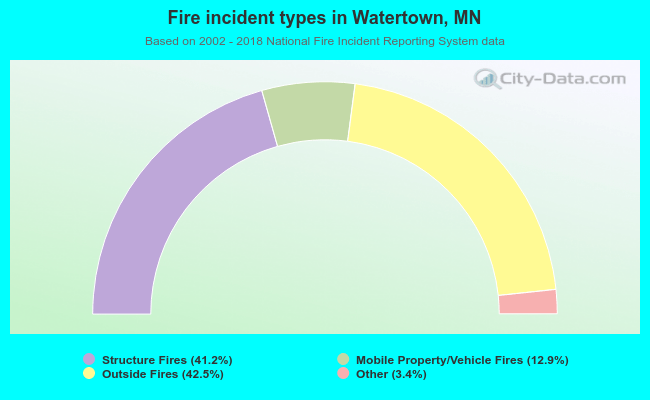 When looking into fire subcategories, the most incidents belonged to: Outside Fires (42.5%), and Structure Fires (41.2%).