Waukesha: Fire Incidents, Wisconsin (WI)
Where are fire incidents reported in Waukesha, WI
Something went wrong! Please refresh the page.
| Fire incidents reported | |
|---|---|
| Sreet name | Count |
| MAIN ST | 90 |
| N EAST AVE | 84 |
| SUNSET DR | 78 |
| SUMMIT AVE | 56 |
| WISCONSIN AVE | 46 |
| EAST AVE | 42 |
| KENSINGTON DR | 42 |
| MORELAND BLVD | 42 |
| SPRINGDALE RD | 40 |
| GRANDVIEW BLVD | 36 |
| E MAIN ST | 34 |
| GENESEE ROAD RD | 34 |
| W ST PAUL AVE | 34 |
| N GRANDVIEW BLVD | 32 |
| CAMBRIDGE AVE | 30 |
| DELAFIELD ST | 30 |
| N UNIVERSITY DR | 30 |
| NORTH ST | 30 |
| UNIVERSITY DR | 30 |
| MADISON ST | 28 |
| S GRAND AVE | 28 |
| E MORELAND BLVD | 26 |
| JOHNSON DR | 26 |
| WHITE ROCK AVE | 26 |
| MERRILL HILLS ROAD RD | 24 |
| SUNSET DRIVE DR | 24 |
| W COLLEGE AVE | 24 |
| COLLEGE AVE | 22 |
| MADISON ST | 22 |
| S PRAIRIE AVE | 22 |
| Other | 1,233 |
2003 - 2018 National Fire Incident Reporting System (NFIRS) incidents
- Incident types reported to NFIRS in Waukesha, WI
- 26,58174.1%Rescue & EMS
- 2,4616.9%False Alarm
- 2,3456.5%Fire
- 2,1776.1%Hazardous Condition
- 1,0963.1%Good Intent Call
- 1,0693.0%Service Call
- 580.2%Overpressure Rupture
- 450.1%Special Incident
- Fire incident types reported to NFIRS in Waukesha, WI
- 1,11547.5%Structure Fires
- 67828.9%Outside Fires
- 35014.9%Mobile Property/Vehicle Fires
- 2028.6%Other
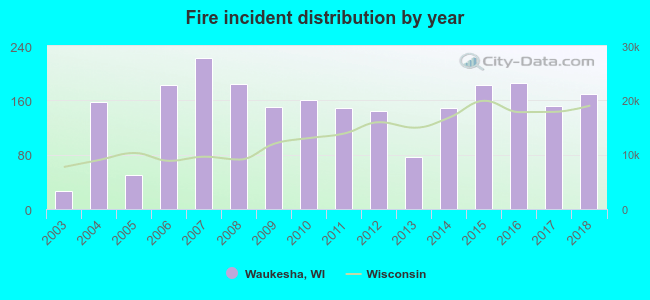 Based on the data from the years 2003 - 2018 the average number of fire incidents per year is 147. The highest number of reported fires - 223 took place in 2007, and the least - 27 in 2003. The data has a rising trend.
The average number of yearly fire incidents per 10k residents in Waukesha, WI compared to nearest cities:
(Note: Based on data for the last 3 years, including only cities with population 5,000 and above)
| Waukesha: | 23.6 |
| Pewaukee: | 40.9 |
| New Berlin: | 28.9 |
| Genesee: | 1.8 |
| Brookfield: | 23.3 |
| Elm Grove: | 13.0 |
| Vernon: | 42.1 |
| Hartland: | 55.8 |
| Sussex: | 23.0 |
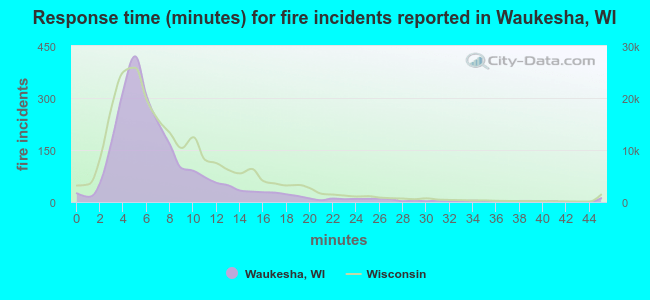 The median response time based on all reported fire incidents is 6 minutes. This is about the same as the Wisconsin median value.
The median response time in Waukesha, WI compared to nearest cities:
(Note: Based on data for all years, including only cities with at least 500 fire incidents)
| Waukesha: | 6 minutes |
| Pewaukee: | 8 minutes |
| New Berlin: | 7 minutes |
| Brookfield: | 7 minutes |
| Hartland: | 9 minutes |
| Sussex: | 9 minutes |
| Muskego: | 7 minutes |
| West Allis: | 4 minutes |
| Wauwatosa: | 6 minutes |
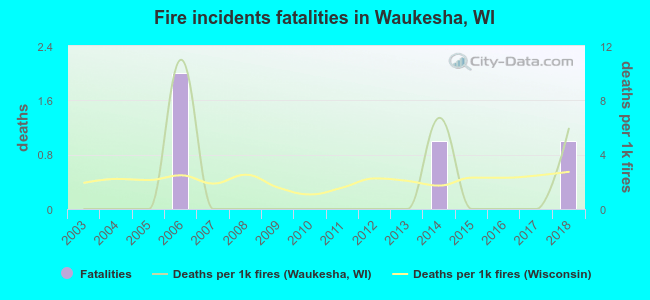 Based on the data from the years 2003 - 2018 the average number of fire-related fatalities per year is 0. The highest number of reported deaths - 2 took place in 2006, and the lowest - 0 in 2003. The data has a growing trend.
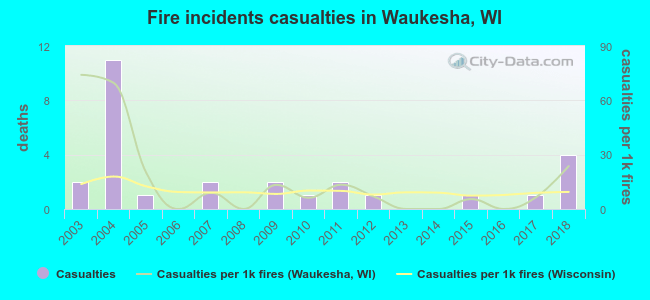 Based on the data from the years 2003 - 2018 the average number of fire-related yearly casualties is 2. The highest number of injuries - 11 took place in 2004, and the lowest - 0 in 2006. The data has a rising trend.
The average number of casualties per 1,000 fires is 16. This indicator was the highest - 74 in 2003, and the lowest 0 in 2006. The trend for casualties per 1,000 incidents is decreasing. Compared to the state value the number of injuries per 1,000 incidents is higher.
Based on the data from the years 2003 - 2018 the average number of fire-related yearly casualties is 2. The highest number of injuries - 11 took place in 2004, and the lowest - 0 in 2006. The data has a rising trend.
The average number of casualties per 1,000 fires is 16. This indicator was the highest - 74 in 2003, and the lowest 0 in 2006. The trend for casualties per 1,000 incidents is decreasing. Compared to the state value the number of injuries per 1,000 incidents is higher.Casualties per 1,000 incidents in Waukesha, WI compared to nearest cities:
(Note: Based on data for all years, including only cities with at least 500 fire incidents)
| Waukesha: | 11.9 |
| Pewaukee: | 16.7 |
| New Berlin: | 7.1 |
| Brookfield: | 21.0 |
| Hartland: | 3.8 |
| Sussex: | 10.1 |
| Muskego: | 0.0 |
| West Allis: | 53.5 |
| Wauwatosa: | 28.7 |
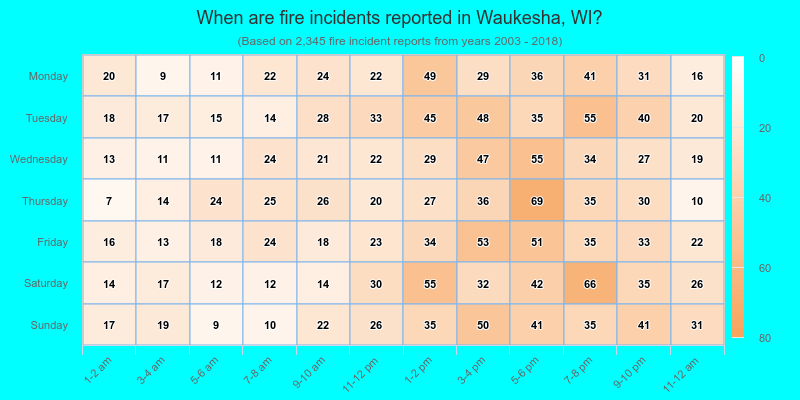
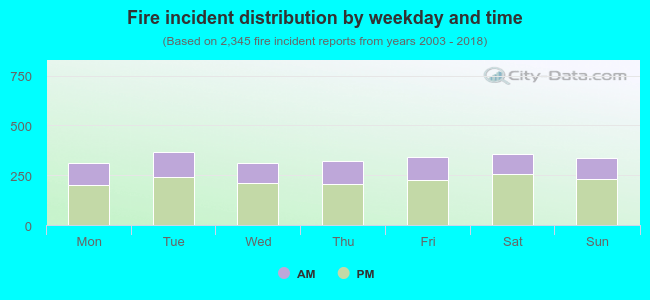 32.6% incidents where reported in the morning and 67.4% in the evening. The most fires (15.7%) took place on Tuesday, and the least (13.2%) on Monday.
 According to the 2,345 incident reports from years 2003 - 2018 most fires (9.9%) took place during April, and the least (6.3%) in December.
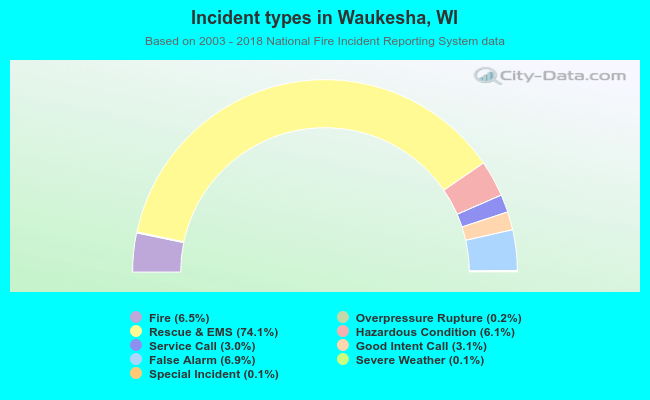 Out of all 35,851 cases reported during the years 2003 - 2018, the most belonged to the categories: Rescue & EMS (74.1%), False Alarm (6.9%), and Fire (6.5%).
 When looking into fire subcategories, the most incidents belonged to: Structure Fires (47.5%), and Outside Fires (28.9%).