| Fire incidents reported |
|---|
| Sreet name | Count |
|---|
| I 74 HWY | 60 | | SR 25 | 54 | | US HIGHWAY 136 | 40 | | SR 55 | 30 | | SR 32 | 22 | | COUNTY ROAD 400W | 20 | | COUNTY ROAD 100N | 18 | | COUNTY ROAD 600N | 14 | | COUNTY ROAD 450 N | 12 | | INTERSTATE 74 | 12 | | WASHINGTON STREET | 12 | | LIBERTY STREET | 10 | | ORCHARD STREET | 10 | | STATE ROAD 136 | 10 | | VINE STREET | 10 | | BRANT STREET | 8 | | COUNTY ROAD 150 N | 8 | | HOLMAN ROAD | 8 | | 200 NORTH | 6 | | COUNTY ROAD 1000 W. | 6 | | COUNTY ROAD 440 N | 6 | | COUNTY ROAD 500W | 6 | | COUNTY ROAD 650 NORTH | 6 | | GARFIELD STREET | 6 | | RACE STREET | 6 |
| | | Fire incidents reported |
|---|
| Sreet name | Count |
|---|
| UNION STREET | 6 | | 5401 W 32 W | 4 | | COUNTY ROAD 300 S | 4 | | COUNTY ROAD 550W | 4 | | COUNTY ROAD 600W | 4 | | COUNTY ROAD 650W | 4 | | DIVISION ROAD | 4 | | MARKET STREET | 4 | | MOUNTAIN ROAD | 4 | | STATE ROAD 25 | 4 | | VINCENT STREET | 4 | | WALNUT STREET | 4 | | 1000 | 2 | | 3395 WEST STREET | 2 | | 3935 S 830 W | 2 | | 440 RD | 2 | | 4834 W 450 NORTH | 2 | | 600 . RD | 2 | | 700 W 200 S | 2 | | 7339 SR 32 W | 2 | | 7490 W 32 W | 2 | | 7922 W 200 S | 2 | | CLEVLAND STREET | 2 | | CO RD 300 | 2 | | |
|
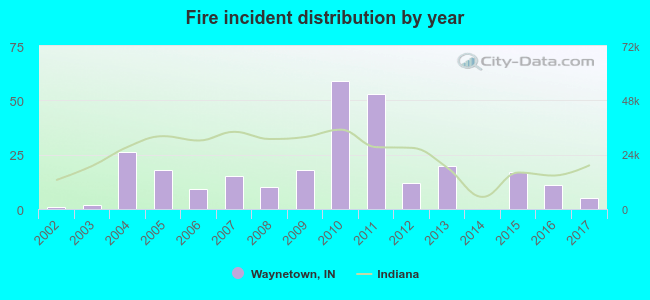 Based on the data from the years 2002 - 2017 the average number of fire incidents per year is 17. The highest number of fire incidents - 59 took place in 2010, and the least - 0 in 2014. The data has an increasing trend.
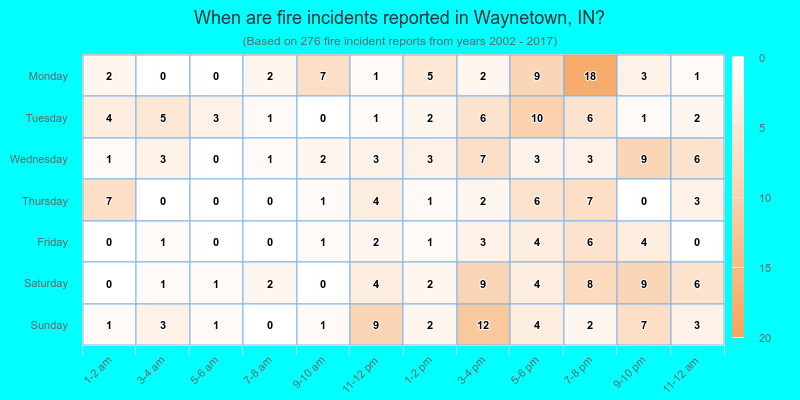
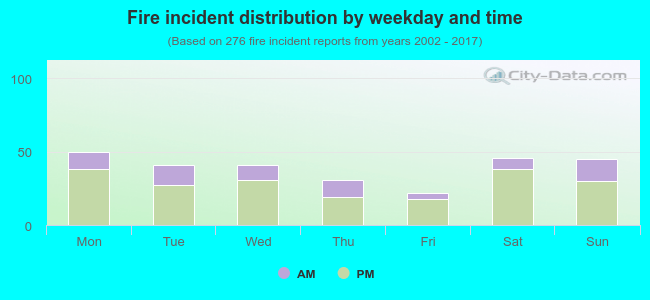 27.2% incidents where reported in the morning and 72.8% in the evening. The most fires (18.1%) took place on Monday, and the least (8.0%) on Friday.
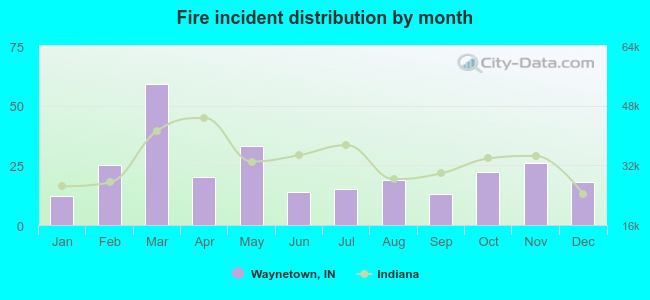 According to the 276 incident reports from years 2002 - 2017 most fires (21.4%) took place during March, and the least (4.3%) in January.
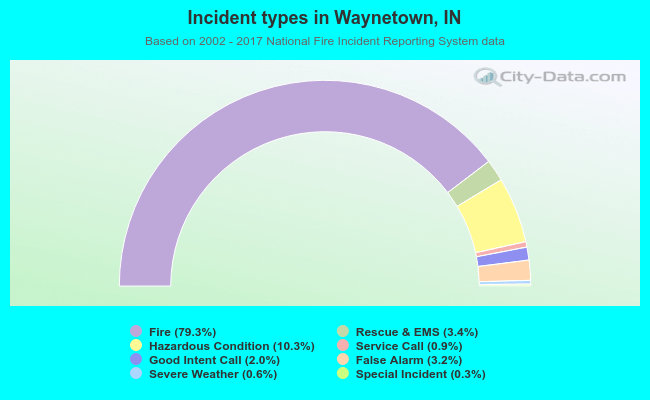 Out of all 348 cases reported during the years 2002 - 2017, the most belonged to the categories: Fire (79.3%), Rescue & EMS (10.3%), and Overpressure Rupture (3.4%).
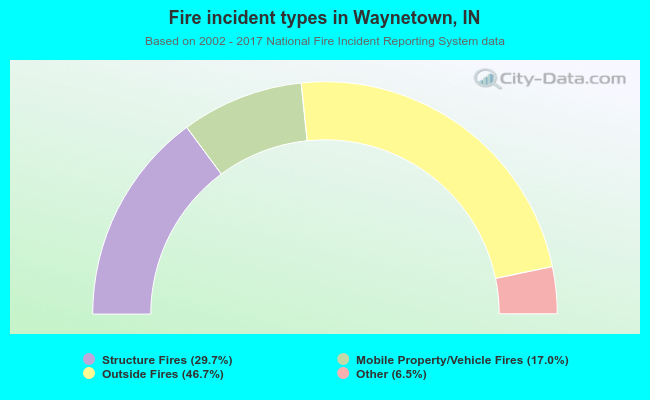 When looking into fire subcategories, the most reports belonged to: Outside Fires (46.7%), and Structure Fires (29.7%).