Weaverville: Fire Incidents, California (CA)
Where are fire incidents reported in Weaverville, CA
Something went wrong! Please refresh the page.
|
| |||||||||||||||||||||||||||||||||||||||||||||||||||||||||||||||||||||||||||||||||||||||||||||||||||||||||||||
| Other | 79 | |||||||||||||||||||||||||||||||||||||||||||||||||||||||||||||||||||||||||||||||||||||||||||||||||||||||||||||
2005 - 2018 National Fire Incident Reporting System (NFIRS) incidents
- Incident types reported to NFIRS in Weaverville, CA
- 1,29358.6%Rescue & EMS
- 44720.3%Fire
- 1627.3%False Alarm
- 1285.8%Service Call
- 1145.2%Good Intent Call
- 572.6%Hazardous Condition
- 40.2%Severe Weather
- Fire incident types reported to NFIRS in Weaverville, CA
- 24655.0%Outside Fires
- 14632.7%Structure Fires
- 398.7%Mobile Property/Vehicle Fires
- 163.6%Other
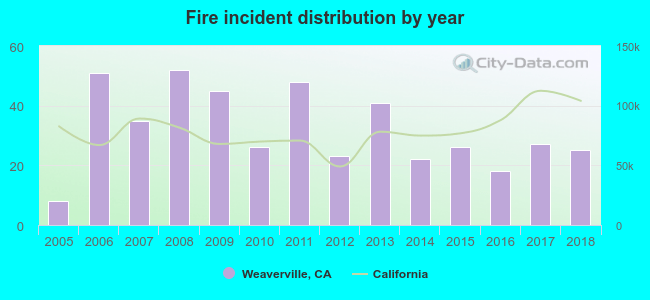 Based on the data from the years 2005 - 2018 the average number of fire incidents per year is 32. The highest number of reported fires - 52 took place in 2008, and the least - 8 in 2005. The data has a rising trend.
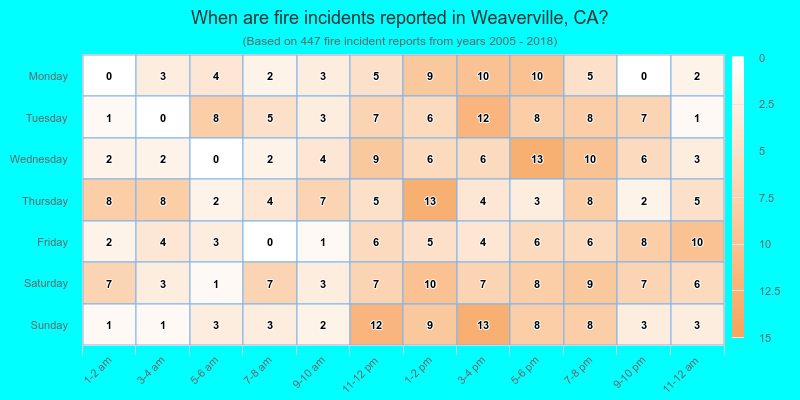
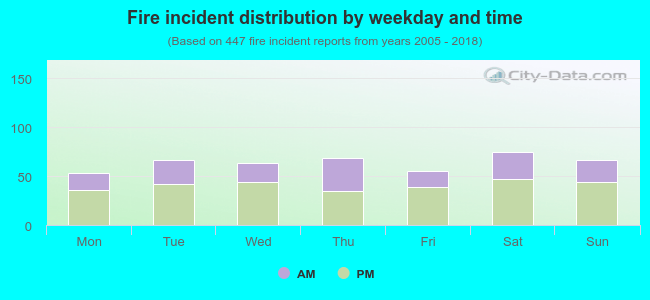 35.8% incidents where reported in the morning and 64.2% in the evening. The most fires (16.8%) took place on Saturday, and the least (11.9%) on Monday.
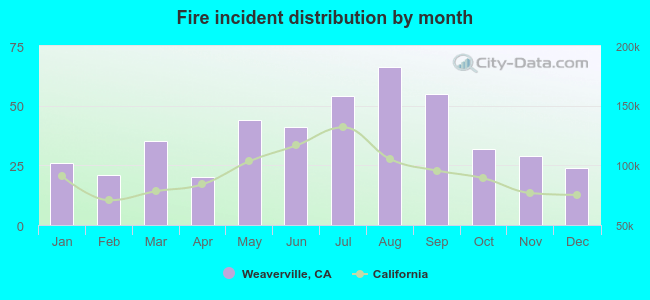 According to the 447 fires from years 2005 - 2018 most fires (14.8%) took place during August, and the least (4.5%) in April.
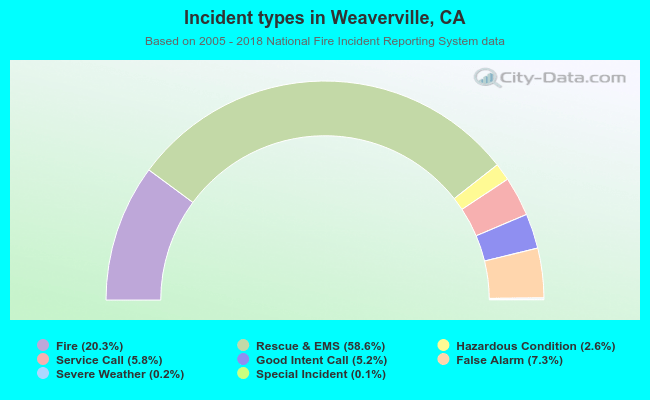 Out of all 2,207 cases reported during the years 2005 - 2018, the most belonged to the categories: Overpressure Rupture (58.6%), Fire (20.3%), and Good Intent Call (7.3%).
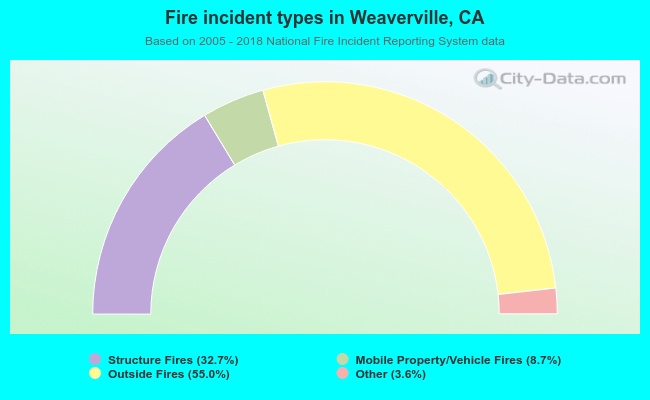 When looking into fire subcategories, the most incidents belonged to: Outside Fires (55.0%), and Structure Fires (32.7%).