Wellington: Fire Incidents, Florida (FL)
Where are fire incidents reported in Wellington, FL
Something went wrong! Please refresh the page.
| Fire incidents reported | |
|---|---|
| Sreet name | Count |
| FOREST HILL BLVD | 80 |
| STATE ROAD 7 | 50 |
| POLO GARDENS DR | 30 |
| GREENVIEW SHORES BLVD | 26 |
| WELLINGTON TRCE | 26 |
| FOREST HILL | 24 |
| FAIRLANE FARMS RD | 18 |
| SOUTH SHORE BLVD | 18 |
| APPALOOSA TRL | 14 |
| PADDOCK DR | 14 |
| WHITE PINE DR | 14 |
| FLYING COW RANCH RD | 12 |
| FOREST HILL BOUL | 12 |
| GOLDENROD RD | 12 |
| PERIWINKLE PL | 12 |
| PIERSON RD | 12 |
| POLO CLUB RD | 12 |
| BEACON CIR | 10 |
| POLO LAKE DR | 10 |
| 50TH ST | 8 |
| ACME RD | 8 |
| BIG BLUE TRCE | 8 |
| COLLONADE DR | 8 |
| LAKE WORTH RD | 8 |
| REGAL CT | 8 |
| STAIMFORD DR | 8 |
| STIRRUP LN | 8 |
| STRIBLING | 8 |
| STRIBLING WAY | 8 |
| THE 12TH FAIRWAY | 8 |
| Other | 143 |
2005 - 2018 National Fire Incident Reporting System (NFIRS) incidents
- Incident types reported to NFIRS in Wellington, FL
- 13,98569.6%Rescue & EMS
- 2,22111.1%Good Intent Call
- 1,6288.1%False Alarm
- 1,0585.3%Service Call
- 6373.2%Fire
- 5132.6%Hazardous Condition
- 240.1%Special Incident
- Fire incident types reported to NFIRS in Wellington, FL
- 28144.1%Outside Fires
- 23336.6%Structure Fires
- 9615.1%Mobile Property/Vehicle Fires
- 274.2%Other
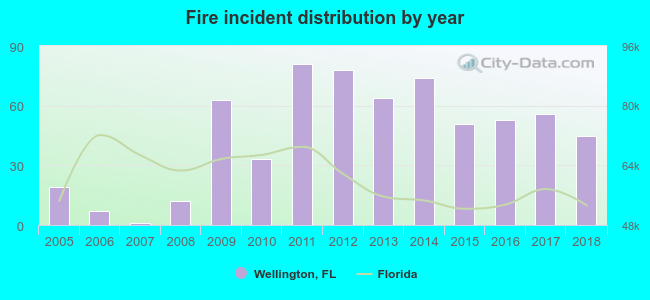 Based on the data from the years 2005 - 2018 the average number of fire incidents per year is 46. The highest number of reported fires - 81 took place in 2011, and the least - 1 in 2007. The data has a rising trend.
The average number of yearly fire incidents per 10k residents in Wellington, FL compared to nearest cities:
(Note: Based on data for the last 3 years, including only cities with population 5,000 and above)
| Wellington: | 8.3 |
| Royal Palm Beach: | 11.2 |
| Greenacres: | 14.3 |
| Palm Springs: | 22.6 |
| Glades: | 0.5 |
| West Palm Beach: | 39.1 |
| Lake Worth: | 28.6 |
| Lantana: | 26.1 |
| Palm Beach: | 41.6 |
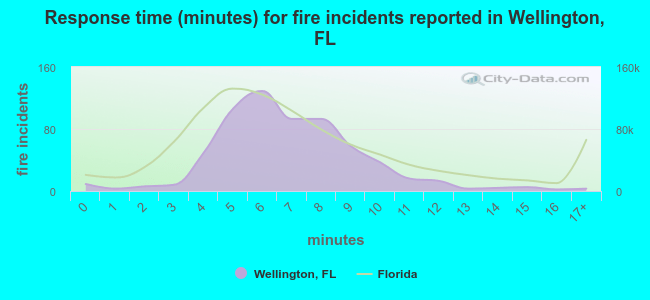 The median response time based on all reported fire incidents is 7 minutes. This is comparable to the Florida median value.
The median response time in Wellington, FL compared to nearest cities:
(Note: Based on data for all years, including only cities with at least 500 fire incidents)
| Wellington: | 7 minutes |
| Greenacres: | 5 minutes |
| West Palm Beach: | 6 minutes |
| Lake Worth: | 6 minutes |
| Boynton Beach: | 5 minutes |
| Riviera Beach: | 5 minutes |
| Palm Beach Gardens: | 6 minutes |
| North Palm Beach: | 5 minutes |
| Delray Beach: | 5 minutes |
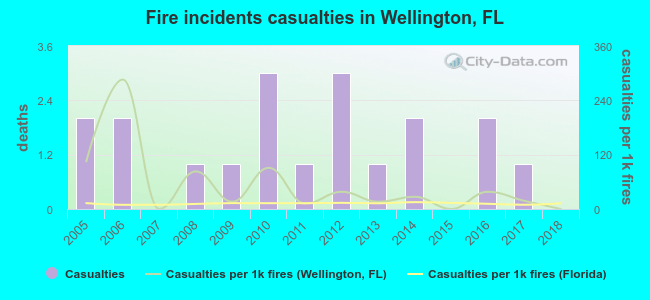 According to the reports from the years 2005 - 2018 the average number of fire-related yearly casualties is 1. The highest number of reported injuries - 3 took place in 2010, and the lowest - 0 in 2007. The data has a dropping trend.
The average number of injuries per 1,000 fires is 52. This indicator was the highest - 286 in 2006, and the lowest 0 in 2007. The trend for casualties per 1,000 fires is declining. Compared to the Florida value the number of casualties per 1,000 fires is much higher.
According to the reports from the years 2005 - 2018 the average number of fire-related yearly casualties is 1. The highest number of reported injuries - 3 took place in 2010, and the lowest - 0 in 2007. The data has a dropping trend.
The average number of injuries per 1,000 fires is 52. This indicator was the highest - 286 in 2006, and the lowest 0 in 2007. The trend for casualties per 1,000 fires is declining. Compared to the Florida value the number of casualties per 1,000 fires is much higher.Casualties per 1,000 incidents in Wellington, FL compared to nearest cities:
(Note: Based on data for all years, including only cities with at least 500 fire incidents)
| Wellington: | 29.8 |
| Greenacres: | 34.9 |
| West Palm Beach: | 23.5 |
| Lake Worth: | 38.4 |
| Boynton Beach: | 17.3 |
| Riviera Beach: | 50.2 |
| Palm Beach Gardens: | 4.4 |
| North Palm Beach: | 33.8 |
| Delray Beach: | 25.3 |
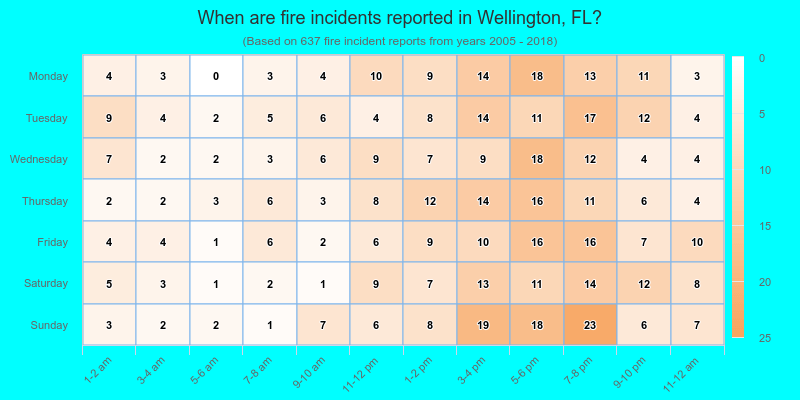
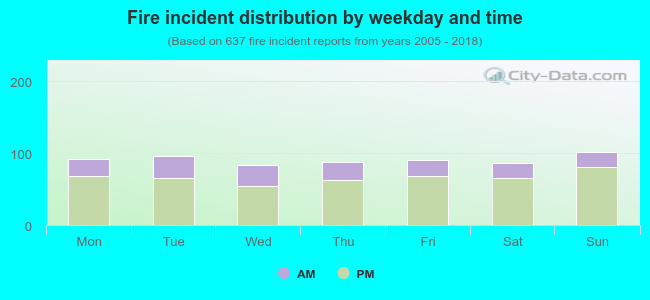 27.0% incidents where reported in the morning and 73.0% in the evening. The most fires (16.0%) took place on Sunday, and the least (13.0%) on Wednesday.
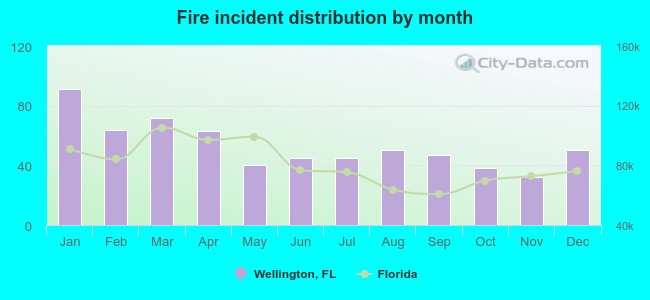 According to the 637 fires from years 2005 - 2018 most fires (14.3%) took place during January, and the least (5.0%) in November.
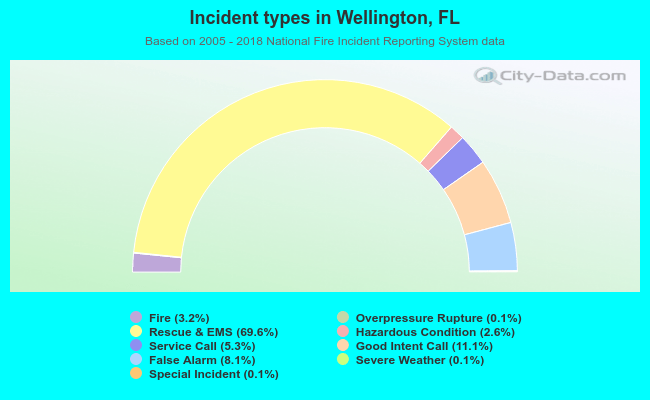 Out of all 20,094 cases reported during the years 2005 - 2018, the most belonged to the categories: Rescue & EMS (69.6%), Good Intent Call (11.1%), and False Alarm (8.1%).
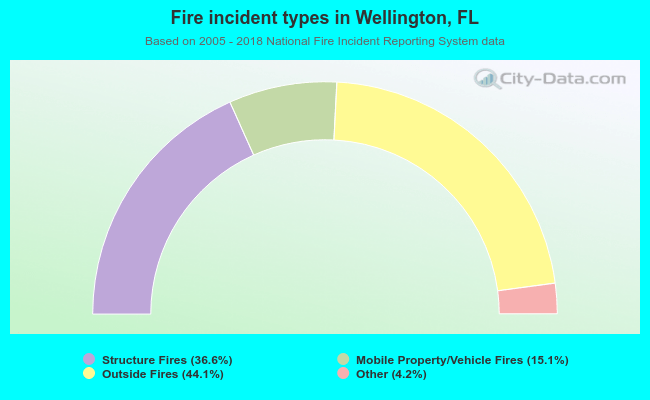 When looking into fire subcategories, the most incidents belonged to: Outside Fires (44.1%), and Structure Fires (36.6%).