Westborough: Fire Incidents, Massachusetts (MA)
Where are fire incidents reported in Westborough, MA
Something went wrong! Please refresh the page.
| Fire incidents reported | |
|---|---|
| Sreet name | Count |
| TURNPIKE RD | 604 |
| EAST MAIN ST | 160 |
| LYMAN ST | 138 |
| MASSACHUSETTS TPKE | 120 |
| MILK ST | 88 |
| FLANDERS RD | 82 |
| HOPKINTON RD | 64 |
| WESTBOROUGH | 64 |
| OAK ST | 62 |
| INTERSTATE 495 HWY | 60 |
| WEST MAIN ST | 60 |
| COMPUTER DR | 56 |
| MAYBERRY DR | 54 |
| CONNECTOR RD | 52 |
| E MAIN ST | 50 |
| TECHNOLOGY DR | 48 |
| SOUTH ST | 44 |
| SPRING RD | 40 |
| POWDER HILL WAY | 38 |
| RUGGLES ST | 36 |
| UNION ST | 36 |
| HOMESTEAD BLVD | 34 |
| WILLOW ST | 34 |
| OTIS ST | 30 |
| BEACH ST | 28 |
| FISHER ST | 26 |
| ADAMS ST | 24 |
| ROGERS RD | 22 |
| HIGH ST | 20 |
| WEST PARK DR | 20 |
2002 - 2018 National Fire Incident Reporting System (NFIRS) incidents
- Incident types reported to NFIRS in Westborough, MA
- 12,76358.9%Rescue & EMS
- 2,66712.3%False Alarm
- 2,45311.3%Hazardous Condition
- 1,6187.5%Fire
- 1,1655.4%Service Call
- 8964.1%Good Intent Call
- 370.2%Overpressure Rupture
- 360.2%Severe Weather
- 320.1%Special Incident
- Fire incident types reported to NFIRS in Westborough, MA
- 94958.7%Structure Fires
- 45428.1%Outside Fires
- 21113.0%Mobile Property/Vehicle Fires
- 40.2%Other
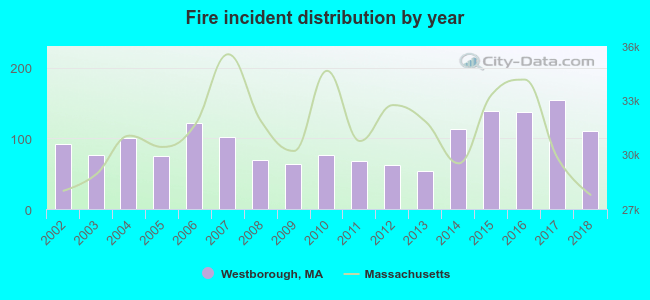 According to the data from the years 2002 - 2018 the average number of fire incidents per year is 95. The highest number of reported fires - 154 took place in 2017, and the least - 54 in 2013. The data has a rising trend.
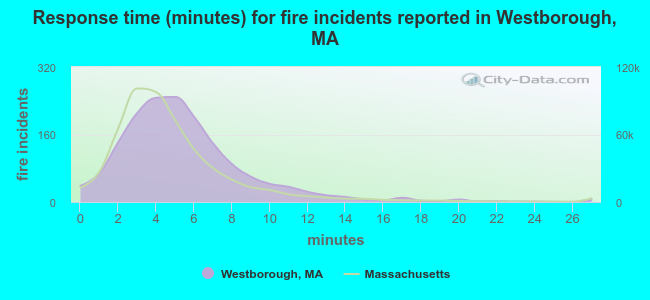 The median response time based on all reported fire incidents is 5 minutes. This is higher than the state median value.
The median response time in Westborough, MA compared to nearest cities:
(Note: Based on data for all years, including only cities with at least 500 fire incidents)
| Westborough: | 5 minutes |
| Northborough: | 6 minutes |
| Southborough: | 6 minutes |
| Shrewsbury: | 4 minutes |
| Hopkinton: | 6 minutes |
| Upton: | 5 minutes |
| Marlborough: | 5 minutes |
| Hudson: | 3 minutes |
| Millbury: | 6 minutes |
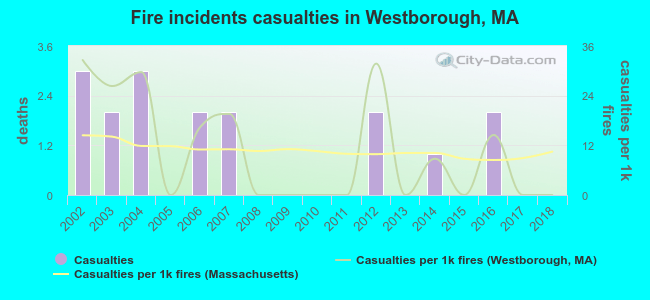 According to the data from the years 2002 - 2018 the average number of fire-related yearly casualties is 1. The highest number of reported injuries - 3 took place in 2002, and the lowest - 0 in 2005. The data has a decreasing trend.
The average number of casualties per 1,000 fires is 11. This indicator was the highest - 33 in 2002, and the lowest 0 in 2005. The trend for injuries per 1,000 incidents is dropping. Compared to the Massachusetts value the number of casualties per 1,000 fire incidents is similar.
According to the data from the years 2002 - 2018 the average number of fire-related yearly casualties is 1. The highest number of reported injuries - 3 took place in 2002, and the lowest - 0 in 2005. The data has a decreasing trend.
The average number of casualties per 1,000 fires is 11. This indicator was the highest - 33 in 2002, and the lowest 0 in 2005. The trend for injuries per 1,000 incidents is dropping. Compared to the Massachusetts value the number of casualties per 1,000 fire incidents is similar.Casualties per 1,000 incidents in Westborough, MA compared to nearest cities:
(Note: Based on data for all years, including only cities with at least 500 fire incidents)
| Westborough: | 10.5 |
| Northborough: | 18.2 |
| Southborough: | 16.8 |
| Shrewsbury: | 3.4 |
| Hopkinton: | 8.7 |
| Upton: | 1.6 |
| Marlborough: | 21.3 |
| Hudson: | 34.8 |
| Millbury: | 23.2 |
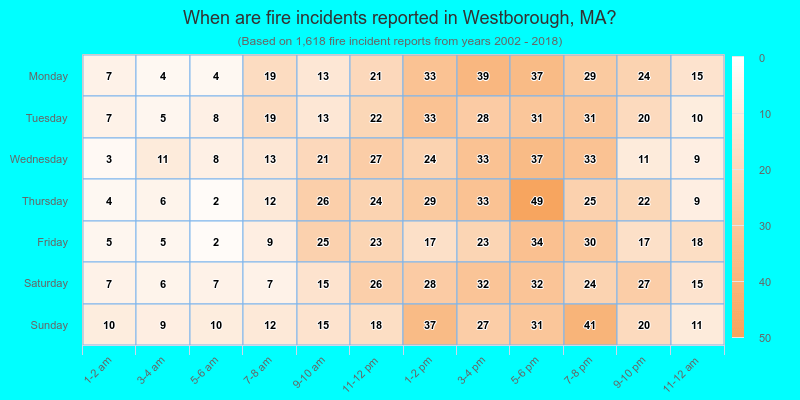
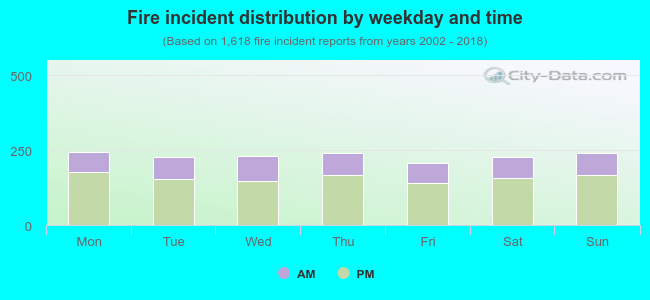 31.5% incidents where reported in the morning and 68.5% in the evening. The most fires (15.1%) took place on Monday, and the least (12.9%) on Friday.
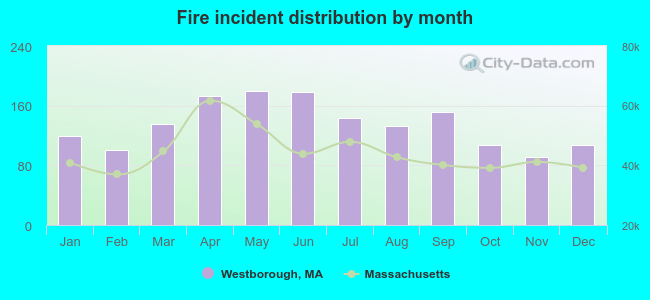 According to the 1,618 reports from years 2002 - 2018 most fires (11.1%) took place during May, and the least (5.6%) in November.
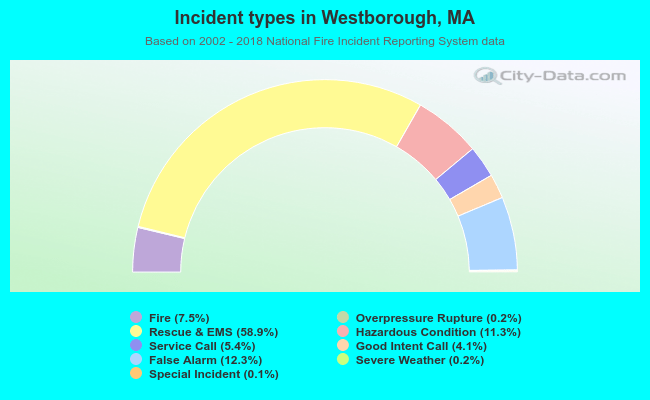 Out of all 21,667 cases reported during the years 2002 - 2018, the most belonged to the categories: Rescue & EMS (58.9%), False Alarm (12.3%), and Hazardous Condition (11.3%).
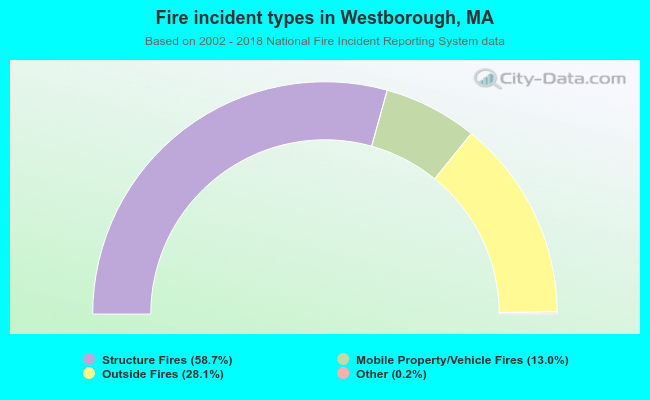 When looking into fire subcategories, the most incidents belonged to: Structure Fires (58.7%), and Outside Fires (28.1%).