Westport: Fire Incidents, Massachusetts (MA)
Where are fire incidents reported in Westport, MA
Something went wrong! Please refresh the page.
| Fire incidents reported | |
|---|---|
| Sreet name | Count |
| MAIN RD | 176 |
| STATE RD | 140 |
| DRIFT RD | 92 |
| SANFORD RD | 58 |
| AMERICAN LEGION HWY | 56 |
| CHARLOTTE WHITE RD | 56 |
| SODOM RD | 50 |
| ADAMSVILLE RD | 46 |
| GIFFORD RD | 44 |
| RIVER RD | 42 |
| JOHN REED RD | 40 |
| OLD BEDFORD RD | 40 |
| PINE HILL RD | 40 |
| OLD COUNTY RD | 30 |
| CORNELL RD | 26 |
| DIVISION RD | 26 |
| HORSENECK RD | 26 |
| BRIGGS RD | 24 |
| DAVIS RD | 24 |
| OLD HARBOR RD | 24 |
| HIGHLAND AVE | 18 |
| HIXBRIDGE RD | 18 |
| NARROW AVE | 18 |
| TICKLE RD | 18 |
| BLOSSOM RD | 16 |
| HIX BRIDGE RD | 16 |
| FISHER RD | 14 |
| HOWLAND RD | 14 |
| ROBERT ST | 14 |
| AMERICAN LEGION HIGHWAY HWY | 12 |
2002 - 2018 National Fire Incident Reporting System (NFIRS) incidents
- Incident types reported to NFIRS in Westport, MA
- 1,16325.4%Fire
- 82918.1%Hazardous Condition
- 80517.5%False Alarm
- 77316.9%Service Call
- 50711.1%Rescue & EMS
- 4189.1%Good Intent Call
- 641.4%Special Incident
- 170.4%Overpressure Rupture
- 110.2%Severe Weather
- Fire incident types reported to NFIRS in Westport, MA
- 55647.8%Outside Fires
- 30726.4%Structure Fires
- 16414.1%Mobile Property/Vehicle Fires
- 13611.7%Other
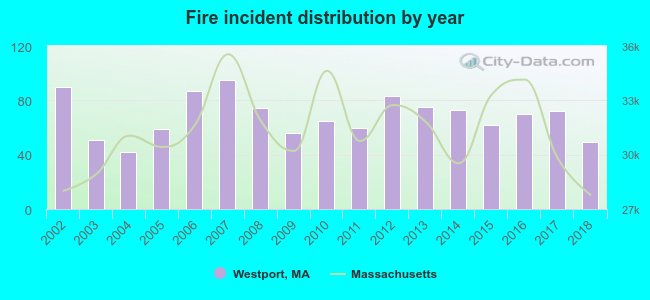 Based on the data from the years 2002 - 2018 the average number of fire incidents per year is 68. The highest number of reported fires - 95 took place in 2007, and the least - 42 in 2004. The data has a decreasing trend.
The average number of yearly fire incidents per 10k residents in Westport, MA compared to nearest cities:
(Note: Based on data for the last 3 years, including only cities with population 5,000 and above)
| Westport: | 41.0 |
| Dartmouth: | 22.3 |
| Fall River: | 48.8 |
| New Bedford: | 46.5 |
| Fairhaven: | 30.2 |
| Somerset: | 22.0 |
| Acushnet: | 21.7 |
| Swansea: | 42.2 |
| Freetown: | 4.5 |
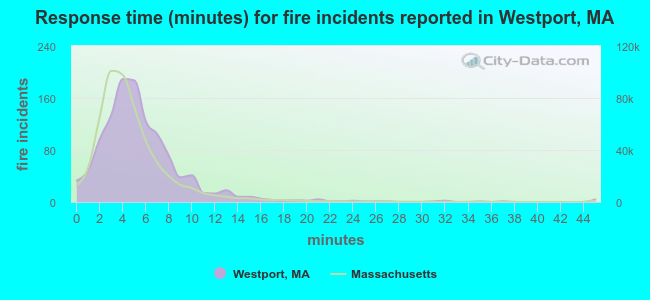 The median response time based on all reported fire incidents is 5 minutes. This is higher than the state median value.
The median response time in Westport, MA compared to nearest cities:
(Note: Based on data for all years, including only cities with at least 500 fire incidents)
| Westport: | 5 minutes |
| Dartmouth: | 6 minutes |
| Fall River: | 5 minutes |
| New Bedford: | 4 minutes |
| Fairhaven: | 3 minutes |
| Somerset: | 6 minutes |
| Swansea: | 7 minutes |
| Lakeville: | 6 minutes |
| Rehoboth: | 6 minutes |
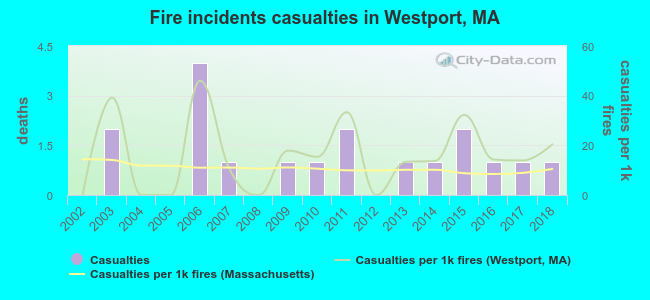 Based on the reports from the years 2002 - 2018 the average number of fire-related casualties per year is 1. The highest number of reported casualties - 4 took place in 2006, and the lowest - 0 in 2002. The data has an increasing trend.
The average number of casualties per 1,000 fires is 16. This indicator was the highest - 46 in 2006, and the lowest 0 in 2002. The trend for injuries per 1,000 fire incidents is increasing. Compared to the Massachusetts value the number of injuries per 1,000 fires is higher.
Based on the reports from the years 2002 - 2018 the average number of fire-related casualties per year is 1. The highest number of reported casualties - 4 took place in 2006, and the lowest - 0 in 2002. The data has an increasing trend.
The average number of casualties per 1,000 fires is 16. This indicator was the highest - 46 in 2006, and the lowest 0 in 2002. The trend for injuries per 1,000 fire incidents is increasing. Compared to the Massachusetts value the number of injuries per 1,000 fires is higher.Casualties per 1,000 incidents in Westport, MA compared to nearest cities:
(Note: Based on data for all years, including only cities with at least 500 fire incidents)
| Westport: | 15.5 |
| Dartmouth: | 5.9 |
| Fall River: | 26.2 |
| New Bedford: | 21.2 |
| Fairhaven: | 25.7 |
| Somerset: | 17.1 |
| Swansea: | 9.5 |
| Lakeville: | 0.0 |
| Rehoboth: | 10.5 |
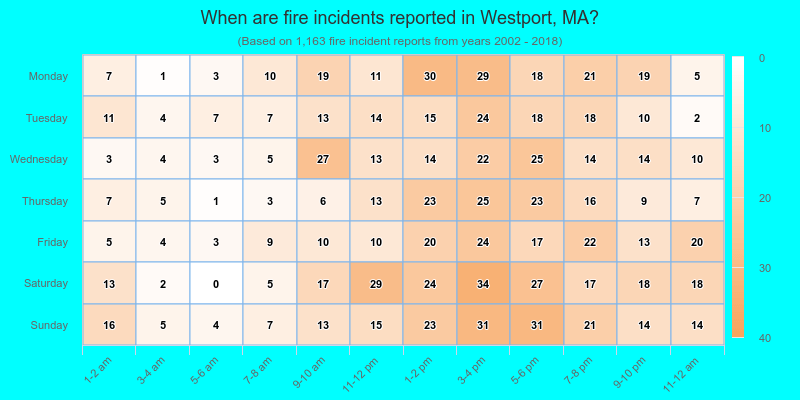
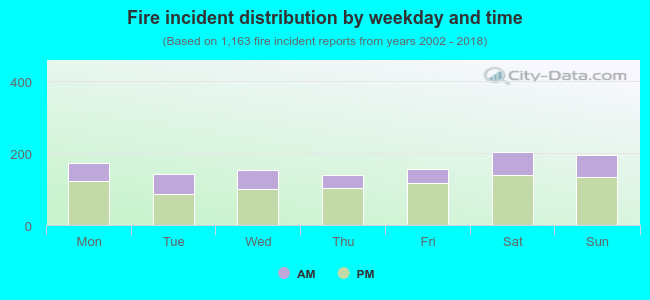 31.3% incidents where reported in the morning and 68.7% in the evening. The most fires (17.5%) took place on Saturday, and the least (11.9%) on Thursday.
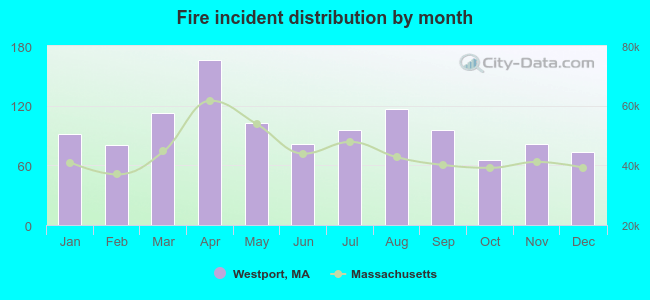 According to the 1,163 fire incident reports from years 2002 - 2018 most fires (14.3%) took place during April, and the least (5.6%) in October.
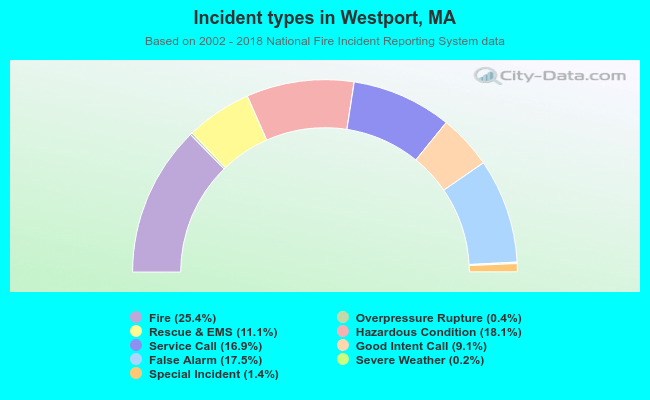 Out of all 4,587 cases reported during the years 2002 - 2018, the most belonged to the categories: Fire (25.4%), Hazardous Condition (18.1%), and False Alarm (17.5%).
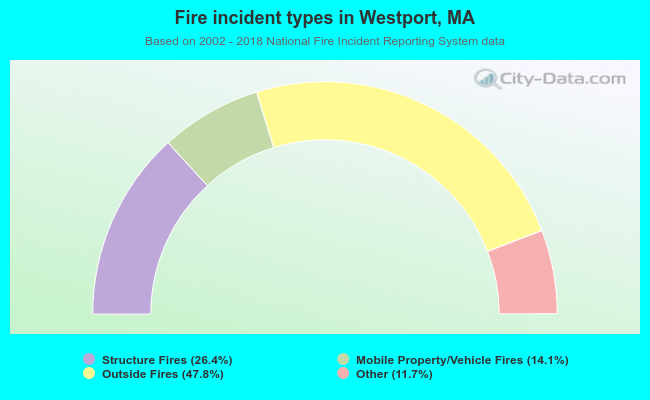 When looking into fire subcategories, the most reports belonged to: Outside Fires (47.8%), and Structure Fires (26.4%).