White Bear Lake: Fire Incidents, Minnesota (MN)
Where are fire incidents reported in White Bear Lake, MN
Something went wrong! Please refresh the page.
| Fire incidents reported | |
|---|---|
| Sreet name | Count |
| HWY 61 | 78 |
| HWY 96 | 70 |
| I35E | 56 |
| CENTURY AV | 52 |
| CTY RD | 52 |
| 9TH ST | 46 |
| HOFFMAN RD | 46 |
| COUNTY RD F | 44 |
| 4TH ST | 42 |
| CENTERVILLE RD | 42 |
| MCKNIGHT RD | 42 |
| BIRCH ST | 40 |
| I694 | 40 |
| WHITE BEAR AV | 40 |
| OTTER LAKE RD | 34 |
| CENTURY AVE | 30 |
| BELLAIRE AV | 28 |
| DIVISION ST | 26 |
| ORCHARD LA | 24 |
| WHITE BEAR AVE | 24 |
| CEDAR AV | 22 |
| LAKE AV | 20 |
| PARK ST | 20 |
| WILDWOOD AV | 20 |
| BALD EAGLE AV | 18 |
| FLORENCE ST | 18 |
| LINDEN ST | 18 |
| BALD EAGLE BLVD | 16 |
| COUNTY RD J | 16 |
| FLORAL DR | 16 |
| Other | 110 |
2002 - 2018 National Fire Incident Reporting System (NFIRS) incidents
- Incident types reported to NFIRS in White Bear Lake, MN
- 1,72331.7%Rescue & EMS
- 1,15021.1%Fire
- 1,10420.3%Hazardous Condition
- 67912.5%False Alarm
- 4287.9%Good Intent Call
- 3446.3%Service Call
- 70.1%Overpressure Rupture
- Fire incident types reported to NFIRS in White Bear Lake, MN
- 54547.4%Structure Fires
- 35831.1%Outside Fires
- 23020.0%Mobile Property/Vehicle Fires
- 171.5%Other
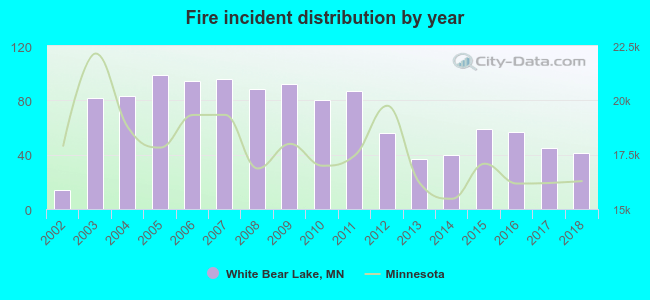 Based on the data from the years 2002 - 2018 the average number of fires per year is 68. The highest number of fires - 99 took place in 2005, and the least - 14 in 2002. The data has a rising trend.
The average number of yearly fire incidents per 10k residents in White Bear Lake, MN compared to nearest cities:
(Note: Based on data for the last 3 years, including only cities with population 5,000 and above)
| White Bear Lake: | 19.1 |
| Mahtomedi: | 12.8 |
| Vadnais Heights: | 27.4 |
| Little Canada: | 43.0 |
| Maplewood: | 31.1 |
| Oakdale: | 18.4 |
| Hugo: | 19.2 |
| Shoreview: | 11.8 |
| Lake Elmo: | 38.5 |
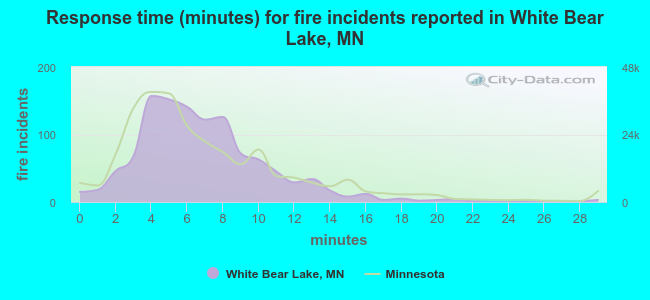 The median response time based on all reported fire incidents is 6 minutes. This is about the same as the Minnesota median value.
The median response time in White Bear Lake, MN compared to nearest cities:
(Note: Based on data for all years, including only cities with at least 500 fire incidents)
| White Bear Lake: | 6 minutes |
| Vadnais Heights: | 6 minutes |
| Little Canada: | 3 minutes |
| Maplewood: | 5 minutes |
| Oakdale: | 5 minutes |
| Hugo: | 9 minutes |
| Shoreview: | 6 minutes |
| Lake Elmo: | 7 minutes |
| Roseville: | 5 minutes |
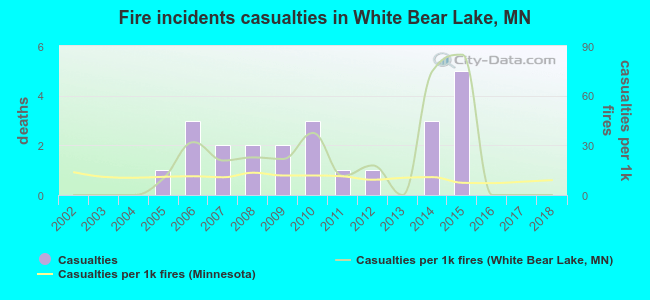 Based on the reports from the years 2002 - 2018 the average number of fire-related casualties per year is 1. The highest number of reported injuries - 5 took place in 2015, and the lowest - 0 in 2002. The data has a constant trend.
The average number of casualties per 1,000 fires is 20. This indicator was the highest - 85 in 2015, and the lowest 0 in 2002. The trend for casualties per 1,000 incidents is declining. Compared to the Minnesota value the number of injuries per 1,000 incidents is higher.
Based on the reports from the years 2002 - 2018 the average number of fire-related casualties per year is 1. The highest number of reported injuries - 5 took place in 2015, and the lowest - 0 in 2002. The data has a constant trend.
The average number of casualties per 1,000 fires is 20. This indicator was the highest - 85 in 2015, and the lowest 0 in 2002. The trend for casualties per 1,000 incidents is declining. Compared to the Minnesota value the number of injuries per 1,000 incidents is higher.Casualties per 1,000 incidents in White Bear Lake, MN compared to nearest cities:
(Note: Based on data for all years, including only cities with at least 500 fire incidents)
| White Bear Lake: | 20.0 |
| Vadnais Heights: | 5.9 |
| Little Canada: | 2.6 |
| Maplewood: | 5.2 |
| Oakdale: | 11.8 |
| Hugo: | 0.0 |
| Shoreview: | 14.0 |
| Lake Elmo: | 7.0 |
| Roseville: | 15.3 |
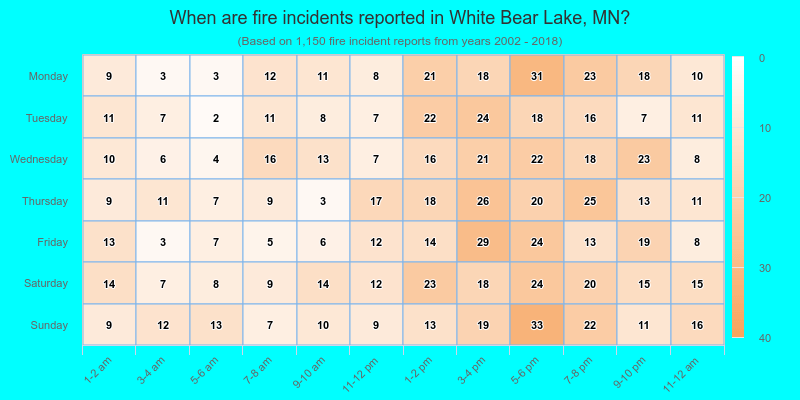
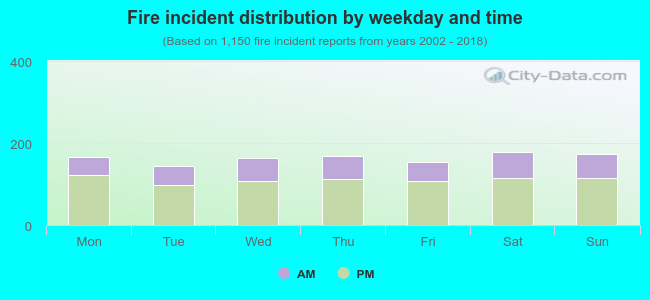 32.5% incidents where reported in the morning and 67.5% in the evening. The most fires (15.6%) took place on Saturday, and the least (12.5%) on Tuesday.
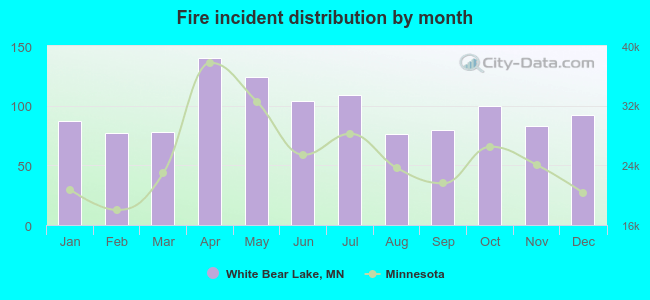 Based on the 1,150 fire incident reports from years 2002 - 2018 most fires (12.2%) took place during April, and the least (6.6%) in August.
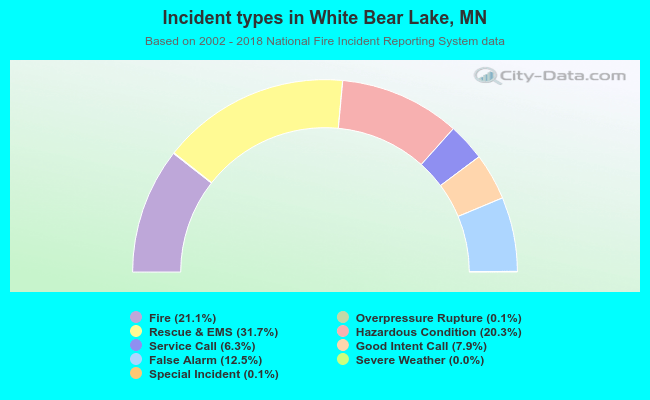 Out of all 5,439 cases reported during the years 2002 - 2018, the most belonged to the categories: Rescue & EMS (31.7%), Fire (21.1%), and Hazardous Condition (20.3%).
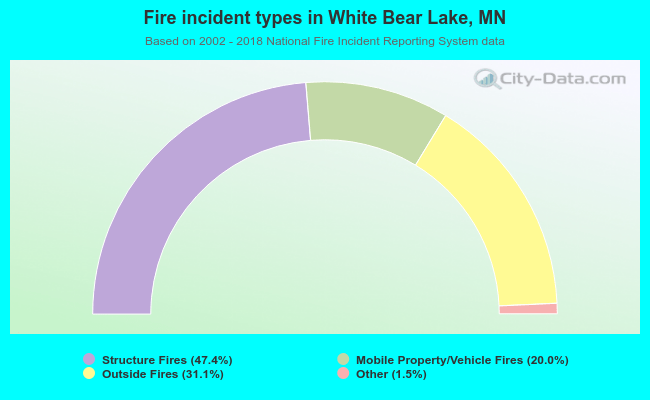 When looking into fire subcategories, the most reports belonged to: Structure Fires (47.4%), and Outside Fires (31.1%).