Whitney Point: Fire Incidents, New York (NY)
Where are fire incidents reported in Whitney Point, NY
Something went wrong! Please refresh the page.
|
| |||||||||||||||||||||||||||||||||||||||||||||||||||||||||||||||||||||||||||||||||||||||||||||||||||||||||||||
2002 - 2018 National Fire Incident Reporting System (NFIRS) incidents
- Incident types reported to NFIRS in Whitney Point, NY
- 27332.2%Fire
- 13415.8%Good Intent Call
- 13115.5%Rescue & EMS
- 13115.5%Hazardous Condition
- 9010.6%Service Call
- 728.5%False Alarm
- 121.4%Severe Weather
- 20.2%Overpressure Rupture
- 20.2%Special Incident
- Fire incident types reported to NFIRS in Whitney Point, NY
- 15356.0%Structure Fires
- 5219.0%Outside Fires
- 4616.8%Mobile Property/Vehicle Fires
- 228.1%Other
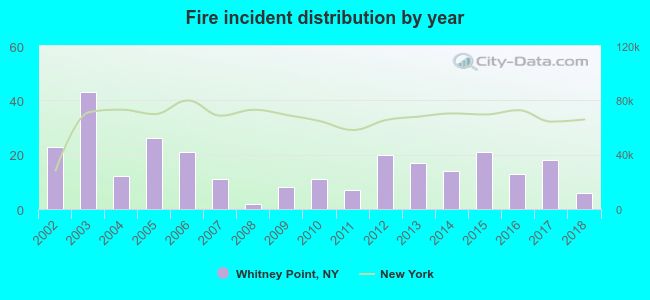 Based on the data from the years 2002 - 2018 the average number of fires per year is 16. The highest number of fire incidents - 43 took place in 2003, and the least - 2 in 2008. The data has a declining trend.
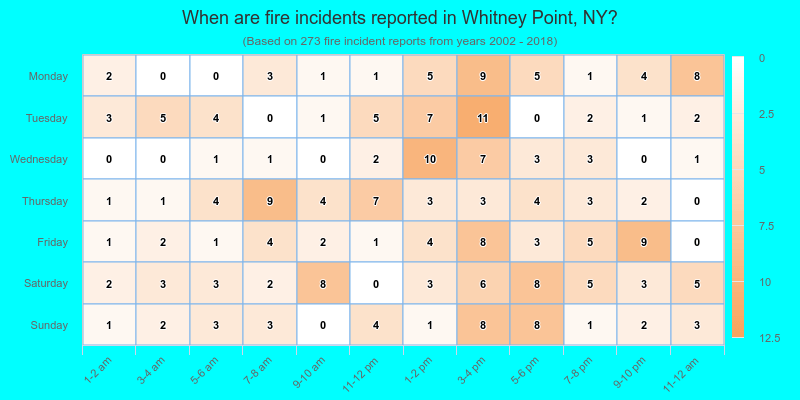
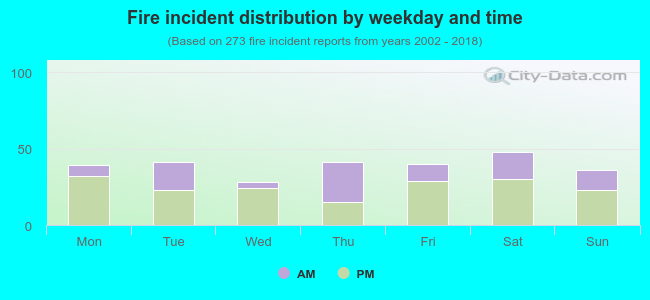 35.5% incidents where reported in the morning and 64.5% in the evening. The most fires (17.6%) took place on Saturday, and the least (10.3%) on Wednesday.
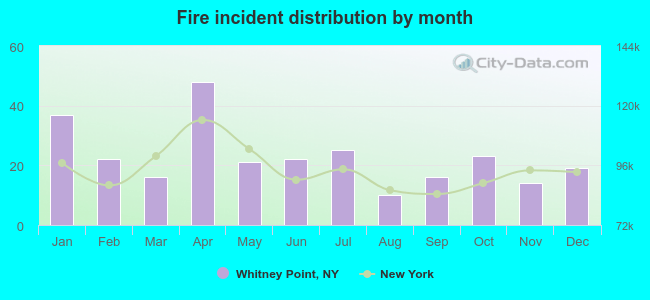 According to the 273 incident reports from years 2002 - 2018 most fires (17.6%) took place during April, and the least (3.7%) in August.
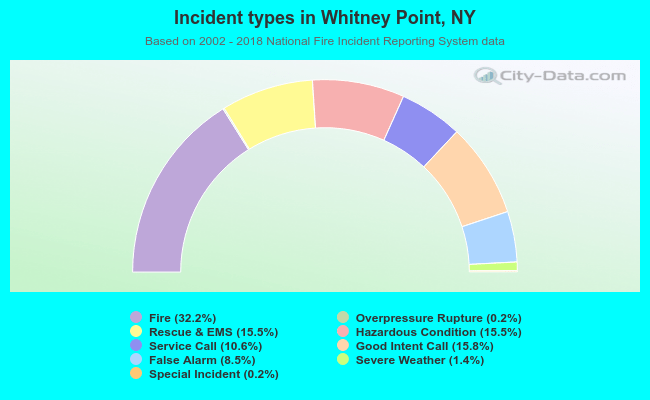 Out of all 847 cases reported during the years 2002 - 2018, the most belonged to the categories: Fire (32.2%), Good Intent Call (15.8%), and Rescue & EMS (15.5%).
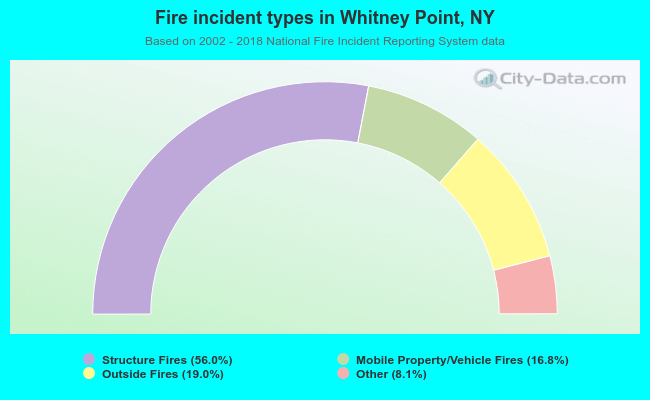 When looking into fire subcategories, the most reports belonged to: Structure Fires (56.0%), and Outside Fires (19.0%).