| Fire incidents reported |
|---|
| Sreet name | Count |
|---|
| INDUSTRIAL RD | 54 | | MAIN ST | 34 | | HOGG RIDGE RD | 22 | | STEWARTSVILLE RD | 22 | | BARNES RD | 20 | | INTERSTATE 75 -NORTH BOUND | 20 | | INTERSTATE 75-SOUTH BOUND | 20 | | FALMOUTH ST | 18 | | CHIPMAN RIDGE RD | 16 | | CORDOVA RD | 16 | | FALMOUTH RD | 16 | | WATERWORKS RD | 16 | | CHERRY HILL DR | 12 | | HUMES RIDGE RD | 12 | | INTERSTATE 75 EXPY | 12 | | LAWRENCEVILLE RD | 12 | | BATON ROUGE RD | 10 | | HEEKIN LAWRENCEVILLE RD | 10 | | I75 | 10 | | SHIELDS SHINKLE RD | 10 | | CYNTHIANA RD | 8 | | I 75 | 8 | | STONE SCHOOL HOUSE RD | 8 | | AMMERMAN RD | 6 | | ARROWHEAD DR | 6 |
| | | Fire incidents reported |
|---|
| Sreet name | Count |
|---|
| ASHBROOK RD | 6 | | CORDOVA ROAD RD | 6 | | DIXIE HIGHWAY HWY | 6 | | DIXIE HWY | 6 | | HEEKIN LAWRENCEVILLE ROAD RD | 6 | | HEEKIN-LAWRENCEVILLE RD | 6 | | I-75 EXPY | 6 | | LAKEVIEW DR | 6 | | REED KINMAN RD | 6 | | STONE SCHOOL RD. RD | 6 | | SUNSET DR | 6 | | TAFT HWY | 6 | | ADAMS RD | 4 | | BLANCHE AVE | 4 | | CHAPMAN RD | 4 | | CORINTH RD | 4 | | FAIRVIEW RD | 4 | | GUMLICK RD | 4 | | HAMPSHIRE DR | 4 | | HARBOR CT | 4 | | HEEKIN CLARKS CREEK RD | 4 | | HEEKIN ROAD RD | 4 | | HELTON RD | 4 | | HIGH TOWER TIBELLMAN RD. RD | 4 | | HUMES RIDGE ROAD | 4 |
|
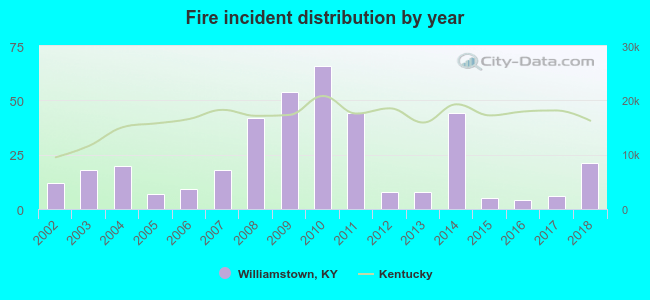 According to the data from the years 2002 - 2018 the average number of fires per year is 23. The highest number of reported fire incidents - 66 took place in 2010, and the least - 4 in 2016. The data has a growing trend.
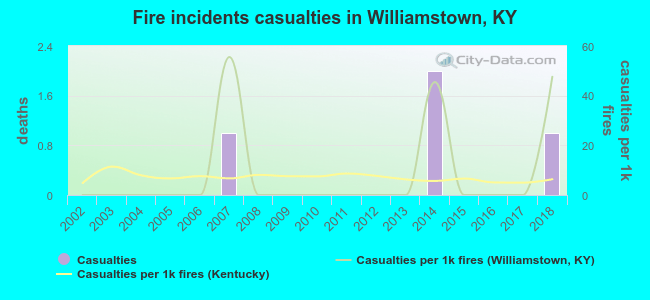 According to the reports from the years 2002 - 2018 the average number of fire-related yearly casualties is 0. The highest number of reported casualties - 2 took place in 2014, and the lowest - 0 in 2002. The data has a growing trend.
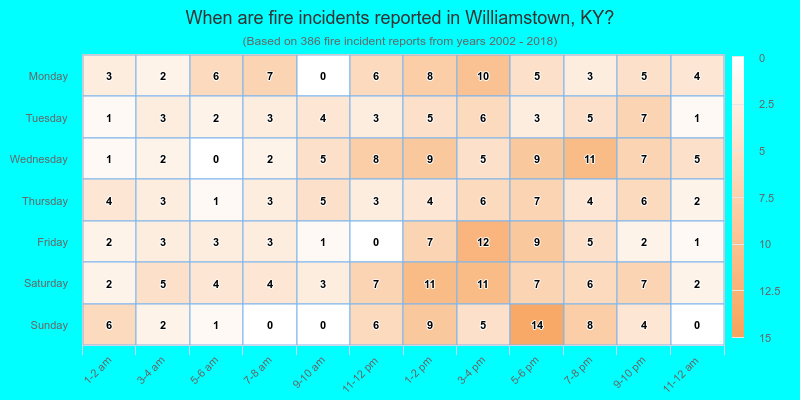
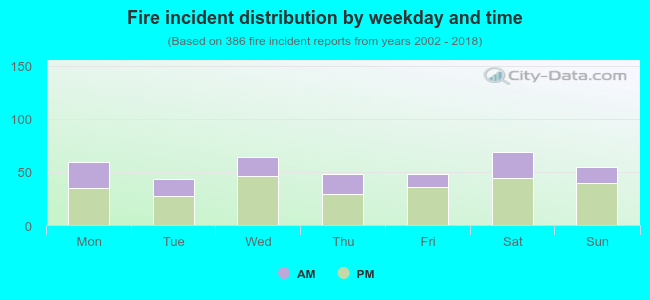 33.4% incidents where reported in the morning and 66.6% in the evening. The most fires (17.9%) took place on Saturday, and the least (11.1%) on Tuesday.
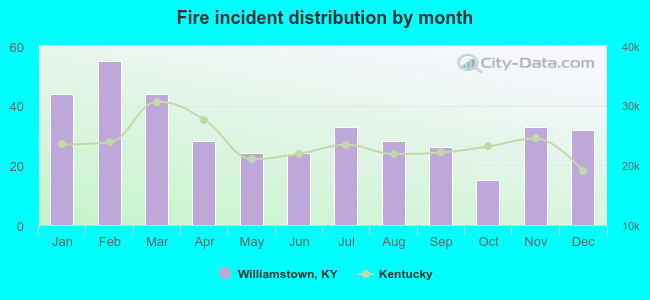 According to the 386 reports from years 2002 - 2018 most fires (14.2%) took place during February, and the least (3.9%) in October.
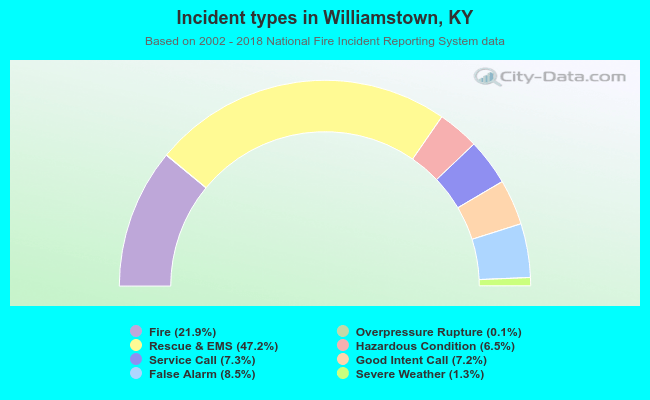 Out of all 1,759 cases reported during the years 2002 - 2018, the most belonged to the categories: Rescue & EMS (47.2%), Fire (21.9%), and False Alarm (8.5%).
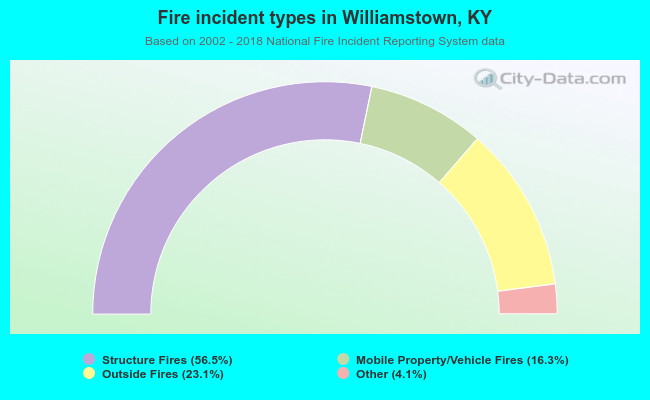 When looking into fire subcategories, the most reports belonged to: Structure Fires (56.5%), and Outside Fires (23.1%).