| Fire incidents reported |
|---|
| Sreet name | Count |
|---|
| INTERSTATE 55 | 44 | | HIGHWAY 61 | 40 | | HIGHWAY 14 | 30 | | UNION STRE | 24 | | HIGHWAY 119 | 12 | | JEFFERSON | 12 | | ADAMS ST | 8 | | JACKSON | 8 | | UNION | 8 | | COUNTY RD | 6 | | COUNTY ROAD | 6 | | HARRISON | 6 | | HWY 61 | 6 | | INTERSTATE 55 HWY | 6 | | JEFFERSON ST | 6 | | LEVEE VIEW | 6 | | 55 INTE | 4 | | 61 HWY | 4 | | ADAMS | 4 | | COUNTY ROAD 375 | 4 | | COUNTY ROAD 407 | 4 | | COUNTY ROAD 956 | 4 | | ELM STRE | 4 | | HIGHWAY 61 HWY | 4 | | INTERSTATE 55 INTE | 4 |
| | | Fire incidents reported |
|---|
| Sreet name | Count |
|---|
| JACKSON STRE | 4 | | 119 & 61 HWY | 2 | | 14 HWY | 2 | | 41 JACKSON ST | 2 | | 61 HIGHWAY HWY | 2 | | ADAMS STRE | 2 | | ADAMS STREET | 2 | | COLE STRE | 2 | | COUNTRY ROAD | 2 | | COUNTY 924 RD | 2 | | COUNTY RD 535 | 2 | | COUNTY ROAD | 2 | | COUNTY ROAD 1006 | 2 | | COUNTY ROAD 285 | 2 | | COUNTY ROAD 391 | 2 | | COUNTY ROAD 447 | 2 | | COUNTY ROAD 449 | 2 | | COUNTY ROAD 535 | 2 | | CRANE ROAD ISLAND 35 | 2 | | CROSSTOWN | 2 | | CYPRESS STRE | 2 | | DOGWOOD | 2 | | DOGWOOD LGTS | 2 | | DRIVE STRE | 2 | | |
|
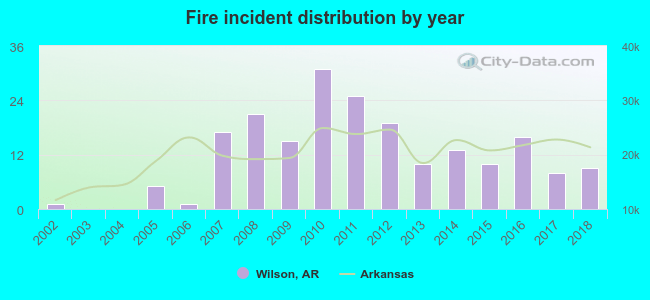 According to the data from the years 2002 - 2018 the average number of fire incidents per year is 12. The highest number of reported fire incidents - 31 took place in 2010, and the least - 0 in 2003. The data has an increasing trend.
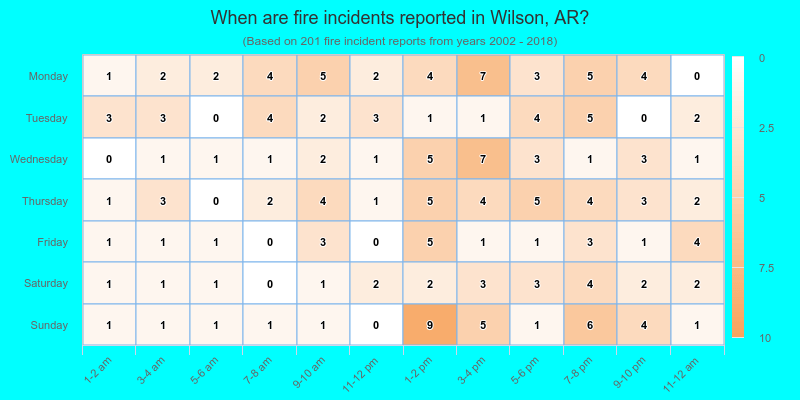
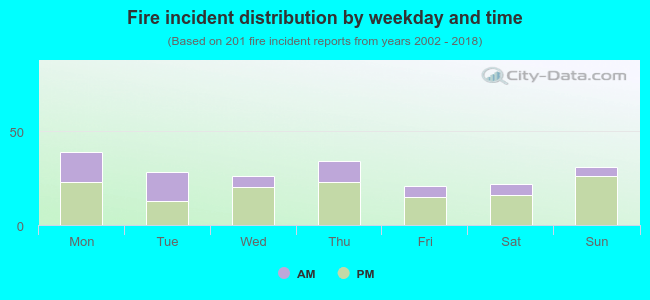 32.3% incidents where reported in the morning and 67.7% in the evening. The most fires (19.4%) took place on Monday, and the least (10.4%) on Friday.
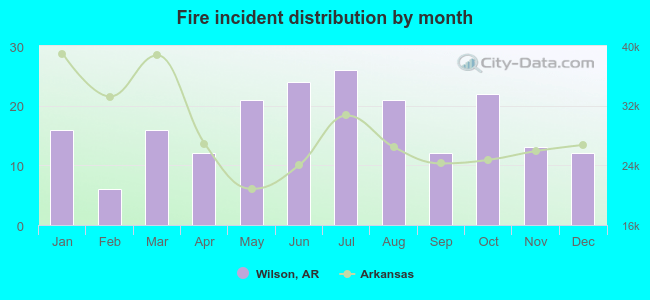 Based on the 201 fires from years 2002 - 2018 most fires (12.9%) took place during July, and the least (3.0%) in February.
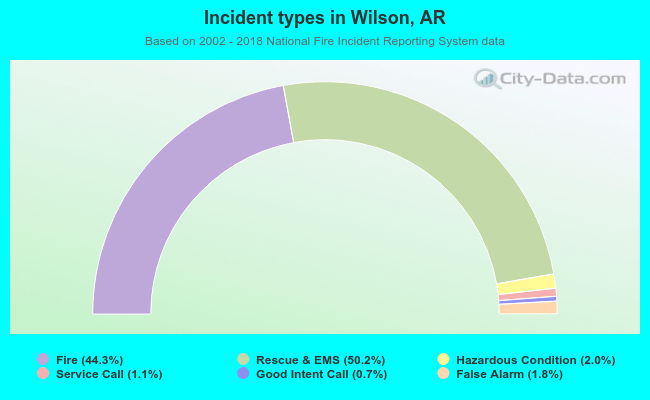 Out of all 454 cases reported during the years 2002 - 2018, the most belonged to the categories: Overpressure Rupture (50.2%), Fire (44.3%), and Rescue & EMS (2.0%).
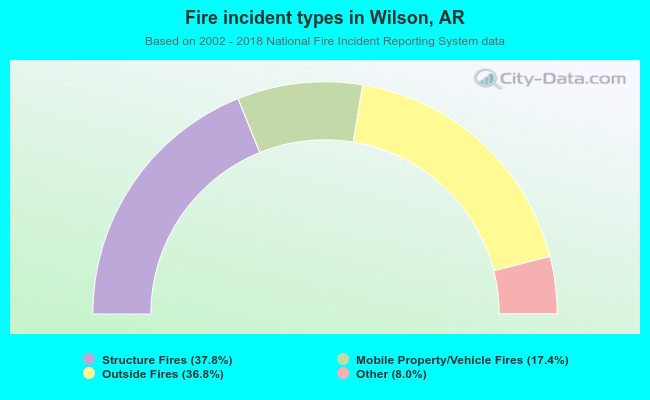 When looking into fire subcategories, the most incidents belonged to: Structure Fires (37.8%), and Outside Fires (36.8%).