Winslow: Fire Incidents, Maine (ME)
Where are fire incidents reported in Winslow, ME
Something went wrong! Please refresh the page.
|
| |||||||||||||||||||||||||||||||||||||||||||||||||||||||||||||||||||||||||||||||||||||||||||||||||||||||||||||
2003 - 2018 National Fire Incident Reporting System (NFIRS) incidents
- Incident types reported to NFIRS in Winslow, ME
- 5,05866.0%Rescue & EMS
- 1,05713.8%Service Call
- 4746.2%Hazardous Condition
- 4646.1%Fire
- 2663.5%Good Intent Call
- 2623.4%False Alarm
- 751.0%Special Incident
- Fire incident types reported to NFIRS in Winslow, ME
- 27358.8%Structure Fires
- 10121.8%Outside Fires
- 5511.9%Mobile Property/Vehicle Fires
- 357.5%Other
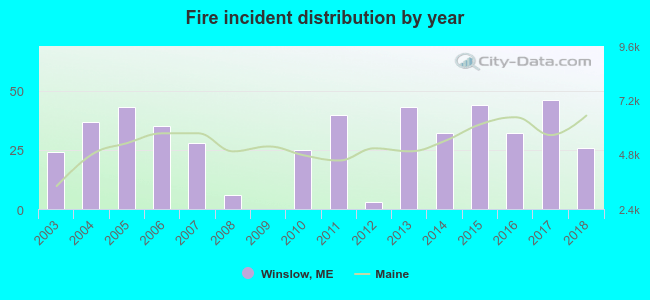 According to the data from the years 2003 - 2018 the average number of fire incidents per year is 29. The highest number of fire incidents - 46 took place in 2017, and the least - 0 in 2009. The data has a growing trend.
The average number of yearly fire incidents per 10k residents in Winslow, ME compared to nearest cities:
(Note: Based on data for the last 3 years, including only cities with population 5,000 and above)
| Winslow: | 44.5 |
| Waterville: | 71.3 |
| Skowhegan: | 84.7 |
| Augusta: | 88.2 |
| Gardiner: | 62.8 |
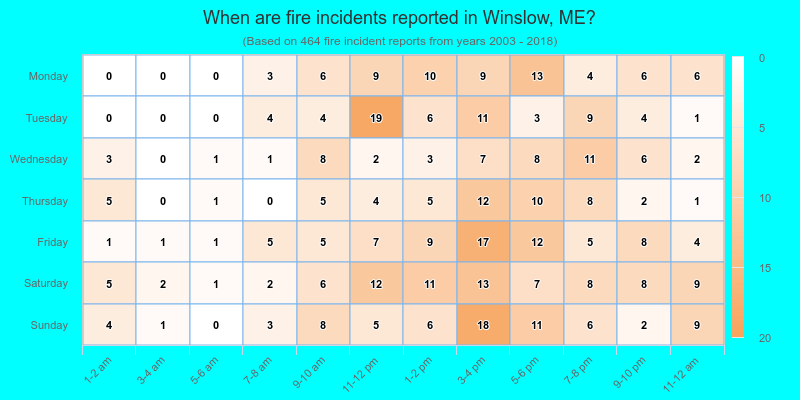
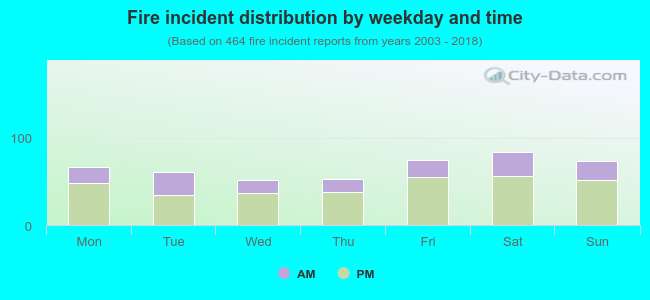 31.0% incidents where reported in the morning and 69.0% in the evening. The most fires (18.1%) took place on Saturday, and the least (11.2%) on Wednesday.
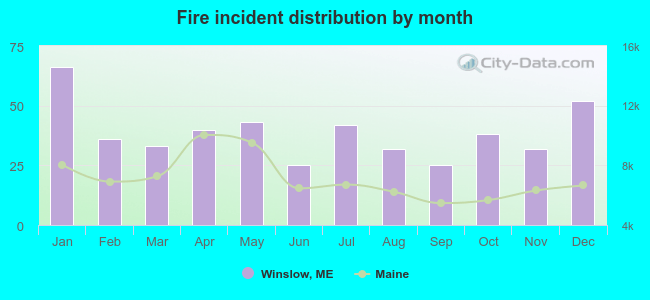 Based on the 464 reports from years 2003 - 2018 most fires (14.2%) took place during January, and the least (5.4%) in June.
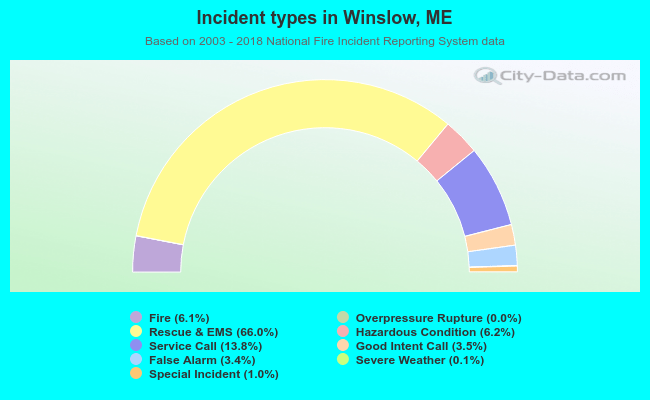 Out of all 7,662 cases reported during the years 2003 - 2018, the most belonged to the categories: Rescue & EMS (66.0%), Service Call (13.8%), and Hazardous Condition (6.2%).
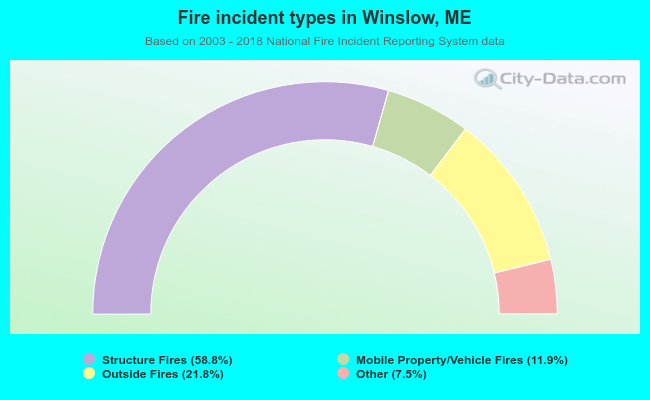 When looking into fire subcategories, the most incidents belonged to: Structure Fires (58.8%), and Outside Fires (21.8%).