Winston: Fire Incidents, Oregon (OR)
Where are fire incidents reported in Winston, OR
Something went wrong! Please refresh the page.
|
| |||||||||||||||||||||||||||||||||||||||||||||||||||||||||||||||||||||||||||||||||||||||||||||||||||||||||||||
2002 - 2018 National Fire Incident Reporting System (NFIRS) incidents
- Incident types reported to NFIRS in Winston, OR
- 1,95856.5%Rescue & EMS
- 49214.2%Fire
- 48714.0%Good Intent Call
- 3229.3%Service Call
- 1584.6%Hazardous Condition
- 481.4%False Alarm
- Fire incident types reported to NFIRS in Winston, OR
- 21944.5%Structure Fires
- 18738.0%Outside Fires
- 5912.0%Mobile Property/Vehicle Fires
- 275.5%Other
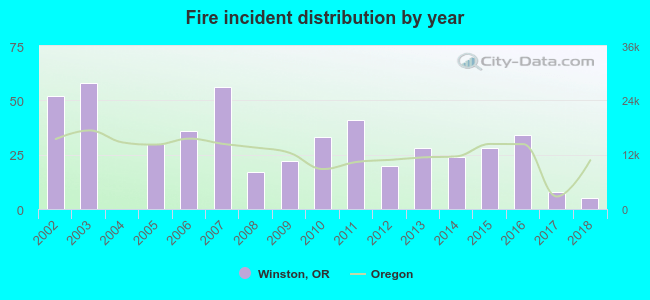 According to the data from the years 2002 - 2018 the average number of fire incidents per year is 29. The highest number of reported fire incidents - 58 took place in 2003, and the least - 0 in 2004. The data has a declining trend.
The average number of yearly fire incidents per 10k residents in Winston, OR compared to nearest cities:
(Note: Based on data for the last 3 years, including only cities with population 5,000 and above)
| Winston: | 29.3 |
| Tenmile: | 2.1 |
| Roseburg: | 41.5 |
| Roseburg North: | 16.9 |
| Sutherlin: | 33.9 |
| Coos Bay: | 20.8 |
| North Bend: | 23.1 |
| Grants Pass: | 44.5 |
| Cottage Grove: | 26.7 |
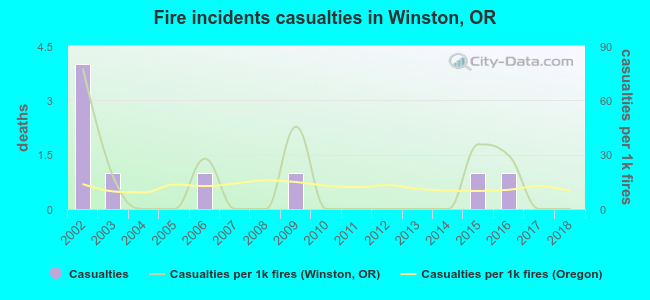 Based on the reports from the years 2002 - 2018 the average number of fire-related casualties per year is 1. The highest number of casualties - 4 took place in 2002, and the lowest - 0 in 2004. The data has a decreasing trend.
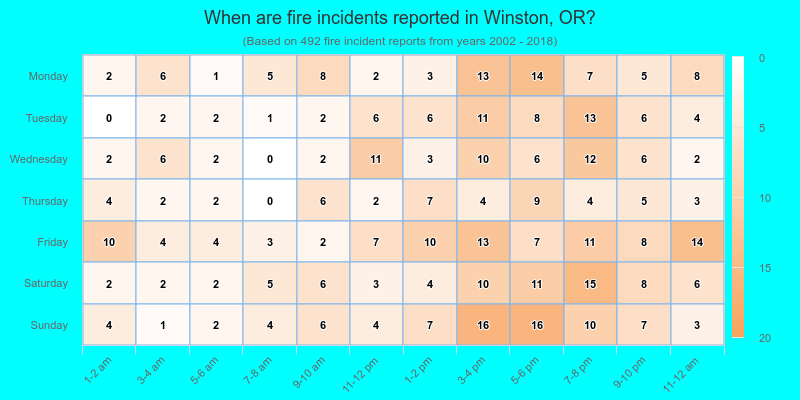
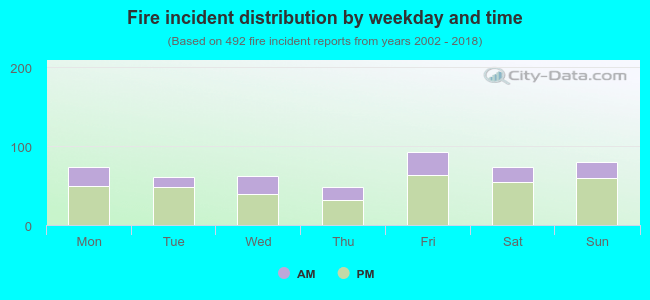 29.9% incidents where reported in the morning and 70.1% in the evening. The most fires (18.9%) took place on Friday, and the least (9.8%) on Thursday.
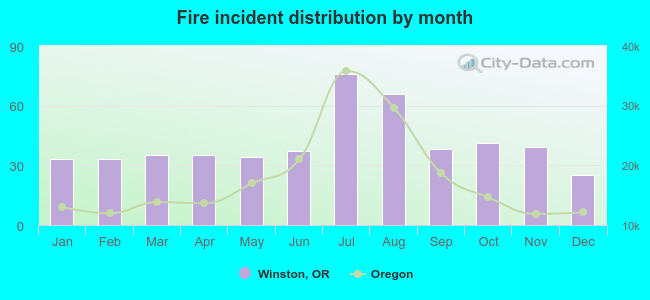 Based on the 492 reports from years 2002 - 2018 most fires (15.4%) took place during July, and the least (5.1%) in December.
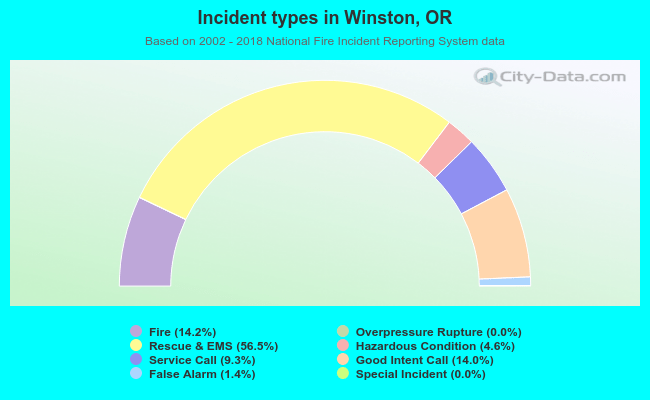 Out of all 3,467 cases reported during the years 2002 - 2018, the most belonged to the categories: Rescue & EMS (56.5%), Fire (14.2%), and Good Intent Call (14.0%).
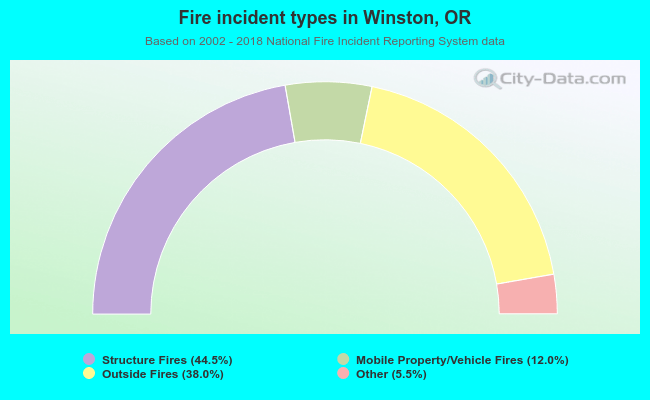 When looking into fire subcategories, the most incidents belonged to: Structure Fires (44.5%), and Outside Fires (38.0%).