Wixom: Fire Incidents, Michigan (MI)
Where are fire incidents reported in Wixom, MI
Something went wrong! Please refresh the page.
|
| |||||||||||||||||||||||||||||||||||||||||||||||||||||||||||||||||||||||||||||||||||||||||||||||||||||||||||||
2002 - 2018 National Fire Incident Reporting System (NFIRS) incidents
- Incident types reported to NFIRS in Wixom, MI
- 3,64857.3%Rescue & EMS
- 81112.7%Good Intent Call
- 5879.2%Hazardous Condition
- 5318.3%Fire
- 4406.9%False Alarm
- 3395.3%Service Call
- 90.1%Special Incident
- Fire incident types reported to NFIRS in Wixom, MI
- 21139.7%Structure Fires
- 17533.0%Outside Fires
- 11722.0%Mobile Property/Vehicle Fires
- 285.3%Other
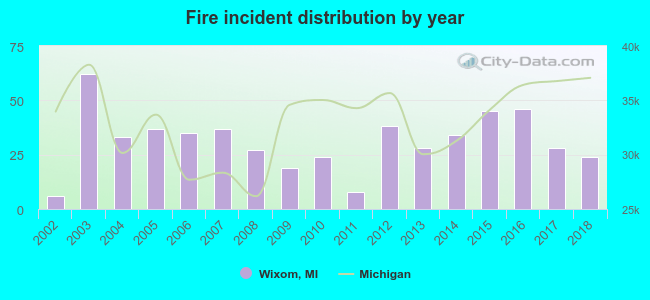 According to the data from the years 2002 - 2018 the average number of fires per year is 31. The highest number of reported fire incidents - 62 took place in 2003, and the least - 6 in 2002. The data has an increasing trend.
The average number of yearly fire incidents per 10k residents in Wixom, MI compared to nearest cities:
(Note: Based on data for the last 3 years, including only cities with population 5,000 and above)
| Wixom: | 23.8 |
| Walled Lake: | 32.3 |
| Novi: | 17.0 |
| Milford: | 53.1 |
| Northville: | 96.4 |
| South Lyon: | 54.9 |
| Farmington Hills: | 15.0 |
| Farmington: | 18.3 |
| Plymouth Township: | 2.4 |
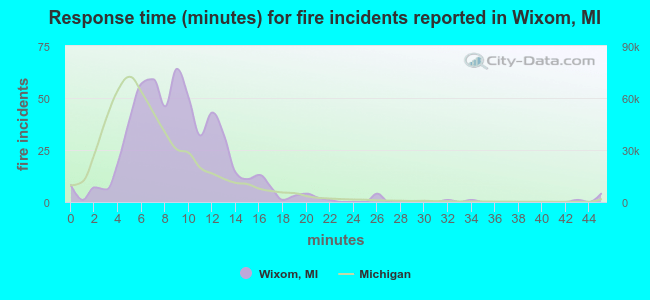 The median response time based on all reported fire incidents is 9 minutes. This is higher than the Michigan median value.
The median response time in Wixom, MI compared to nearest cities:
(Note: Based on data for all years, including only cities with at least 500 fire incidents)
| Wixom: | 9 minutes |
| Novi: | 6 minutes |
| Northville: | 7 minutes |
| South Lyon: | 7 minutes |
| Farmington Hills: | 8 minutes |
| Plymouth: | 6 minutes |
| Waterford: | 5 minutes |
| Brighton: | 8 minutes |
| Livonia: | 4 minutes |
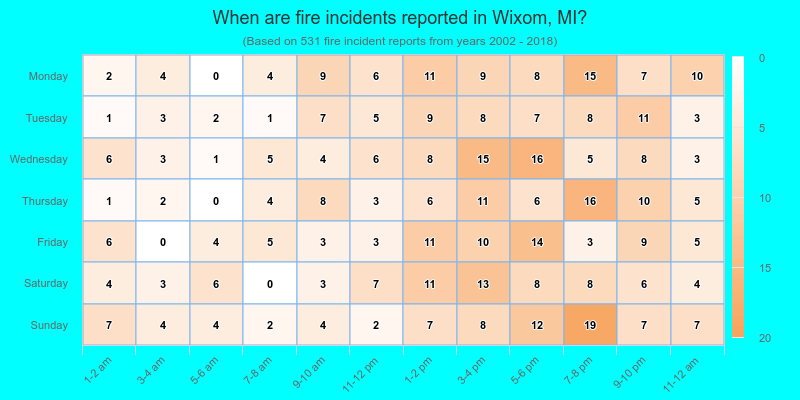
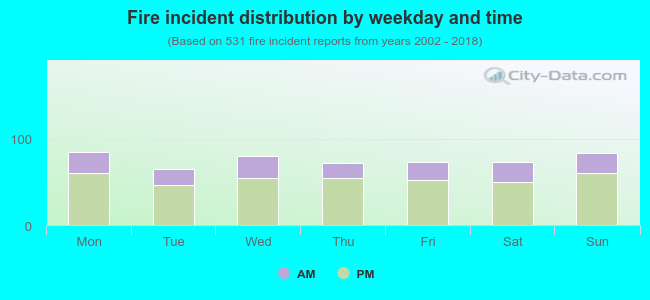 29.0% incidents where reported in the morning and 71.0% in the evening. The most fires (16.0%) took place on Monday, and the least (12.2%) on Tuesday.
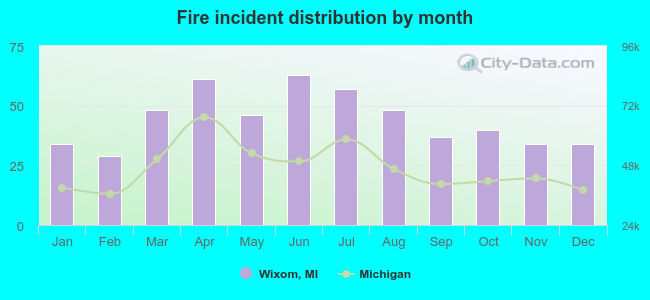 Based on the 531 fire incidents from years 2002 - 2018 most fires (11.9%) took place during June, and the least (5.5%) in February.
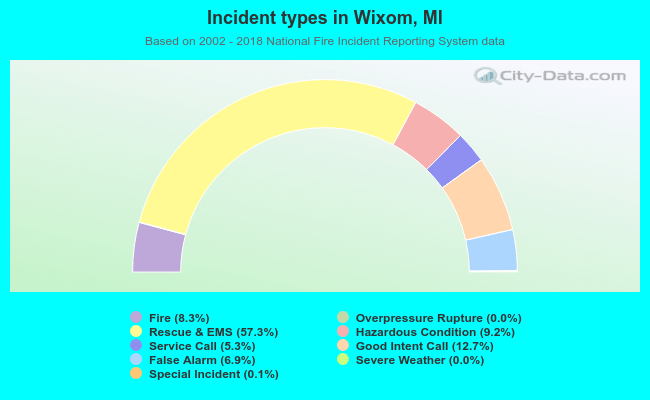 Out of all 6,369 cases reported during the years 2002 - 2018, the most belonged to the categories: Rescue & EMS (57.3%), Good Intent Call (12.7%), and Hazardous Condition (9.2%).
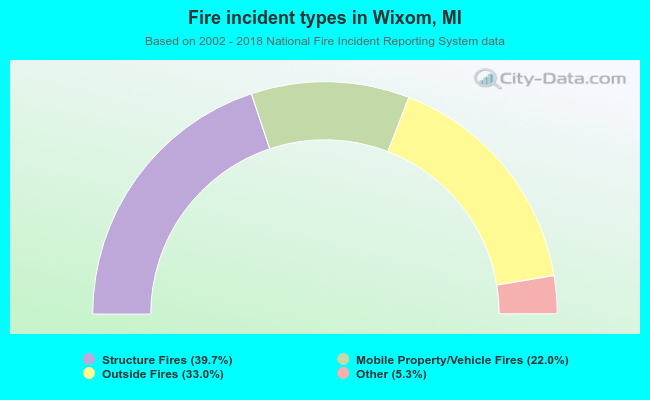 When looking into fire subcategories, the most reports belonged to: Structure Fires (39.7%), and Outside Fires (33.0%).