Wolcottville: Fire Incidents, Indiana (IN)
Where are fire incidents reported in Wolcottville, IN
Something went wrong! Please refresh the page.
|
| |||||||||||||||||||||||||||||||||||||||||||||||||||||||||||||||||||||||||||||||||||||||||||||||||||||||||||||
| Other | 148 | |||||||||||||||||||||||||||||||||||||||||||||||||||||||||||||||||||||||||||||||||||||||||||||||||||||||||||||
2003 - 2017 National Fire Incident Reporting System (NFIRS) incidents
- Incident types reported to NFIRS in Wolcottville, IN
- 38859.6%Fire
- 12819.7%Rescue & EMS
- 9614.7%Hazardous Condition
- 182.8%Good Intent Call
- 91.4%Service Call
- 60.9%Severe Weather
- 40.6%False Alarm
- 20.3%Overpressure Rupture
- Fire incident types reported to NFIRS in Wolcottville, IN
- 16943.6%Structure Fires
- 16041.2%Outside Fires
- 389.8%Mobile Property/Vehicle Fires
- 215.4%Other
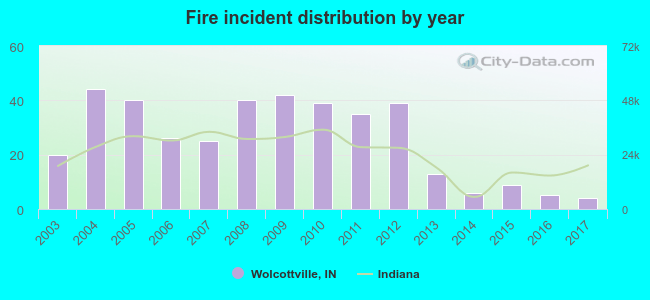 According to the data from the years 2003 - 2017 the average number of fires per year is 26. The highest number of reported fires - 44 took place in 2004, and the least - 4 in 2017. The data has a dropping trend.
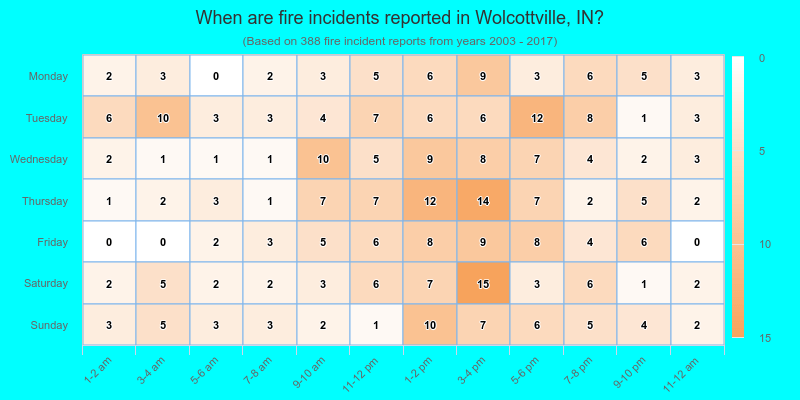
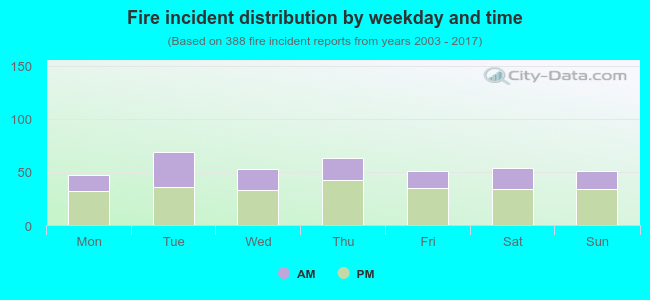 36.6% incidents where reported in the morning and 63.4% in the evening. The most fires (17.8%) took place on Tuesday, and the least (12.1%) on Monday.
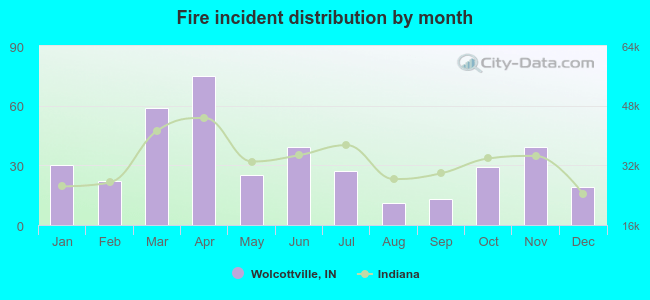 According to the 388 fire incident reports from years 2003 - 2017 most fires (19.3%) took place during April, and the least (2.8%) in August.
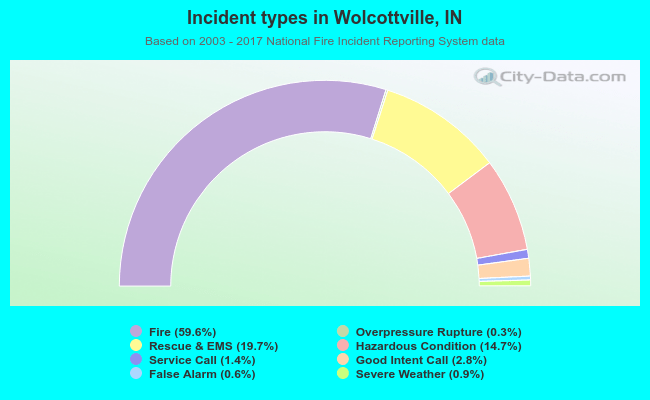 Out of all 651 cases reported during the years 2003 - 2017, the most belonged to the categories: Fire (59.6%), Rescue & EMS (19.7%), and Hazardous Condition (14.7%).
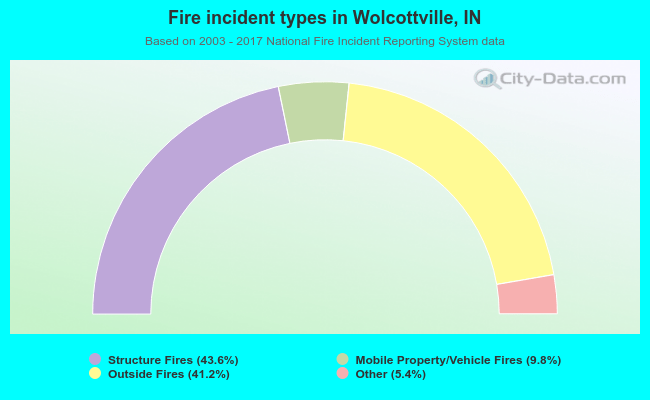 When looking into fire subcategories, the most reports belonged to: Structure Fires (43.6%), and Outside Fires (41.2%).