Wolfforth: Fire Incidents, Texas (TX)
Where are fire incidents reported in Wolfforth, TX
Something went wrong! Please refresh the page.
|
| |||||||||||||||||||||||||||||||||||||||||||||||||||||||||||||||||||||||||||||||||||||||||||||||||||||||||||||
2006 - 2018 National Fire Incident Reporting System (NFIRS) incidents
- Incident types reported to NFIRS in Wolfforth, TX
- 45142.1%Fire
- 19217.9%Rescue & EMS
- 15114.1%Good Intent Call
- 12611.8%Hazardous Condition
- 736.8%False Alarm
- 625.8%Service Call
- 131.2%Special Incident
- 40.4%Overpressure Rupture
- Fire incident types reported to NFIRS in Wolfforth, TX
- 28563.2%Outside Fires
- 11625.7%Structure Fires
- 398.6%Mobile Property/Vehicle Fires
- 112.4%Other
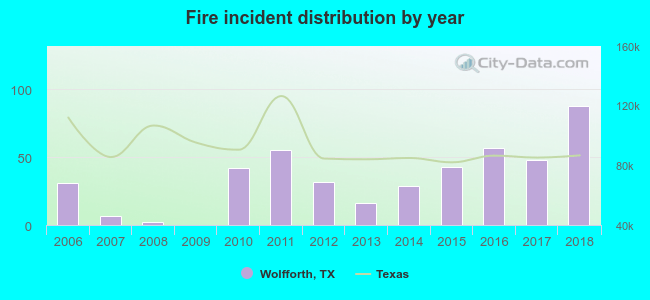 According to the data from the years 2006 - 2018 the average number of fires per year is 35. The highest number of reported fires - 88 took place in 2018, and the least - 0 in 2009. The data has a rising trend.
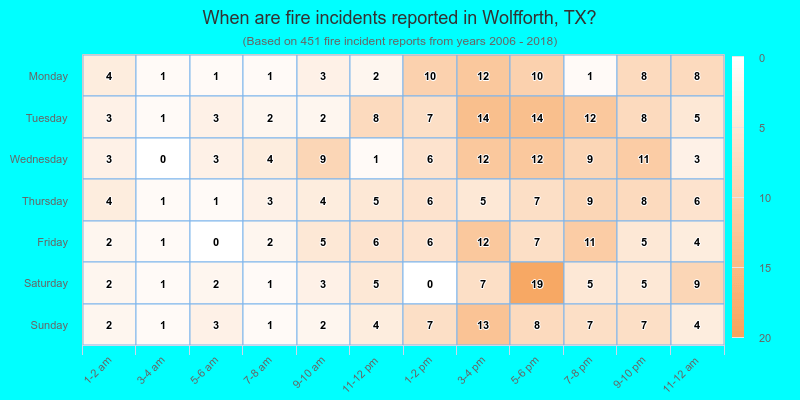
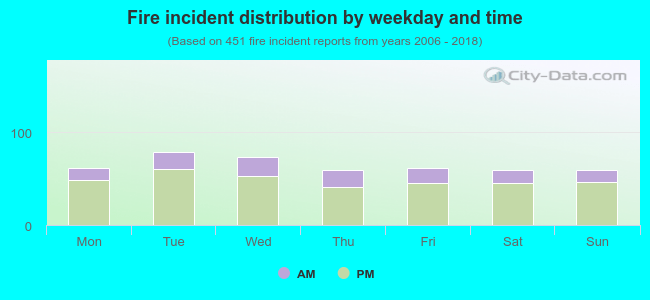 24.8% incidents where reported in the morning and 75.2% in the evening. The most fires (17.5%) took place on Tuesday, and the least (13.1%) on Thursday.
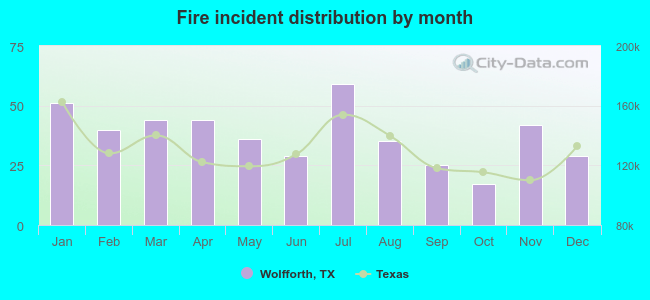 According to the 451 incident reports from years 2006 - 2018 most fires (13.1%) took place during July, and the least (3.8%) in October.
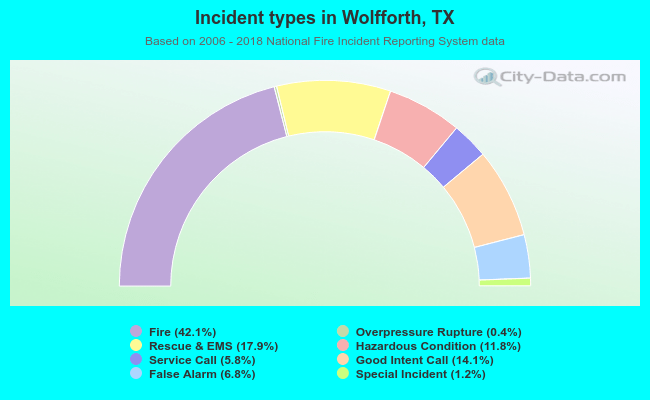 Out of all 1,072 cases reported during the years 2006 - 2018, the most belonged to the categories: Fire (42.1%), Rescue & EMS (17.9%), and Good Intent Call (14.1%).
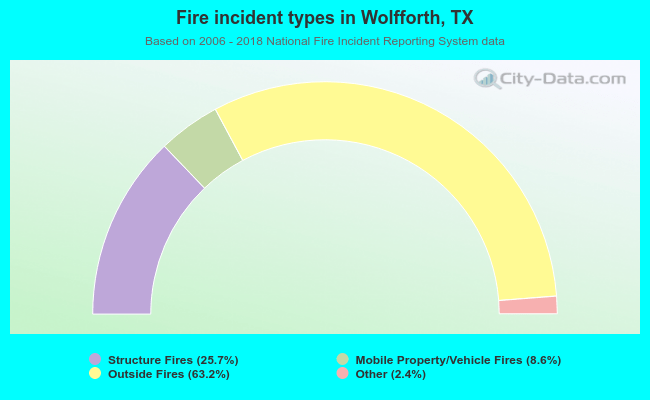 When looking into fire subcategories, the most reports belonged to: Outside Fires (63.2%), and Structure Fires (25.7%).