Yoder: Fire Incidents, Wyoming (WY)
Where are fire incidents reported in Yoder, WY
Something went wrong! Please refresh the page.
|
| |||||||||||||||||||||||||||||||||||||||||||||||||||||||||||||||||||||||||
| Other | 58 | |||||||||||||||||||||||||||||||||||||||||||||||||||||||||||||||||||||||||
2002 - 2018 National Fire Incident Reporting System (NFIRS) incidents
- Incident types reported to NFIRS in Yoder, WY
- 12644.2%Fire
- 6322.1%Rescue & EMS
- 5318.6%Good Intent Call
- 176.0%Service Call
- 124.2%Severe Weather
- 103.5%False Alarm
- 41.4%Hazardous Condition
- Fire incident types reported to NFIRS in Yoder, WY
- 9877.8%Outside Fires
- 1713.5%Structure Fires
- 97.1%Mobile Property/Vehicle Fires
- 21.6%Other
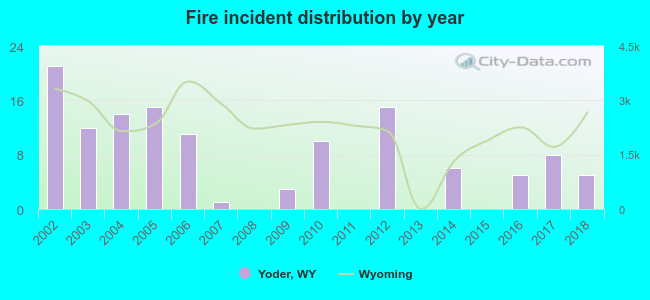 According to the data from the years 2002 - 2018 the average number of fires per year is 7. The highest number of reported fires - 21 took place in 2002, and the least - 0 in 2008. The data has a decreasing trend.
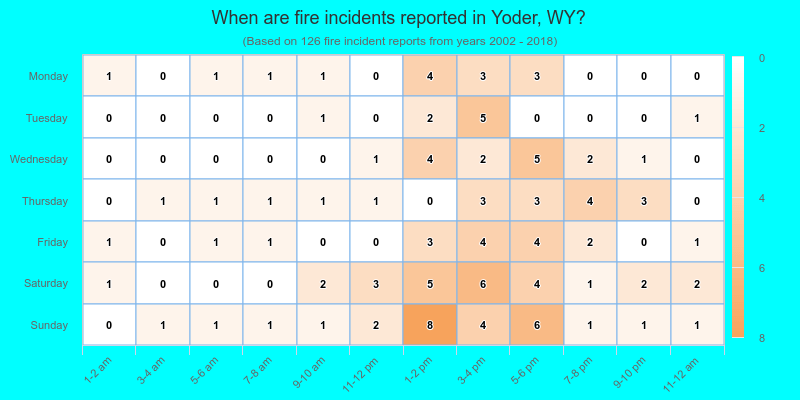
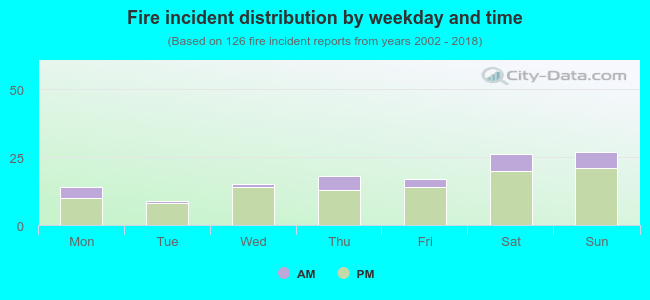 20.6% incidents where reported in the morning and 79.4% in the evening. The most fires (21.4%) took place on Sunday, and the least (7.1%) on Tuesday.
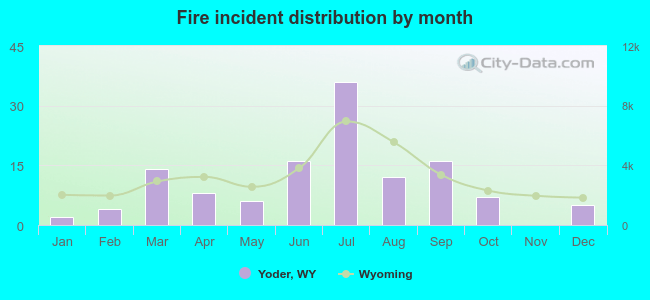 According to the 126 fire incidents from years 2002 - 2018 most fires (28.6%) took place during July, and the least (0.0%) in November.
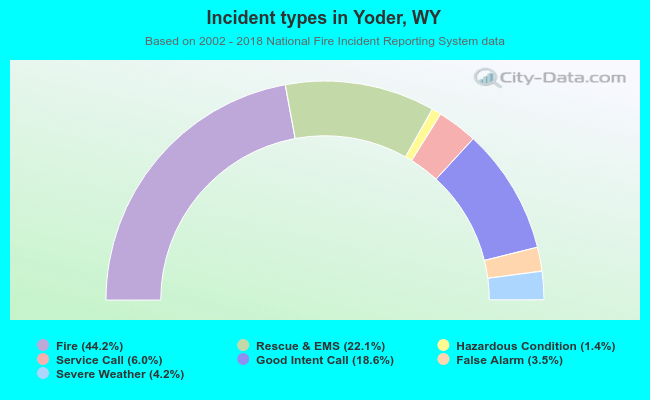 Out of all 285 cases reported during the years 2002 - 2018, the most belonged to the categories: Fire (44.2%), Overpressure Rupture (22.1%), and Service Call (18.6%).
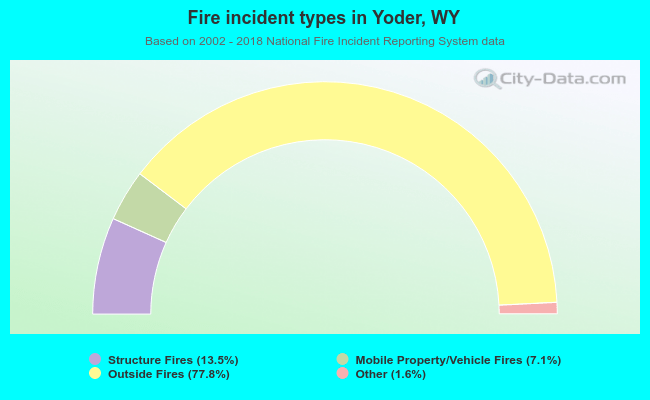 When looking into fire subcategories, the most incidents belonged to: Outside Fires (77.8%), and Structure Fires (13.5%).