Youngsville: Fire Incidents, Louisiana (LA)
Where are fire incidents reported in Youngsville, LA
Something went wrong! Please refresh the page.
| Fire incidents reported | |
|---|---|
| Sreet name | Count |
| FORTUNE RD | 80 |
| VEROT SCHOOL RD | 80 |
| GUILLOT RD | 70 |
| DETENTE RD | 68 |
| SAVOY RD | 68 |
| AUSTIN RD | 64 |
| LARRIVIERE RD | 64 |
| GALLET RD | 62 |
| MILTON AVE | 58 |
| VERMILLION CIR | 52 |
| IBERIA ST | 48 |
| DECON RD | 46 |
| BONIN RD | 44 |
| YOUNG ST | 44 |
| LANGLINAIS RD | 40 |
| MARTEAU RD | 40 |
| CHEMIN METAIRIE RD | 38 |
| ATLAS RD | 34 |
| GIREER RD | 32 |
| CHEMIN AGREABLE RD | 30 |
| LINDEN LEWIS RD | 30 |
| ROUSSEAU RD | 30 |
| YOUNGSVILLE HWY | 30 |
| LAFAYETTE ST | 28 |
| DULA ST | 24 |
| SIMON RD | 24 |
| MAXIE DUHON RD | 22 |
| CHEMIN METAIRIE PKY | 20 |
| GUILLIOT RD | 20 |
| ALMONASTER RD | 18 |
| Other | 66 |
2002 - 2018 National Fire Incident Reporting System (NFIRS) incidents
- Incident types reported to NFIRS in Youngsville, LA
- 1,37427.8%Fire
- 1,35527.4%Rescue & EMS
- 80716.3%Good Intent Call
- 54311.0%Hazardous Condition
- 4158.4%False Alarm
- 2234.5%Severe Weather
- 2184.4%Service Call
- 70.1%Overpressure Rupture
- Fire incident types reported to NFIRS in Youngsville, LA
- 74053.9%Outside Fires
- 51837.7%Structure Fires
- 866.3%Mobile Property/Vehicle Fires
- 302.2%Other
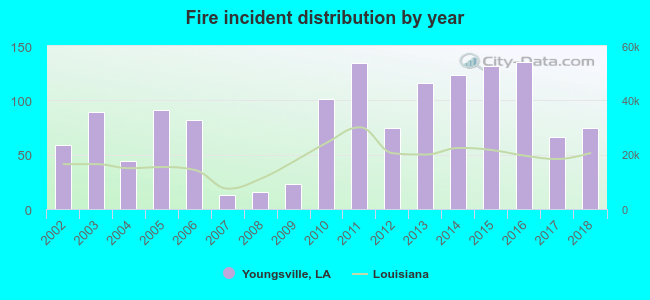 According to the data from the years 2002 - 2018 the average number of fire incidents per year is 81. The highest number of reported fire incidents - 135 took place in 2016, and the least - 13 in 2007. The data has a growing trend.
The average number of yearly fire incidents per 10k residents in Youngsville, LA compared to nearest cities:
(Note: Based on data for the last 3 years, including only cities with population 5,000 and above)
| Youngsville: | 83.6 |
| Broussard: | 79.8 |
| Lafayette: | 36.2 |
| Scott: | 94.7 |
| Abbeville: | 97.2 |
| New Iberia: | 71.1 |
| Breaux Bridge: | 124.5 |
| Carencro: | 113.6 |
| Rayne: | 54.3 |
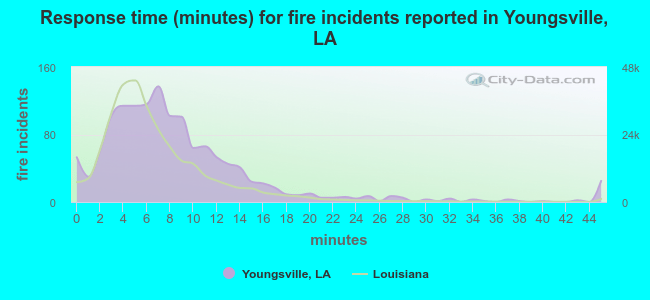 The median response time based on all reported fire incidents is 7 minutes. This is about the same as the Louisiana median value.
The median response time in Youngsville, LA compared to nearest cities:
(Note: Based on data for all years, including only cities with at least 500 fire incidents)
| Youngsville: | 7 minutes |
| Broussard: | 7 minutes |
| Lafayette: | 5 minutes |
| Erath: | 9 minutes |
| Scott: | 9 minutes |
| Abbeville: | 5 minutes |
| New Iberia: | 4 minutes |
| Breaux Bridge: | 11 minutes |
| Duson: | 8 minutes |
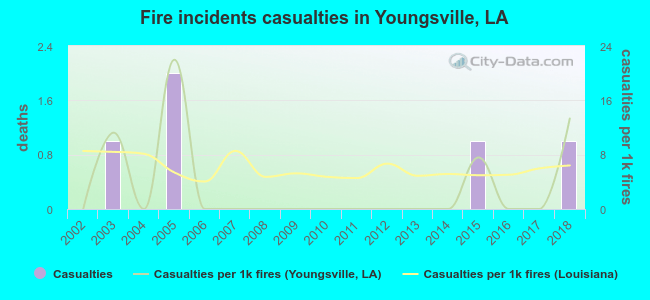 Based on the reports from the years 2002 - 2018 the average number of fire-related casualties per year is 0. The highest number of injuries - 2 took place in 2005, and the lowest - 0 in 2002. The data has an increasing trend.
The average number of injuries per 1,000 fires is 3. This indicator was the highest - 22 in 2005, and the lowest 0 in 2002. The trend for casualties per 1,000 fire incidents is rising. Compared to the Louisiana value the number of injuries per 1,000 incidents is lower.
Based on the reports from the years 2002 - 2018 the average number of fire-related casualties per year is 0. The highest number of injuries - 2 took place in 2005, and the lowest - 0 in 2002. The data has an increasing trend.
The average number of injuries per 1,000 fires is 3. This indicator was the highest - 22 in 2005, and the lowest 0 in 2002. The trend for casualties per 1,000 fire incidents is rising. Compared to the Louisiana value the number of injuries per 1,000 incidents is lower.Casualties per 1,000 incidents in Youngsville, LA compared to nearest cities:
(Note: Based on data for all years, including only cities with at least 500 fire incidents)
| Youngsville: | 3.6 |
| Broussard: | 5.3 |
| Lafayette: | 13.5 |
| Erath: | 0.0 |
| Scott: | 4.3 |
| Abbeville: | 6.8 |
| New Iberia: | 11.6 |
| Breaux Bridge: | 1.8 |
| Duson: | 0.0 |
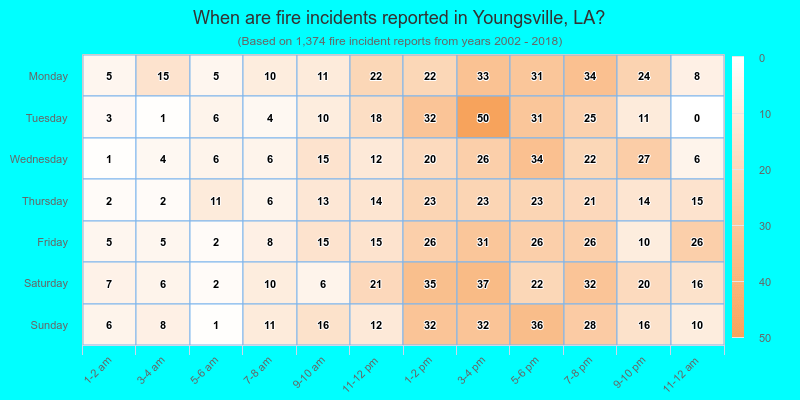
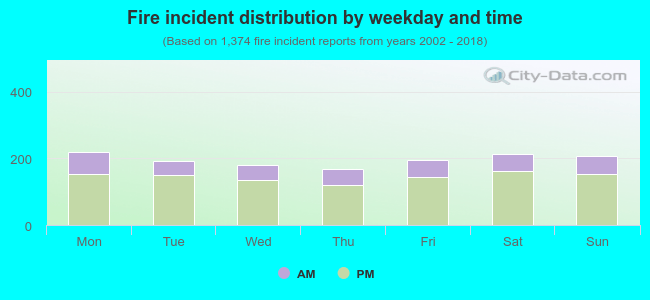 26.1% incidents where reported in the morning and 73.9% in the evening. The most fires (16.0%) took place on Monday, and the least (12.2%) on Thursday.
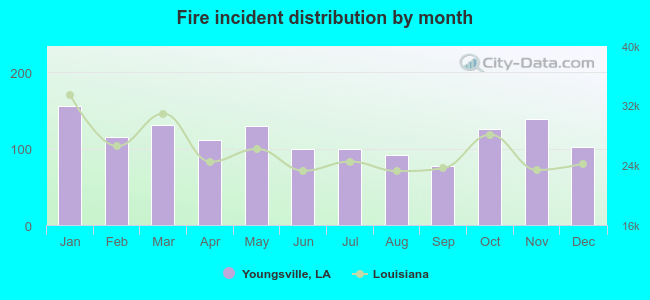 Based on the 1,374 fire incidents from years 2002 - 2018 most fires (11.4%) took place during January, and the least (5.6%) in September.
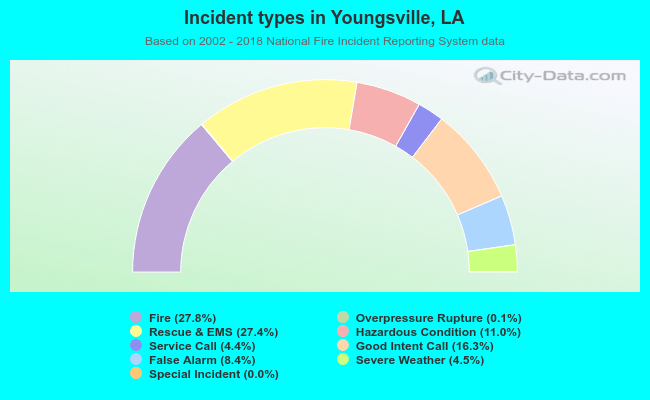 Out of all 4,943 cases reported during the years 2002 - 2018, the most belonged to the categories: Fire (27.8%), Rescue & EMS (27.4%), and Good Intent Call (16.3%).
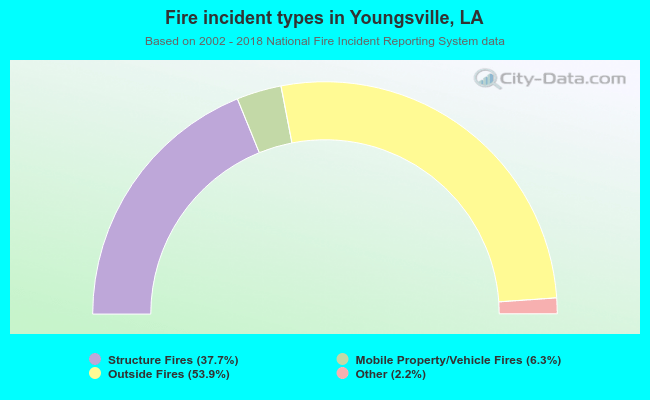 When looking into fire subcategories, the most reports belonged to: Outside Fires (53.9%), and Structure Fires (37.7%).