Yuba City: Fire Incidents, California (CA)
Where are fire incidents reported in Yuba City, CA
Something went wrong! Please refresh the page.
| Fire incidents reported | |
|---|---|
| Sreet name | Count |
| COLUSA AVE | 388 |
| GARDEN HWY | 218 |
| BRIDGE ST | 212 |
| LIVE OAK BLVD | 198 |
| GRAY AVE | 166 |
| BUTTE HOUSE RD | 162 |
| FRANKLIN RD | 138 |
| LINCOLN RD | 134 |
| B ST | 122 |
| CLARK AVE | 118 |
| SECOND ST | 102 |
| WALTON AVE | 96 |
| PEASE RD | 90 |
| QUEENS AVE | 90 |
| SHANGHAI BEND RD | 90 |
| PLUMAS ST | 86 |
| GEORGE WASHINGTON BLVD | 84 |
| BOGUE RD | 72 |
| FRANKLIN AVE | 64 |
| SR 99 | 60 |
| TOWNSHIP RD | 58 |
| RAILROAD AVE | 56 |
| OSWALD RD | 54 |
| ONSTOTT FRTG | 52 |
| HOOPER RD | 50 |
| NUESTRO RD | 50 |
| MARKET ST | 48 |
| STABLER LN | 48 |
| KENNY DR | 46 |
| LYNN WAY | 46 |
| Other | 951 |
2005 - 2018 National Fire Incident Reporting System (NFIRS) incidents
- Incident types reported to NFIRS in Yuba City, CA
- 23,52462.0%Rescue & EMS
- 4,24211.2%Good Intent Call
- 4,14910.9%Fire
- 3,1128.2%Service Call
- 1,9635.2%Hazardous Condition
- 9532.5%False Alarm
- Fire incident types reported to NFIRS in Yuba City, CA
- 1,89845.7%Outside Fires
- 1,41134.0%Structure Fires
- 58414.1%Mobile Property/Vehicle Fires
- 2566.2%Other
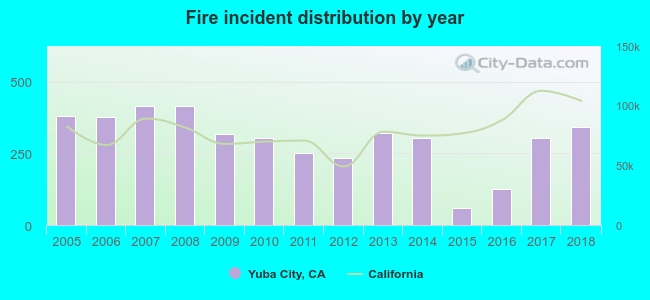 According to the data from the years 2005 - 2018 the average number of fire incidents per year is 296. The highest number of fire incidents - 416 took place in 2008, and the least - 61 in 2015. The data has a dropping trend.
The average number of yearly fire incidents per 10k residents in Yuba City, CA compared to nearest cities:
(Note: Based on data for the last 3 years, including only cities with population 5,000 and above)
| Yuba City: | 39.0 |
| Marysville: | 100.8 |
| Linda: | 2.8 |
| Olivehurst: | 8.5 |
| Plumas Lake: | 17.1 |
| Gridley: | 7.6 |
| Colusa: | 101.5 |
| Palermo: | 78.7 |
| Lincoln: | 17.6 |
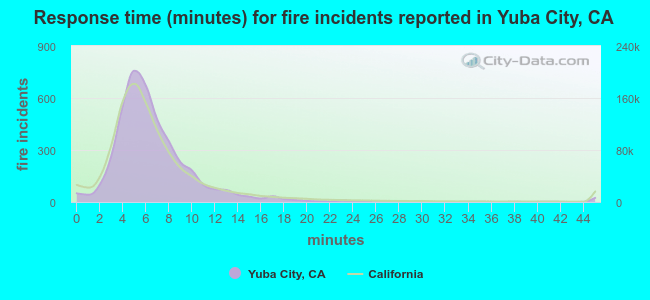 The median response time based on all reported fire incidents is 6 minutes. This is comparable to the state median value.
The median response time in Yuba City, CA compared to nearest cities:
(Note: Based on data for all years, including only cities with at least 500 fire incidents)
| Yuba City: | 6 minutes |
| Marysville: | 6 minutes |
| Olivehurst: | 5 minutes |
| Colusa: | 5 minutes |
| Palermo: | 7 minutes |
| Penn Valley: | 10 minutes |
| Arbuckle: | 10 minutes |
| Lincoln: | 9 minutes |
| Oroville: | 4 minutes |
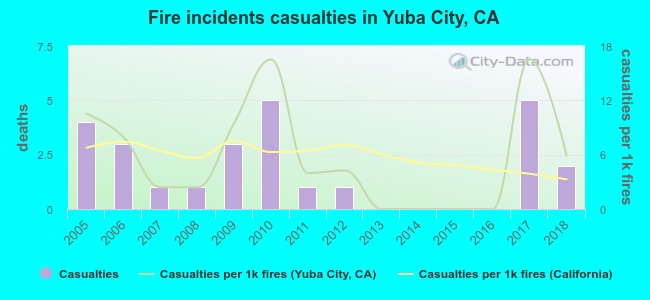 According to the reports from the years 2005 - 2018 the average number of fire-related yearly casualties is 2. The highest number of reported casualties - 5 took place in 2010, and the lowest - 0 in 2013. The data has a declining trend.
The average number of injuries per 1,000 fire incidents is 6. This indicator was the highest - 17 in 2017, and the lowest 0 in 2013. The trend for injuries per 1,000 incidents is declining. Compared to the California value the number of casualties per 1,000 incidents is similar.
According to the reports from the years 2005 - 2018 the average number of fire-related yearly casualties is 2. The highest number of reported casualties - 5 took place in 2010, and the lowest - 0 in 2013. The data has a declining trend.
The average number of injuries per 1,000 fire incidents is 6. This indicator was the highest - 17 in 2017, and the lowest 0 in 2013. The trend for injuries per 1,000 incidents is declining. Compared to the California value the number of casualties per 1,000 incidents is similar.Casualties per 1,000 incidents in Yuba City, CA compared to nearest cities:
(Note: Based on data for all years, including only cities with at least 500 fire incidents)
| Yuba City: | 6.3 |
| Marysville: | 1.5 |
| Olivehurst: | 1.8 |
| Colusa: | 0.0 |
| Palermo: | 0.0 |
| Penn Valley: | 6.6 |
| Arbuckle: | 0.0 |
| Lincoln: | 0.0 |
| Oroville: | 2.1 |
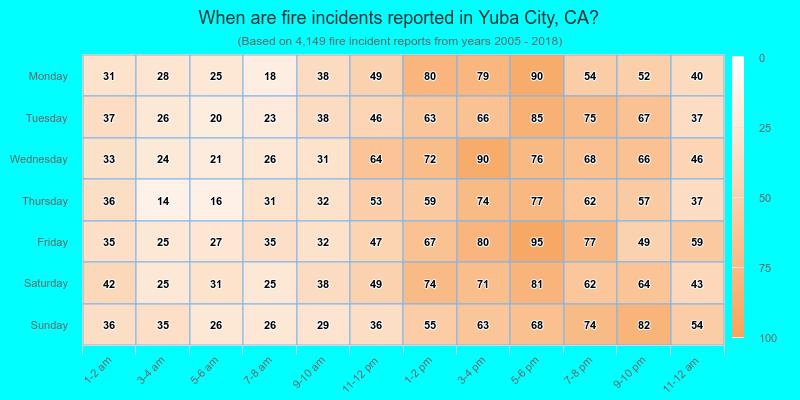
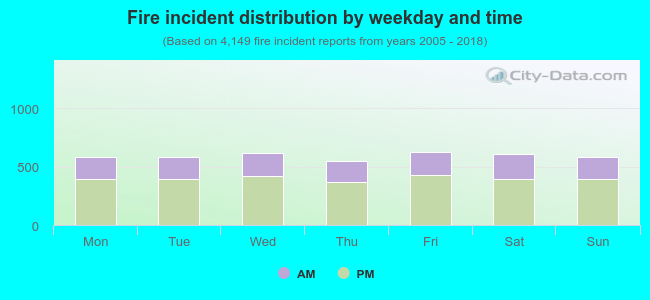 32.8% incidents where reported in the morning and 67.2% in the evening. The most fires (15.1%) took place on Friday, and the least (13.2%) on Thursday.
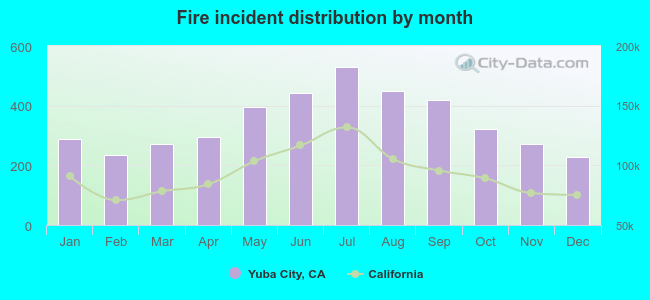 Based on the 4,149 fires from years 2005 - 2018 most fires (12.8%) took place during July, and the least (5.5%) in December.
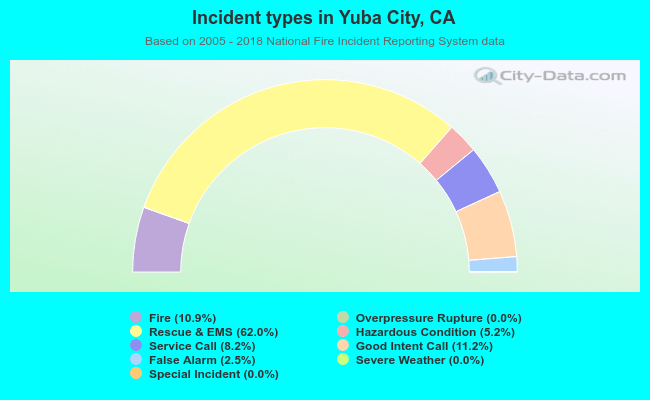 Out of all 37,966 cases reported during the years 2005 - 2018, the most belonged to the categories: Rescue & EMS (62.0%), Good Intent Call (11.2%), and Fire (10.9%).
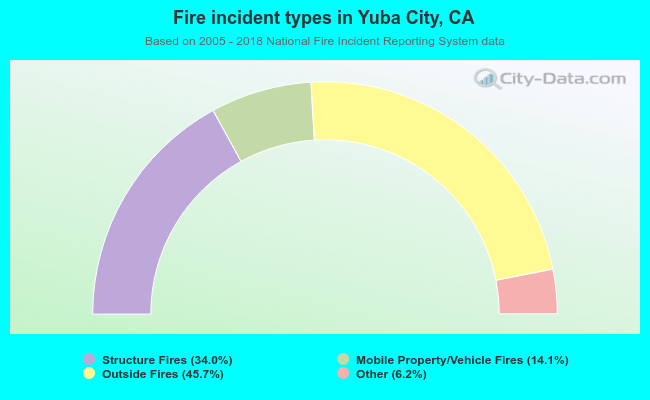 When looking into fire subcategories, the most incidents belonged to: Outside Fires (45.7%), and Structure Fires (34.0%).