Please register to participate in our discussions with 2 million other members - it's free and quick! Some forums can only be seen by registered members. After you create your account, you'll be able to customize options and access all our 15,000 new posts/day with fewer ads.
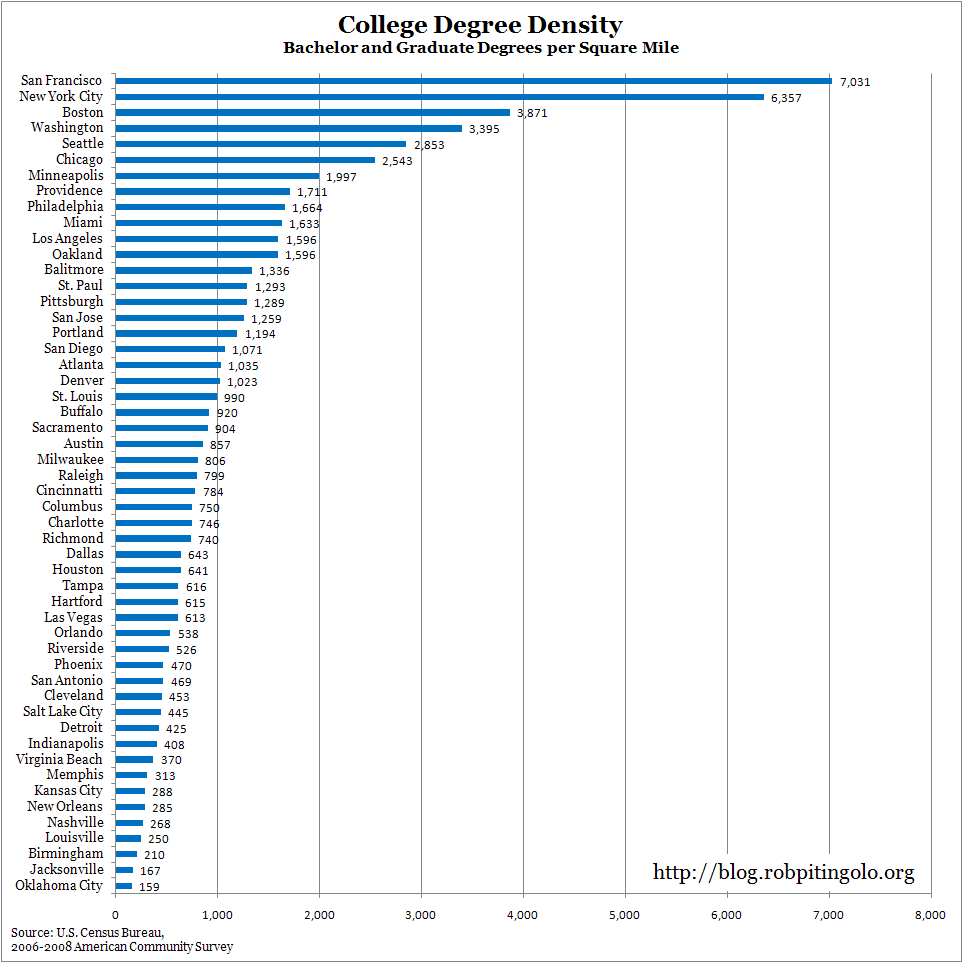
The runaway leaders, San Francisco and New York, have 7,031 and 6,357 degree holders per square mile, respectively. <snip> Surprisingly, Austin, Texas and Raleigh, N.C. — both of which are noted for their cluster of high-tech workers — were both below the 1,000 degree holders per square mile threshold.
Last edited by Bo; 06-08-2010 at 12:13 PM..
Reason: Added quote to help focus the thread on the article's list rather than let folks make their own list.
This seems likes a terrible and pointless way to measure how smart a city is. Cities like San Francisco and New York are obviously going to have more people with degrees per square mile, because both of those cities have much more people in general per square mile than cities like Austin and Raleigh.
This seems likes a terrible and pointless way to measure how smart a city is. Cities like San Francisco and New York are obviously going to have more people with degrees per square mile, because both of those cities have much more people in general per square mile than cities like Austin and Raleigh.
Percentage of population with a college degree per square mile.
Formula: (# of people with college degrees per sq mi/avg density per sq mi). So basically it means that within each square mile, X % of that population has a college degree.
San Francisco: 40.58%
New York City: 23.17%
Boston: 30.21%
Washington DC: 34.72%
Seattle: 39.98%
Chicago: 20.10%
Minneapolis: 29.71%
Philadelphia: 14.58%
Miami: 14.10%
Los Angeles: 19.45%
Baltimore (ironically a chart talking about college degrees spelled it Balitmore): 16.93%
Pittsburgh: 22.87%
San Jose: 21.86%
Atlanta: 25.76%
Houston: 16.55%
Dallas: 17.39%
Detroit *cringes*: 6.47%
So tops look to be: 1. San Francisco; 2. Seattle; 3. Washington DC; 4. Boston; 5. Minneapolis
Bottom of the barrel: 1. Detroit; 2. Miami; 3. Philadelphia; 4. Houston; 5. Dallas
I will admit I got lazy and decided not to do all of the cities, but I tried to do the big boys and the ones which scored highest.
Edit: *****...is this just the percentage of people with a degree in each city? Haha, if so I guess I just wasted some time.
Just noting I am taking it that this is only core city numbers being used, which might explain how Detroit is such an outlier. I would be interested to see if this was plotted over time since cities with larger jumps could be a means of determining gentrification.
Edit: *****...is this just the percentage of people with a degree in each city? Haha, if so I guess I just wasted some time.
Haha, yeah unfortunately that is all that figure would be. Also, from what I've seen on American Community Survey Data (http://factfinder.census.gov) the percentages for many of those cities are actually significantly higher. It must be that the "college degree density" figures are from the 2000 Census, which definitely makes them very dated.
Please register to post and access all features of our very popular forum. It is free and quick. Over $68,000 in prizes has already been given out to active posters on our forum. Additional giveaways are planned.
Detailed information about all U.S. cities, counties, and zip codes on our site: City-data.com.

 Please register to participate in our discussions with 2 million other members - it's free and quick! Some forums can only be seen by registered members. After you create your account, you'll be able to customize options and access all our 15,000 new posts/day with fewer ads.