If I knew post would end up this long I would have just posted the link instead....
 Official
 86pg post-storm analysis on Michael from NHC in PDF format:
https://www.nhc.noaa.gov/data/tcr/AL142018_Michael.pdf
Notes:
-If you weren't in the eyewall at/near landfall then you didn't go through a Cat4/5 hurricane.
-In the end the bump up by 6mph doesn't really change anything, but does help promote accurate data for future use.
-Post-storm analysis is performed on all storms during the 'off-season' after every year. You can see all previous storm reports here:
https://www.nhc.noaa.gov/data/tcr/ (As of this writing Florence is still being reviewed).
-Formed partially from absorbing the remnants of Kirk(dissipated well South of Puerto Rico a few days prior drifting west)
Quick:
-Landfall winds 161mph sustained (This would have been 1 small spot somewhere in the eyewall at landfall).
-Landfall pressure 919mb.
-59 deaths (16 direct, 43 indirect)
-Damage $25bln
Historical Stats:
-4th Cat5 to strike US (Andrew was last in 1992).
-Latest calendar date of a Cat5 to hit the US.
-Andrew was also a Cat4 later declared Cat5 several years later after review.
-3rd lowest pressure on record for landfalling storm (919mb).
-Tied for 4th strongest winds of storm to landfall US since 1900.
-2nd Cat5 to hit US Gulf coast (other 2 Cat5's hit southern FL).
-Hurricane climatology tells us this was normal path for an October storm (general S to N/NE path) & formed in area most likely to see development that time of year.
-History currently tells us this part of FL, *on average*, sees the eye/center of a Cat3+ within 58 miles of Michael's landfall every 31 years, last was Elena 1985 which stayed offshore hitting further west but eye/center did pass within 58 miles of there back then which was 33years ago. (58miles is the way stats are given so that's why I say that specific number, I don't know why).
-3 other Cat3+'s hit directly this same area (Panama City, FL - Mexico Beach, FL) before but way back in 1851, 1877, & 1894...obviously not a lot of data to go on back then though.
-If you include all storms to hit Panama City to Mexico Beach or the remnants to pass over then 15 storms have ever been known to hit there or pass VERY close by from Tropical Storm or higher strength since 1851.
NHC Products -VS- Reality:
-First noted as possible development 120hours(5 days) prior.
-Marked as High chance of formation 36hrs prior.
-The newer-ish 'PTC' (Potential Tropical Cyclone) product (allows issuing cone maps and storm watch/warnings prior to storm actually forming) issued 12hrs before it formed.
-First mention of Cat3 or higher at landfall possible was 57hours prior to landfall.
-Predicted track: Above average skill compared to 5yr average.
-Predicted intensity: Larger error then 5yr avg. (Intensity is still hardest thing to predict in hurricanes, and storm under went Rapid Intensification which is even harder to predict), but NHC intensity forecast better then almost all models.
--Advisories:
--Hurricane Warning issued 36hrs prior to arrival of TS winds (39-73mph) and Watch 48hours prior.
--Hurricane Warning for Cuba issued only 10hours prior to center passing (TS Warnings were in effect tho).
--Storm Surge Watch issued 48hrs prior to TS winds arrival.
--Storm Surge Warning 36hrs prior to TS winds.
--All storm surge of 3ft or higher occurred in the bounds of the Warned area except for a 3.6ft measurement in Clearwater Beach, FL.
--The day prior to storm surge advisories being issued, NHC was working with FEMA and emergency managers providing storm surge guidance.
NHC Reasoning for Cat4 135knots to Cat5 140knots:
-Saffir-Simpson scale a Cat4 is 130-156mph winds, Cat5 157mph+ sustained at at least one small point at ground level.
-Real time data at the time supported estimate of 135knts(155mph).
-Post-storm analysis of aircraft winds, surface winds, surface pressure, satellite, radar velocities and previously missing data used to support bump to Cat5 140knots(161mph):
-US Air Force Hurricane Hunter measured 175mph winds at 8,000ft which equates to 158mph surface winds (there's an equation for that calculation) in the SE eyewall. 17minutes prior measured 159mph surface winds S eyewall.
-Previously missing surface data drop from Hurricane Hunter reconstructed shows 175mph at surface around this time as well but there is ongoing research with other hurricanes on if these surface measurement drops have a high bias not accounted for yet or not.
-Elgin AFB Radar velocity analyzed shows winds 178mph at 8,000ft flight level where aircraft measured 175mph mentioned above. Radar analyzed shows higher winds were NE of where plane was which means aircraft didn't sample highest winds of storm. Radar also proves storm continued to intensify until it made landfall. Radar wind estimate was 144-149knots(166-171mph). Another analysis method yielded 135-140knot(155-161mph).
-Tallahassee radar velocity analysis was only partial due to tech issues but concluded similar.
-Pressure of 919mb can be used to extrapolate a wind speed: Dvorak method = 142knt(163mph). Atlantic Re-analysis Project method = 139knt(160mph). Knaff-Zehr-Courtnet method = 140knt(161mph).
-Satellite imagery estimates: Dvorak method = 140knt(161mph). CIMSS Advanced Dvorak = 140-145knt(161-167mph). Microwave imagery = 110-135knt(127-155mph). CIMSS SATCON = 140knt+(161mph+).
All methods above contain an inherit amount of possible error and NHC notes that the NHC best track intensities typically have an uncertainty of around ±10% so this rating may change again one day in future as science & techniques evolve, but data for now does support bump up to 140knots (161mph).
Side note: Mesovortices (there are little swirls within the eye/eyewall, but their not a tornado) is believed to have produced flight level winds of 180-200knots(207-230mph)...flight level is always stronger then actual ground level winds though.
Deaths: 59
Direct: 16:
-FL: 7, 5 in storm surge (age 60-91 and in evacuation zones), 2 by tree.
-GA: 1, by tree.
-NC: 3, by tree.
-VA: 5, inland flooding
Indirect Deaths: 43, all FL (indirect can be storm cleanup, carbon monoxide(generators), down power lines, medical issues, etc)
*Not included in totals above are 15 deaths from before it officially formed with flooding rains across portions of Central America: 8 Honduras, 4 Nicaragua, 3 El Salvador.
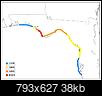
Tornadoes: 16
-FL: 2
-GA: 3
-SC: 4
-VA: 7
-All weaker EF0-EF1 rated.
(I selected random/notable values from their report for below numbers, there are many more to view in report.)
Wind obs:
*Note: Observation points on the ground at/near landfall were very limited and of those all were either not in the path of max winds, damaged, destroyed, contaminated values for various factors/reasons, or knocked offline prior to max winds arriving (common for instruments to not survive in powerful storms.*
-Now believed to have been a Cat2 when near Western tip of Cuba.
-Weakened to below Cat3(winds 111mph+) status before reaching GA.
-Hurricane force winds(74+mph) at/near center of storm from FL coast to into SW GA.
-Gust to Hurricane force(74+mph) as far as Albany, GA.
-Started Extra-tropical transition classification as moved into NC where winds began to steadily increase again.
-Reached hurricane force sustained winds by time reached Nova Scotia / Newfoundland.
-Cuba: 97mph sustained, 106mph gust Cabo de San Antonio
US:
***Values with "*" beside them are considered incomplete/missing data/likely went offline or damaged***
(Repeated cities had more then one data obs point)
-Panama City: *62mph sust, *91mph gust
-Panama City: *90mph sust, *120mph gust
-Panama City Beach: *61mph sust, *87mph gust
-Panama City Beach: 56mph sust, 75mph gust
-St. Andrews Bay: *75mph sust, *100mph gust
-Tyndall AFB: *86mph sust, *139mph gust
-Tyndall AFB: *106mph sust, *129mph gust
-Tyndall AFB: *69mph sust, *86mph gust
-Beacon Hill: 108mph sust, 127mph gust
-Port St. Joe: *113mph gust
-Port St. Joe: *76mph gust
-Apalachicola: *63mph sust, *77mph gust
-Apalachicola: 64mph sust, 84mph gust
-St George Island: 68mph sust, 82mph gust
-Mariana, FL: *102mph gust
-Tallahassee: *47mph sust, *71mph gust
-Shell Point: 55mph sust, 75mph gust
-Destin: 31mph sust, 47mph gust
-Tallahassee: *47mph sust, *71mph gust
-Tallahassee: *63mph gust
-Tallahassee: *56mph gust
-Donalsonville, GA: 64mph sust, 115mph gust
-Donalsonville, GA: *45mph sust, *67mph gust
-Albany, GA: *52mph sust, *74mph gust
-Tybee Island, GA: 58mph gust
-Hanchey, AL: 35mph sust, 62mph gust
-Hilton Head, SC: 43mph sust, 59mph gust
-N Myrtle Beach, SC: 41mph sust, 55mph gust
**Note the increase in wind speed as it transitioned to extra-tropical classification and restrengthened:
-Wrightsville Beach, NC: 51mph sust, 63mph gust
-Manteo, NC: 52mph sust, 64mph gust
-Chesapeake Light Tower, VA (offshore of Bay opening in Atlantic): 81mph sust, 96mph gust
-Coleman Bridge (Yorktown to Gloucester, VA): 77mph gust
-Chesapeake Bay Bridge Tunnel, VA: 63mph sust, 78mph gust
-Kiptopeke (near S tip of E Shore), VA: 67mph sust, 79mph gust
-Norfolk, VA: 35mph sust, 67mph gust
-Norfolk NAS, VA: 54mph sust, 75Mph gust
-Brandywine Shoal, DE: 64mph gust
-Crisfield, MD: 67mph gust
-High Point Monument, NJ: 58mph gust
Let's not forget all those data points that went down as storm moved inland:
https://twitter.com/alangeog/status/1050397573515763713
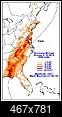
Storm Surge:
*Note: 'Surge' is the rise in water level above normal tide level. AGL = Above Ground Level (or 'Inundation') water level or the vertical height past normal high tide mark, or can say height of water on normally dry ground. Most data below listed as AGL.*
-Mexico Beach:
--USGS tide gauge from pier was recovered: Measured 14.7ft AGL & max water height of 20.6ft when wave action on top of surge included. So if sitting at waters edge at normal high tide you would be 14.7ft+ under water with waves on top of that level when eye came ashore.
+7.9ft AGL St. Marks National Wildlife Refuge
+7.4ft AGL Alligator Point
+7.3ft AGL Carrabelle & Apalachicola
+7.2-7.9ft AGL Port St. Joe
+6.0ft AGL Keaton Beach
+6.8ft AGL Panacea & Ochlockonee Bay
+4.1ft AGL Cedar Key
+6-9ft AGL near Tyndall AFB in St. Andrew Sound
+5.3ft Panama City
+3.9ft Panama City Beach
+4.3ft Panama City Beach
+2.4ft AGL Pensacola
--NC/VA:
+2-4ft NC Sounds and lower Chesapeake Bay (VA).
+4.2ft AGL Oregon Inlet, NC
+2.7ft AGL Lewisetta, VA
+2.7FT AGL Windmill Point
 Rain
Rain (max values):
Max overall: 13.01in Black Mountain, NC
-Cuba: 11.45in Pinar del Rio
-FL: 11.62in Lynn Haven (near Panama City)
-GA: 11.24in Fort Gaines
-SC: 8.23in (near Jefferson)
-NC: 13.01in Black Mountain (near Asheville)
-VA: 7.99in Victoria
-DE: 5.69in Dagsboro
-MD: 7.89in Fruitiland (near Salisbury)
-NJ: 6.52in Southampton Township
Atalaya, El Salvador: 22.79in (not included in storm totals as hadn't formed yet).
 Damage:
-Est. $25bln
*Note: 'destroyed' can mean different things to different people and to insurance, police, county officials, etc.*
-Mexico Beach, FL: Out of 1,692 buildings, 1,584 damaged of which 809 destroyed.
-Tyndall AFB, FL: All buildings damaged, many destroyed.
-Panama City, FL: 45,000 structures damaged, 1,500 destroyed.
-Elsewhere from East of Panama City, FL to Alligator Point, FL: 2,000 minor damage, 1,200 major damage, 985 destroyed.
-Franklin County, FL: 80 structures destroyed.
-Jackson County, FL (Marianna region): 600 buildings major damage, 400 destroyed.
-Seminole County, GA (Donalsonville region): 99% of homes damaged, severe timber/agricultural damage.
-Daugherty County, GA (Albany region): 3,000 homes damaged, 49 destroyed, severe timber/agricultural damage.
NHC website/social media stats(because...why not!?):
-NHC Twitter: 36mln views
-NHC Facebook: 1mln views, 6mln engagements
-NHC Website: 1.5Bln hits, majority of views were graphics pages of cone map, key messages and wind speed probability maps.

 Please register to participate in our discussions with 2 million other members - it's free and quick! Some forums can only be seen by registered members. After you create your account, you'll be able to customize options and access all our 15,000 new posts/day with fewer ads.


