What is MARYLAND known for? Characteristics of Marylanders? (Baltimore, Waldorf: beach, transportation)
Please register to participate in our discussions with 2 million other members - it's free and quick! Some forums can only be seen by registered members. After you create your account, you'll be able to customize options and access all our 15,000 new posts/day with fewer ads.
This one, however, is completely contrary to what has actually happened in Wake County, North Carolina, where I presently live. We have had something like 46% growth in the last ten years (!), a lot of which has been of the right-wing, tea party transplant nature. One result has been an overthrow of the fairly liberal county school board and the reinstatement of more traditional ideas regarding neighborhood schools and the like. In other words, the transition has been toward more conservative here as the result of "newcomers."
What are traditional ideas regarding schools? Just curious.
What are traditional ideas regarding schools? Just curious.
One aspect of traditional thinking is that kids should attend the schools nearest their homes, to the extent possible. This is in contrast to the more recent idea that kids should be bussed away from their home neighborhoods in order to achieve racial or economic balance in each school, to the extent possible.
It would seem that poverty dictates the top "receivers" of federal dollars more than presidential voting history does. The presence of recognized Native America groups would appear to be a big factor as well.
I think it is also important to note that many of the "receivers" vote GOP in Presidential elections, but are dominated locally by the Democratic party, and frequently elect Democratic representatives and senators to Congress. WV being the most obvious example, many of the Southern States fit this pattern as well. I think if you arranged the chart by local party voting patterns or representation in Congress, the chart would look much different. So, while that chart is interesting, I am not sure how much value it has other than than "Huh, that is weird" factor.
Quote:
Originally Posted by vwclassic
I really want to examine that data more. I suspect it is a little padded. It makes sense if you think about it though: "red" states don't like taxes and consequently have no money to give. I've lived in the South East and the area does have it's charm, without question. But without tax money they don't have the resources to facilitate upward mobility, ie. schools, or commerce driving forces, like public transit. The majority of law and med students from TN are educated out of state because there aren't enough schools instate, for example. But the number of law schools in TN is about to double with private schools, so we'll see, and a new DO school did just open.
There are 2 states that are exceptions to all that is good and reasonable. They are both republics in fact, TX and CA play by different rules then the rest of us. Neither can be considered blue or red because they both have traits of both. Convention tells us that CA is a dem state and TX is a repub state, but they are neither.
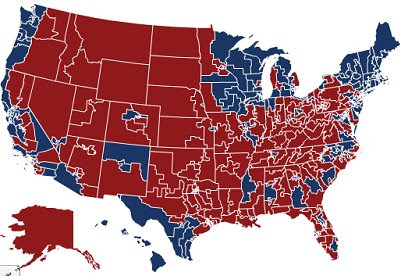
Please review the map above. These are the 2008 congressional election results. Remember, the enumeration of the electoral college are derived from these very same districts. The numbers of the previous graph I displayed are "padded"? Nothwithstanding the fact that this assertion is completely unsubstantiated, what does that even mean? "Padded" in what way?
What the above posters I think are neglecting to comprehend it that the graph I displayed is that these figures below are FEDERAL tax dollars.
Local politics or state taxes have nothing to do with federal spending. States don't collect their taxes and give them to the federal government. The IRS collects federal taxes. The fact that Florida does not collect state income tax is completely irrelevant. They collect taxes on hotels, car rentals, toll roads, consumer sales and every other good or service you could possibly associate with tourism or a service economy. A common mythos is that Marylanders pay so much more in taxes than Virginians. In metropolitan DC, while income taxes on the wealthy are higher in Maryland Counties, Virginia Counties pay higher property taxes.
Local Democratic or Republican politics is also meaningless outside of one of these local politicians serving as a delegate to the electoral college. Please review again the Congressional Election results above. In those states that voted McCain, you can see that the "blue" congressional districts have a tendency to be the gerrymandered "minority" districts (black in the South, Hispanic or Native American out west). These districts seem to make up a significant proportion of the state; they do in terms of land area but the populations are quite low density in the district. It's great to think the federal government spends a massive amount on Native Americans but their expenditures out west are accounted for by the massive land holdings they maintain. If the federal government had not allowed many of these lands to be seized from Native, Chinese, and African Americans in the 19th and early-20th century, perhaps their descendants would be paying taxes on the land to the states they are in rather than being subsidized by the entire country.
Of course the reverse is true for the states that voted Obama. For example, when looking at Colorado and Nevada you would think they are slam dunk "red states". However those tiny blue slivers in those formerly red states actually now account for over half of those respective states populations.
But in terms of federal expenditures, congressional districts are as local as it gets. The fact of the matter is, Republican dominated states get more federal dollars. West Virginia didn't even elect ONE Democratic representative in 2008. To say that "local" politics in red states is dominated by Democrats is counterintuitive, highly subjective, and bordering on the vein of irrelevancy. If anything, Westsideboy's "local" postulation would be more correct about Texas, that at one point had the most elected African American officials in the country. California is dominated by Democrats but if you look at the map, the congressional districts of the wealthiest suburbs of Los Angeles and the Bay Area are dominated by Republicans. Despite being smaller in number in California they are a very powerful and well-heeled political force that is instrumental in getting Republican governors elected (the two most notable being former Hollywood actors with tangential relations to Democrats, Reagan and Schwarzenegger).
All good points Steelers10 about the difference between local and federal elections and tax dollars. I do think that linking federal tax dollars in vs federal tax dollars out relates more to the poverty levels of the states rather than their voting patterns. A state that has a higher poverty level is going to receive more in federal tax dollars than a richer one.
Here are 2010 census stats, I have taken the liberty of highlighting the states red or blue based on 2008 Presidential returns, like your chart and put "in" or "out" to determine whether they are receivers (in) or givers (out).
The bottom 10 poorest states
Where median incomes are lowest
Rank State Median Income
1 Mississippi $35,693 - IN
2 Arkansas $37,987 -IN
3 West Virginia $39,170 - IN
4 Tennessee $40,034 - IN
5 South Carolina $41,548 - IN
6 Montana $41,587 - IN
7 Kentucky $41,828 - IN
8 Alabama $42,144 - IN
9 North Carolina $42,337 - IN
10 Louisiana $42,423 - IN
The top 10 wealthiest states
Where median income is highest
Rank State Median Income
1 New Hampshire $65,028 - OUT
2 New Jersey $64,918 - OUT
3 Connecticut $64,644 - OUT
4 Maryland $63,828 - IN
5 Alaska $62,675 - IN
6 Virginia $61,126 - IN
7 Utah $60,396 - IN
8 Massachusetts $59,732 -OUT
9 Hawaii $58,469 - IN
10 Washington $58,404 - OUT
The top 10 poorest states are all receivers of federal money and 9/10 voted for McCain. The top ten richest states are split 50/50 between the receivers and givers. The "receivers" in this group are the DC metro states (MD, VA) and states with high Native American populations (HI, UT, AK) which as you point out are pockets of high poverty, within otherwise wealthy states.
I think it is an interesting question to ask why the seemingly "conservative" states would vote against their own economic interests? I don't think the answer is ignorance or hypocracy on their part.
I still think the answer is the difference between local politics and national politics. I will use WV as my example, since I am most familiar with it. The Democrats in WV own the state on a local level, they are economically liberal (Pro-union, Pro-Medicare, Pro-Medicaid, etc.) but are socially conservative. The state has 2 Democrats in the US Senate (and had a Dem rep until he was unseated in his own primary by a candidate who worked very hard to connect him with the NATIONAL Democratic political platform) who are conservative on social issues, but more liberal on economic ones, like the majority of their constituants
The state has rejected the last 3 Presidential Democratic candidates, as do many states that have Democratic registration advantages. The party on a national level is far more liberal on social issues than voters in these states are comfortable with. In short, I don't think they mind the extra money idealogically, that is probably why they are still Democrats (everybody wants their own pork ), but the conservative Democrats don't want the social change that the national Democratic party platform promotes and thus vote GOP in Presidential elections and are "swing" when voting for House of Rep seats. At some point, it would be interesting to match the graph you provided and the income stats with the % of each party in the state legislatures. I would guess that many of the Southern States are like WV, conservative social/ecomonic liberal Democrats, but can't stomach the Democratic national party's social platform enough to vote along party lines consistently in national elections.
Quote:
Originally Posted by Steelers10
Please review the map above. These are the 2008 congressional election results. Remember, the enumeration of the electoral college are derived from these very same districts. The numbers of the previous graph I displayed are "padded"? Nothwithstanding the fact that this assertion is completely unsubstantiated, what does that even mean? "Padded" in what way?
What the above posters I think are neglecting to comprehend it that the graph I displayed is that these figures below are FEDERAL tax dollars.
Local politics or state taxes have nothing to do with federal spending. States don't collect their taxes and give them to the federal government. The IRS collects federal taxes. The fact that Florida does not collect state income tax is completely irrelevant. They collect taxes on hotels, car rentals, toll roads, consumer sales and every other good or service you could possibly associate with tourism or a service economy. A common mythos is that Marylanders pay so much more in taxes than Virginians. In metropolitan DC, while income taxes on the wealthy are higher in Maryland Counties, Virginia Counties pay higher property taxes.
Local Democratic or Republican politics is also meaningless outside of one of these local politicians serving as a delegate to the electoral college. Please review again the Congressional Election results above. In those states that voted McCain, you can see that the "blue" congressional districts have a tendency to be the gerrymandered "minority" districts (black in the South, Hispanic or Native American out west). These districts seem to make up a significant proportion of the state; they do in terms of land area but the populations are quite low density in the district. It's great to think the federal government spends a massive amount on Native Americans but their expenditures out west are accounted for by the massive land holdings they maintain. If the federal government had not allowed many of these lands to be seized from Native, Chinese, and African Americans in the 19th and early-20th century, perhaps their descendants would be paying taxes on the land to the states they are in rather than being subsidized by the entire country.
Of course the reverse is true for the states that voted Obama. For example, when looking at Colorado and Nevada you would think they are slam dunk "red states". However those tiny blue slivers in those formerly red states actually now account for over half of those respective states populations.
But in terms of federal expenditures, congressional districts are as local as it gets. The fact of the matter is, Republican dominated states get more federal dollars. West Virginia didn't even elect ONE Democratic representative in 2008. To say that "local" politics in red states is dominated by Democrats is counterintuitive, highly subjective, and bordering on the vein of irrelevancy. If anything, Westsideboy's "local" postulation would be more correct about Texas, that at one point had the most elected African American officials in the country. California is dominated by Democrats but if you look at the map, the congressional districts of the wealthiest suburbs of Los Angeles and the Bay Area are dominated by Republicans. Despite being smaller in number in California they are a very powerful and well-heeled political force that is instrumental in getting Republican governors elected (the two most notable being former Hollywood actors with tangential relations to Democrats, Reagan and Schwarzenegger).
Last edited by westsideboy; 05-30-2011 at 11:28 AM..
Whoa Steerlers10, easy there cowboy, please. I was not calling into question your points, ethics, or integrity when I used the word "padded". I'll explain my thinking as best as I can.
The data was pulled from several varying sources based on dates of different elections- one in which a dem won and one in which a repub won- two different overall results. Did the researchers do this to project the numbers they wanted? If so, how much of the data reflects what they wanted to show, rather than what is? If not, why whould they use presidential election data from two separate and/or contradictory elections where the issues and consequently the votes were based on different premises and had widely different results?
I did not fact check the data, or even spend too much time analyzing the results- this is just an informal forum and I love you man. Put another way: the results have merit when looking at trends, but when focusing on details seem fishy because of varied sources. Once again, not saying your wrong or dishonest, just that it is always important to criticize and consider the source- always- and I love you man.
As to the tax issues: Okay, I wasn't too clear and made some assumptions that perhaps I should not have. Taxes on a local level are important because those are the taxes that provide commerce driving services. Like public transit, utilities, roads, subsidies for IT services, health care services (based of course on where you live), police, fire, snow removal and many other sustaining and promoting services. It is what these services sustain and promote (commerce) that can allow money to flow to and from any community. Detroit is perhaps the best current example. Businesses flee because the local gov can't provide basic sustaining gov services. The effect becomes domino and expands.
Location: Somewhere in the Eastern Seaboard.......
316 posts, read 559,695 times
Reputation: 192
Maryland is known for crabs and seafood, Chesapeake Bay, Eastern Shore, Mountains, Baltimore City, Annapolis (state capital), Six Flags America, Baltimore Orioles and Ravens, Maryland Terrapins, and more.
Points all well taken. You are correct, the national Democratic platform is cobbled together from a variety of divergent interests, most of which don't "play" within an insular West Virginia. I think this is why California Republicans like Nixon and Reagan played well nationally. They were moderates running on platforms of fiscal conservatism and conservative egalitarianism. I think Pete Wilson could have been the best of them all but '96 was just the wrong time, wrong circumstance, and I believe he was having health problems at the time.
For all the criticisms of West Virginia I still think their electorate is a little more dynamic than its neighbors to the south. Whether the "solid south" is Dixiecrat or Republican, I would also estimate the party breakdown in state legislatures are along racial lines. In 2004, I believe, all the Republicans in Georgia's congressional delegation were white and all of the Democrats were black. Maryland's electorate is now more representative of what you would find in Megalopolis but this same demographic profile has rapidly creeped into Virginia and North Carolina. James Carville called Pennsylvania Philadelphia and Pittsburgh with Alabama in between but I think it would be more accurate to substitute Alabama with West Virginia! So in that respect I think you are correct, Allegany and Garrett Counties have more in common with its neighbors to the immediate north and south than to its Maryland bedfellows to the east.
Quote:
Originally Posted by westsideboy
All good points Steelers10 about the difference between local and federal elections and tax dollars. I do think that linking federal tax dollars in vs federal tax dollars out relates more to the poverty levels of the states rather than their voting patterns. A state that has a higher poverty level is going to receive more in federal tax dollars than a richer one.
Here are 2010 census stats, I have taken the liberty of highlighting the states red or blue based on 2008 Presidential returns, like your chart and put "in" or "out" to determine whether they are receivers (in) or givers (out).
The bottom 10 poorest states
Where median incomes are lowest
Rank State Median Income
1 Mississippi $35,693 - IN
2 Arkansas $37,987 -IN
3 West Virginia $39,170 - IN
4 Tennessee $40,034 - IN
5 South Carolina $41,548 - IN
6 Montana $41,587 - IN
7 Kentucky $41,828 - IN
8 Alabama $42,144 - IN
9 North Carolina $42,337 - IN
10 Louisiana $42,423 - IN
The top 10 wealthiest states
Where median income is highest
Rank State Median Income
1 New Hampshire $65,028 - OUT
2 New Jersey $64,918 - OUT
3 Connecticut $64,644 - OUT
4 Maryland $63,828 - IN
5 Alaska $62,675 - IN
6 Virginia $61,126 - IN
7 Utah $60,396 - IN
8 Massachusetts $59,732 -OUT
9 Hawaii $58,469 - IN
10 Washington $58,404 - OUT
The top 10 poorest states are all receivers of federal money and 9/10 voted for McCain. The top ten richest states are split 50/50 between the receivers and givers. The "receivers" in this group are the DC metro states (MD, VA) and states with high Native American populations (HI, UT, AK) which as you point out are pockets of high poverty, within otherwise wealthy states.
I think it is an interesting question to ask why the seemingly "conservative" states would vote against their own economic interests? I don't think the answer is ignorance or hypocracy on their part.
I still think the answer is the difference between local politics and national politics. I will use WV as my example, since I am most familiar with it. The Democrats in WV own the state on a local level, they are economically liberal (Pro-union, Pro-Medicare, Pro-Medicaid, etc.) but are socially conservative. The state has 2 Democrats in the US Senate (and had a Dem rep until he was unseated in his own primary by a candidate who worked very hard to connect him with the NATIONAL Democratic political platform) who are conservative on social issues, but more liberal on economic ones, like the majority of their constituants
The state has rejected the last 3 Presidential Democratic candidates, as do many states that have Democratic registration advantages. The party on a national level is far more liberal on social issues than voters in these states are comfortable with. In short, I don't think they mind the extra money idealogically, that is probably why they are still Democrats (everybody wants their own pork ), but the conservative Democrats don't want the social change that the national Democratic party platform promotes and thus vote GOP in Presidential elections and are "swing" when voting for House of Rep seats. At some point, it would be interesting to match the graph you provided and the income stats with the % of each party in the state legislatures. I would guess that many of the Southern States are like WV, conservative social/ecomonic liberal Democrats, but can't stomach the Democratic national party's social platform enough to vote along party lines consistently in national elections.
No harm no foul. I just come from the school of thought where the best way to challenge the "motives" of one set of information is to provide another set of information to refute it. By labeling the graph "Red Socialism", certainly the authors have an agenda. The question then becomes is the data fabricated. It's not. But outside of that, I agree that some of the structural issues of specific cities (you mentioned Detroit) are more an outgrowth of local politics and big business than the federal government. The feds gave bailouts to GM and Chrysler but that didn't necessarily mean that the money would trickle down to benefit Detroit or Flint. In my estimation it did not.
Quote:
Originally Posted by vwclassic
Whoa Steerlers10, easy there cowboy, please. I was not calling into question your points, ethics, or integrity when I used the word "padded". I'll explain my thinking as best as I can.
The data was pulled from several varying sources based on dates of different elections- one in which a dem won and one in which a repub won- two different overall results. Did the researchers do this to project the numbers they wanted? If so, how much of the data reflects what they wanted to show, rather than what is? If not, why whould they use presidential election data from two separate and/or contradictory elections where the issues and consequently the votes were based on different premises and had widely different results?
I did not fact check the data, or even spend too much time analyzing the results- this is just an informal forum and I love you man. Put another way: the results have merit when looking at trends, but when focusing on details seem fishy because of varied sources. Once again, not saying your wrong or dishonest, just that it is always important to criticize and consider the source- always- and I love you man.
As to the tax issues: Okay, I wasn't too clear and made some assumptions that perhaps I should not have. Taxes on a local level are important because those are the taxes that provide commerce driving services. Like public transit, utilities, roads, subsidies for IT services, health care services (based of course on where you live), police, fire, snow removal and many other sustaining and promoting services. It is what these services sustain and promote (commerce) that can allow money to flow to and from any community. Detroit is perhaps the best current example. Businesses flee because the local gov can't provide basic sustaining gov services. The effect becomes domino and expands.
I got the title- "Red Socialism" and thought it was pretty clever, Stalin would be proud? A quick question: are you sure it was Carville that said middle PA is Alabama? It may have been. If so, it is a more recent quote than I thought. I can't remember when I first heard it, but it may have been as recent as the 2004 election.
If he really did coin the phrase, props to Carville. He kind of cracks me up. He has a weird sense of humor that I get.
Please register to post and access all features of our very popular forum. It is free and quick. Over $68,000 in prizes has already been given out to active posters on our forum. Additional giveaways are planned.
Detailed information about all U.S. cities, counties, and zip codes on our site: City-data.com.

 Please register to participate in our discussions with 2 million other members - it's free and quick! Some forums can only be seen by registered members. After you create your account, you'll be able to customize options and access all our 15,000 new posts/day with fewer ads.


 ), but the conservative Democrats don't want the social change that the national Democratic party platform promotes and thus vote GOP in Presidential elections and are "swing" when voting for House of Rep seats. At some point, it would be interesting to match the graph you provided and the income stats with the % of each party in the state legislatures. I would guess that many of the Southern States are like WV, conservative social/ecomonic liberal Democrats, but can't stomach the Democratic national party's social platform enough to vote along party lines consistently in national elections.


