Please register to participate in our discussions with 2 million other members - it's free and quick! Some forums can only be seen by registered members. After you create your account, you'll be able to customize options and access all our 15,000 new posts/day with fewer ads.
I think I understand why you are confused. Every real estate company in the entire valley uses ARMLS to sell homes. There is no competing database to enter properties in. I do not have a choice to post my listings to any other database. This is the only place to do it. Every sale that ends up in the county recorders office has passed through ARMLS at one point unless it was sold FSBO. And FSBO figures are low.
I am not confused, you are. First off, we are comparing the average value (worth) of Phoenix homes and how they affect people. The ARMLS is an inventory of homes listed and many properties are contained in the listing, but not all. And no "potential" real estate is accounted for; therefore, no reliable average can be derived from the ARLMS especially considering the averages use too few number of homes and the pricing is much too varied. This is where a median price would be much more accurate and helpful.
Quote:
There is no "bigger picture" for home sales in Phoenix than this source. There are not a bunch of disconnected chain database franchises out there that all get pulled together in the case shiller index.
The bigger picture, is what is the average house worth in Phoenix. This type of representation and analysis would further help you in your real estate business; especially if you learn to understand the differences and can explain them to clients without confusion which you are likely to NOT be doing with use ARMLS figures; a skewed view on any terms.
Quote:
ARMLS is where inventory is counted in the first place! Where else do you think they figure out how many homes are currently for sale? Do you think someone drives around counting for sale signs?
You are confusing what ARMLS has listed from what is actually on the market and what the market value of average Phoenix homes are. In any account (AGAIN) the ARMLS gives a skewed view of an "average" price of homes for sale because of the small number and very high end of property listed.
Quote:
The small sample in the screen shots was an attempt to isolate homes in CITY OF PHOENIX only to show you the stats for the specific CITY you live in. I did the same for Goodyear.
This has no baring on the conversation, especially since NO ONE has been including any other valley/metro/regional cities and averages.
Quote:
I will repost the entire set of cumulative data that I had already posted in #11. It will be even higher since when we include Scottsdale and PV home averages its hard for a bunch of homes that STARTED out at $250 in peak times to drag it down.
As shown in post #11
----------------------
ALL ARMLS DATA COMBINED
YR 2006 - 60,459 total homes sold = Avg price $361,703
YR 2007 - 43,914 total homes sold = Avg price $363,917
YR 2008 - 52,086 total homes sold = Avg price $254,478
YR 2009 - 79,229 total homes sold = Avg price $175,999
Again, these "averages" are not for the Year 2006. Now the average is $361,703!!! WOW, talk about skewed data; Phoenix would be in the realm of Seattle and Boston for average home prices, LOL!
I was posting HISTORY, As in sales that ALREADY occured. What does potential future listings have to do with the PAST data that has closed and recorded? Besides, who is qualified to report on "potential futures" besides fortune tellers? I will say it again...
EVERY SALE IS ACCOUNTED FOR IN ARMLS EXCEPT FOR FSBO. PERIOD. THIS IS FACT. STOP SAYING OTHERWISE. YOU ARE DEAD WRONG.
Averages can be skewed. So can medians. No matter which you use its indisputable that sales prices were averaging higher than 300K using the most reliable source possible for anyone to get their hands on. Did you see the volume of sales used to calculate those averages? Its hardly a sample.
Unless you are going to show me a data source that proves 60,000+ homes is merely a sample of the actual properties sold in that time, its time for you to stop passing on your hunches as fact.
I was posting HISTORY, As in sales that ALREADY occured. What does potential future listings have to do with the PAST data that has closed and recorded? Besides, who is qualified to report on "potential futures" besides fortune tellers? I will say it again...
EVERY SALE IS ACCOUNTED FOR IN ARMLS EXCEPT FOR FSBO. PERIOD. THIS IS FACT. STOP SAYING OTHERWISE. YOU ARE DEAD WRONG.
THIS IS NOT THE AVERAGE PHOENIX HOME PRICE! Really, you are doing a disservice here by posting such ridiculously high average values that never existed and are not representative of the Phoenix market at any time in history. So was the peak in your opinion $304,000 or now over $360,000 ? Those numbers are absurd.
Quote:
Averages can be skewed. So can medians. No matter which you use its indisputable that sales prices were averaging higher than 300K using the most reliable source possible for anyone to get their hands on. Did you see the volume of sales used to calculate those averages? Its hardly a sample.
It is most certainly a sample; there are hundreds of thousands of single family homes in Phoenix alone and less than 12,000 in the 2006 figure and less than 40,000 in the 2009 analysis. Also, remember that these numbers are skewed by the high price of the most expensive listing available for the ARMLS inventory.
Quote:
Unless you are going to show me a data source that proves 60,000+ homes is merely a sample of the actual properties sold in that time, its time for you to stop passing on your hunches as fact.
You are still confused. You are claiming that the $360,000+ average value was the price available for the average home for sale in 2006. This is simply not true because of the average price skewed by low listings/sales and the high price of the most expensive real estate listed. This skews the data and is unreliable. It is not a "hunch" but a simple fact and like I told you in a DM, this is simple ECON 101 for freshman in college. If I was a real estate agent (which I wouldn't make a good one), I would have discouraged people from buying in 2005-2007 because of the bubble, instead informing those tens of thousands who bought in that time frame to rent and wait for the market to "correct" itself.
I would use long term economic forecasts, the unstable price inflation of 2005 and historical real estate data to show a client why 2005, 2006 is/was not a buyers market one iota.
Last edited by fcorrales80; 12-27-2009 at 05:01 PM..
I was posting HISTORY, As in sales that ALREADY occured. What does potential future listings have to do with the PAST data that has closed and recorded? Besides, who is qualified to report on "potential futures" besides fortune tellers? I will say it again...
EVERY SALE IS ACCOUNTED FOR IN ARMLS EXCEPT FOR FSBO. PERIOD. THIS IS FACT. STOP SAYING OTHERWISE. YOU ARE DEAD WRONG.
Averages can be skewed. So can medians. No matter which you use its indisputable that sales prices were averaging higher than 300K using the most reliable source possible for anyone to get their hands on. Did you see the volume of sales used to calculate those averages? Its hardly a sample.
Unless you are going to show me a data source that proves 60,000+ homes is merely a sample of the actual properties sold in that time, its time for you to stop passing on your hunches as fact.
Don't stress about trying to prove yourself to know it alls, Phoenixxx. I know you are right and I think most of the others in the thread know so too. The valley had to have one of the steepest price corrections in the entire country in history! This was made possible by the outlandish but true and confirmed averages you posted.
If your average was only $227 in 2006 such a drastic correction would not have been necessary. Everyone knows the correction was much steeper and still ongoing. You guys did have Seattle prices in 2006 but did not have a Seattle economy. It explains why it was unsustainable and why you are expected to have a longer and harder time recovering than most everywhere else. This is not my opinion but something I see regularly in various reports you can google on the internet.
$227 was the price of a fixer upper starter home in 2006. I can tell you because its what my 1100 square foot sold for back then. I was only able to get this much because everything was much higher and there were no other choices for buyers. I watched the action after I sold and saw my little home had home sales identical to mine selling as high as $279,900. It became the entry level price for our neighborhood right before it tanked. And we weren't in Scottsdale or anywhere fancy.
I will also confirm ARMLS is the single best source for raw sales data. We use both county sales records and ARMLS and the difference in our findings is negligible. As the market worsened so did the ability for people to sell by owner so its even more accurate now. Our company prefers the sales data in ARMLS. When an agent is involved sales are more conforming to surrounding values.
For Sale by Owner properties can be wacky since it could have been sold for next to nothing between family members or it could have been sold for an outrageous price to an unwitting buyer. 2 realtors involved in one sale each fighting for their client produces what is deemed as fair market value.
No more comments to the one bad apple in the thread. Most everyone else is in agreement. As you do in research throw out the non-conforming figure that is likely to skew and work with the rest.
All I know is that at Realtor.com their are a lot of homes under $100,000 in the Surprise area. I saw homes for sale as low as $68,000 and up. I don't remember any of them selling for under $100,000 when they were built.
All I know is that at Realtor.com their are a lot of homes under $100,000 in the Surprise area. I saw homes for sale as low as $68,000 and up. I don't remember any of them selling for under $100,000 when they were built.
I sold a rental I had in Surprise around 2006. It was nicely done but barely over 1000 sqft. We got 215K for it with multiple offers. I haven't looked back at what its worth now but I would be surprised if it would sell for more than 80-90K.
I don't see how 227k is a realistic average when 215k was entry level pricing for Surprise back then. Just about everywhere else in the Valley was as much or more than entry level Surprise pricing. Even large old homes in Maryvale started fetching 200K+.
In any case its good to take this in a positive direction. Its great news for buyers and lets hope all this inventory gets scarfed up rapidly so we can get step out of the trough we are in.
Don't stress about trying to prove yourself to know it alls, Phoenixxx. I know you are right and I think most of the others in the thread know so too. The valley had to have one of the steepest price corrections in the entire country in history! This was made possible by the outlandish but true and confirmed averages you posted.
Nothing was confirmed but an alarming fact was revealed. There are people who confuse average prices with outlandish numbers and helps explain some of the "fury" of sales.
Quote:
If your average was only $227 in 2006 such a drastic correction would not have been necessary. Everyone knows the correction was much steeper and still ongoing. You guys did have Seattle prices in 2006 but did not have a Seattle economy. It explains why it was unsustainable and why you are expected to have a longer and harder time recovering than most everywhere else. This is not my opinion but something I see regularly in various reports you can google on the internet.
The average was $227,000 and the steep correction that occurred fell prices to an average of $104,000 by the summer of 2009! That is a steep drop in average prices. The Seattle averages were around $400,000 compared to Phoenix' $227,000 which should have raise red flags when Phoenixxx listed prices at first of $304,000 then $360,000+ as "peak average sale prices."
Quote:
$227 was the price of a fixer upper starter home in 2006. I can tell you because its what my 1100 square foot sold for back then. I was only able to get this much because everything was much higher and there were no other choices for buyers. I watched the action after I sold and saw my little home had home sales identical to mine selling as high as $279,900. It became the entry level price for our neighborhood right before it tanked. And we weren't in Scottsdale or anywhere fancy.
Actually, it was not a fixer-upper and shows how much your research firm does not understand the market; hoping it really isn't a "major research firm" as the analysis you offered it completely inaccurate! First off, the Phoenix average were from homes that sold in Laveen, Maryvale, Deer Valley, Downtown, Alhambra, South Central, etc! A fixer-upper for $227,000 would most likely have been one in a historic district like Melrose or Coronado which has kept much of its value still compared to other regions!
Also, the high end of the ARMLS listing, ONCE AGAIN, is skewed because of the added value of very high end homes and the highest of $9,000,000+! If you are familiar with economic models and how averages with many figures are achieved you'd understand why finding an average with ARMLS listing are incorrigibly wrong even if the poster had good intentions. $279,900, while still high, is much more likely given location (fancy or not) to a $227,000 average compared to a $360,000+ average price!
Quote:
I will also confirm ARMLS is the single best source for raw sales data. We use both county sales records and ARMLS and the difference in our findings is negligible. As the market worsened so did the ability for people to sell by owner so its even more accurate now. Our company prefers the sales data in ARMLS. When an agent is involved sales are more conforming to surrounding values.
It is not the best and is a fallacy and the numbers are hugely skewed. Again, there is no "raw data" but data skewed by small numbers of properties and high figures at the top of the market. A ridiculous (and alarming) assertion that the ARMLS is the best source.
Quote:
For Sale by Owner properties can be wacky since it could have been sold for next to nothing between family members or it could have been sold for an outrageous price to an unwitting buyer. 2 realtors involved in one sale each fighting for their client produces what is deemed as fair market value.
Now we'd be getting into a whole different conversation and an assumption of "unwitting buyer" and who paid "outrageous price(s)" and what 2 real estate agents bickered about! What major research firm dealing with markets, including real estate, do you work for by the way? I'd like to know so I can see the data they've released to the public.
Quote:
No more comments to the one bad apple in the thread. Most everyone else is in agreement. As you do in research throw out the non-conforming figure that is likely to skew and work with the rest.
I hardly call two posters a consensus!
Last edited by fcorrales80; 12-27-2009 at 06:04 PM..
I sold a rental I had in Surprise around 2006. It was nicely done but barely over 1000 sqft. We got 215K for it with multiple offers. I haven't looked back at what its worth now but I would be surprised if it would sell for more than 80-90K.
I don't see how 227k is a realistic average when 215k was entry level pricing for Surprise back then. Just about everywhere else in the Valley was as much or more than entry level Surprise pricing. Even large old homes in Maryvale started fetching 200K+.
In any case its good to take this in a positive direction. Its great news for buyers and lets hope all this inventory gets scarfed up rapidly so we can get step out of the trough we are in.
A house in Maryvale fetching 200k in 2006? Ok, let's talk about manipulation of data or creating numbers on the fly to skew facts and the conversation. This has moved into a serious discussion with facts and analysis and has moved into the realm of ridiculous! Even if we took your 215k Surprise house as a fact, that would relative to an average of $227,000 and not $360,000! How does that add up to some people especially considering Surprise's higher market value compared to Phoenix?
Simply it makes no economic sense especially if you consider the entire market. Surprise had a higher average and median home value compared to the city of Phoenix; now we'd be getting into a conversation of the Valley, which DID and DOES have a higher average home value compared to Phoenix but still lower than $360,000+ for 2006!
A house in Maryvale fetching 200k in 2006? Ok, let's talk about manipulation of data or creating numbers on the fly to skew facts and the conversation.
Yes... lets talk about that.
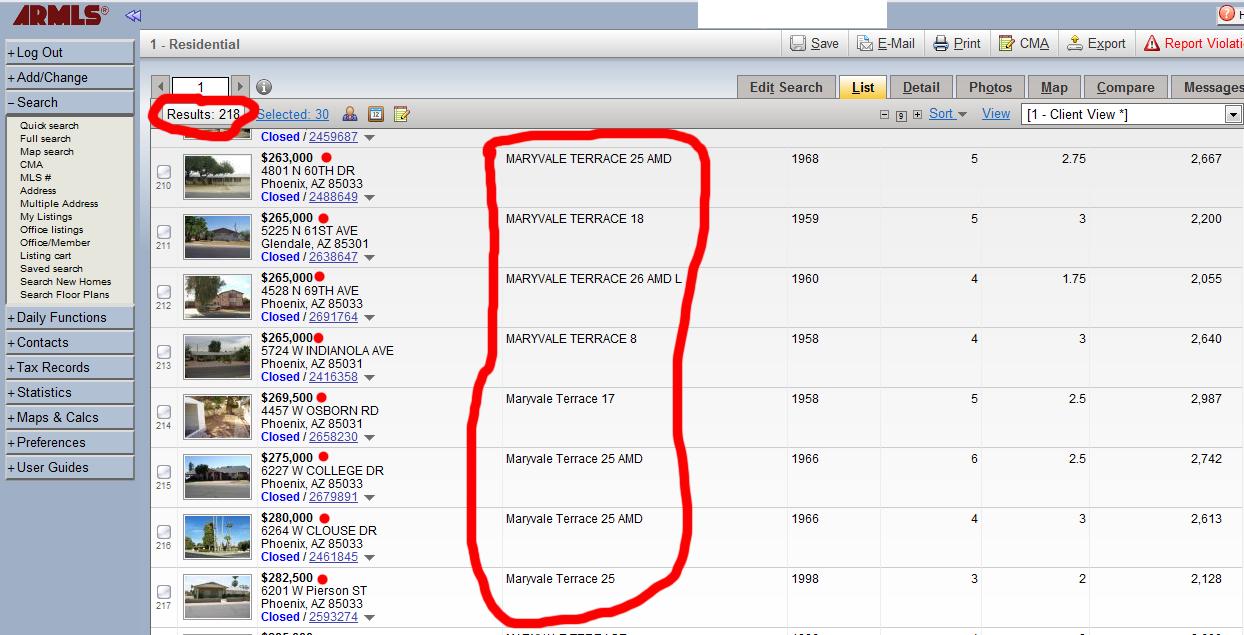
I did a search for Maryvale homes SOLD and here is a screen shot of what I found. There were too many results of homes sold over 200k in Maryvale during the peak, but here is a small clipping of the results.
There are 218 total homes as I circled in the photo that were OVER 220K. The total however for homes sold in Maryvale Terrace over 200K was around 800. Are you ready to start thinking before you speak?
As I said, large old homes were fetching over 200k in Maryvale. Thanks Phoenixxx. I don't understand what benefit you think I would get out of lying??
Please register to post and access all features of our very popular forum. It is free and quick. Over $68,000 in prizes has already been given out to active posters on our forum. Additional giveaways are planned.
Detailed information about all U.S. cities, counties, and zip codes on our site: City-data.com.

 Please register to participate in our discussions with 2 million other members - it's free and quick! Some forums can only be seen by registered members. After you create your account, you'll be able to customize options and access all our 15,000 new posts/day with fewer ads.


")