Quote:
Originally Posted by sanspeur

You know better than that...
|
I know you put up FALSE charts
btw your chart is mm (MILImeters) and shows a 2-4 mm difference.....2 mm is the thickness of a sheet of paper
In 1842 the "Isle of the Dead" in SE Tasmania was selected for the site of a "Mean Sea Level" (MSL) or "Zero Point of the Sea" (as Captain Sir James Clark Ross, the 19th century British Antarctic explorer, called it ........the refernce mark was carver in the land. Today this mark can clearly be seen 20 cm ABOVE the current mean sea level.
For a wonderful examination of Sea Level change from 1841 to 2004, this picture is worth a thousand words:
http://www.aph.gov.au/house/committee/jsct/kyoto/images/bbc-dead.jpg (broken link)
Here is another view — this time, the mark has been traced over with line to emphasize it.

The 1841 sea level benchmark (centre) on the ‘Isle of the Dead’, Tasmania. According to Antarctic explorer, Capt. Sir James Clark Ross, it marked mean sea level in 1841. Photo taken at low tide 20 Jan 2004. Mark is 50 cm across; tidal range is less than a metre.
Let’s read that again and consider four things:
#1) - the mark was placed at mean sea level. The word “mean” in this use denotes the “mathematical average”. The sea rose above it and set below it by an equal amount during the tidal cycle.
#2) - The mark was made in the middle of the tidal range in 1841 and it was photographed 163 years later at the bottom of the tidal cycle.
#3) - the tidal cycle is one meter and the mark is 50 centimeters or one-half meter long.
#4) - the mark is sitting about 30 or 40 centimeters above the water in the photograph. Given that there is some wave surge, it looks like the level of the ocean has not changed one bit in 163 years
in fact some studies even say the sea levels will FALL ...British meteorologist, Sir George Simpson in 1938 , and confirmed by several studies since, suggests that a warming ocean will result in more evaporation and thus more cloudiness. The `Simpson Effect' as it has been called, would increase precipitation over the polar regions in the form of snowfall, building up the ice mass, and thus become frozen water permanently lost from the oceans. Yet more moisture will precipitate over internal land catchments such as the Caspian Sea and Lake Victoria in east Africa, again removing water from the ocean mass. These latter processes are believed to be sufficient not only to offset the rise in sea level predicted from ocean warming, but could result in a fall in sea level of up to 7 mm/yr
here is The raw sea level record from Stockholm
The sea level is clearly falling
and this one shows sea level to be pretty stable from 1930s-present
even the temps in europe have shown a NATURAL sine wave
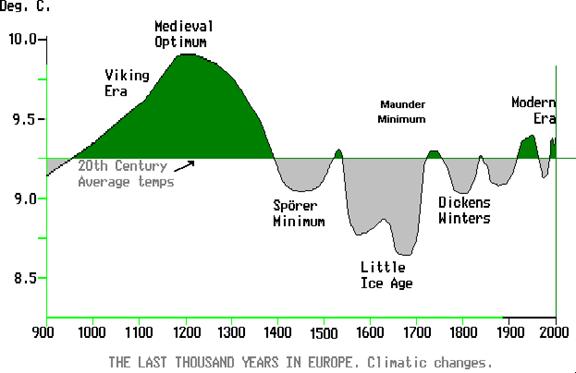
and the fact that we are coming out of a cold spell

 Please register to participate in our discussions with 2 million other members - it's free and quick! Some forums can only be seen by registered members. After you create your account, you'll be able to customize options and access all our 15,000 new posts/day with fewer ads.


