Please register to participate in our discussions with 2 million other members - it's free and quick! Some forums can only be seen by registered members. After you create your account, you'll be able to customize options and access all our 15,000 new posts/day with fewer ads.
Sorry, but you are entirely wrong about that and clearly know nothing about the physiology of polar bears. You've lived in Miami your entire life and have never seen a polar bear. Please don't make things up in your own mind and promote them to support your belief.
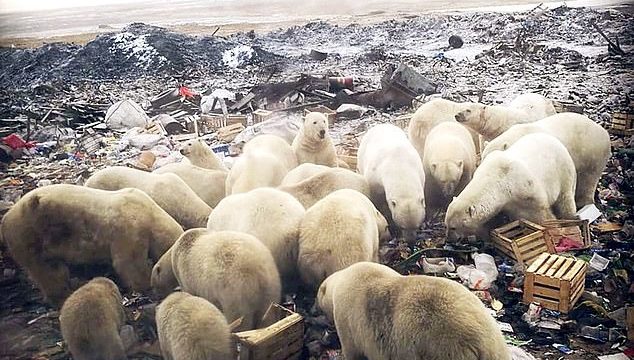
Every single one of those bears is underweight and starving. What you think is rotundness is simply their long, thick winter hair puffed out and plumped up from underneath by their water resistant wooly undercoat. It's what helps them to trap air and conserve body heat within the undercoat and it makes them look twice as big as they really are. The more ill a starving polar bear becomes, the more plumped up it's hair will become to conserve energy.
If you look at the downward curves in their spines between the shoulder blades and the rumps that is a sign of starvation. There should be no downward curve there. It means there are no fat stores on their backs where it should be. There should be no saggy 'wrinkles' seen in the fur on their necks or on their faces and their faces should be fuller and rounder. They all have sagging wrinkles and thin faces. Again, a sign that they have no stored fat and their skin is loose and sagging from starvation.
The bellies should be much rounder and closer to the ground, at the very least they should be just below level with the 'knees' and 'elbows', instead they are higher and level with the rib cage and 'thigh'. Last but not least, polar bears are basically solitary, territorial animals who do not socialize or gather together in groups unless they are starving. Those are all starving bears in very poor condition.
Hmmmm.................... Sea level has been rising since the 1400s- an "inconvenient truth".
One must ask as well- how is sea level measured? You can use water based buoys, or satellites. Satellite data started in the early 1990s, thus comparing buoy data to satellite measurements is not appropriate. Buoy data is effected by sediment accumulation from land, which alters measurements, as well as land subsidence, which is not the same at all points on earth.
At this point, we were supposed to have "hundreds of millions" of people displaced by rising sea levels. I don't see the price of beach front property going down, so obviously (like everything with the AGW predictions) did not happen.
If the AGW models were bookies in Vegas, they would have gone broke.
This diagram suggests otherwise. Yes, there were increases and decreases, but the 20th century seems a total outlier:
well it must be....your posts says some places out in the ocean are sinking 20 cm below the average.....and some places are rising 20 cm above the average
at some point the ocean is going to look like this......
well it must be....your posts says some places out in the ocean are sinking 20 cm below the average.....and some places are rising 20 cm above the average
at some point the ocean is going to look like this......
Believe it or not there actually are stationary bulges of water on the ocean surfaces that look like that dome, although they are not as high as the dome pictured, some of them are as high as 3 to 7 feet higher above the regular sea level around them.
They are called geoids or just simply, ocean bulges and they just sit there in place. There is a particularly big one in the Atlantic just east of where you live - you'll see it in the map below. There is a huge one in the Pacific just east of Japan and China - look for the big white spot in the ocean. The map of all the bulges is referred to as ocean surface topography. It's like the topography of continental surfaces which display mountains and depressions. But where continental topography is mostly stable the oceans surface topography (the hills and depressions on the water's surface) is more variable and fluid.
Also, just so you know, unbelievable as it may seem to some, the entire Pacific Ocean at the Pacific's lowest depressions, in general, is always around 8 inches higher than the Atlantic Ocean's highest upward bulges. The Pacific in general is always 20 inches higher than the Atlantic, regardless of any topographical geoids. Here is a dynamic topographical map of the oceans' water surfaces:
English: TOPEX/Poseidon was the first space mission that allowed scientists to map ocean topography with sufficient accuracy to study the large-scale current systems of the world's oceans.
The total relief of ocean topography shown in this image is about 2 meters. The color scale corresponds to the grades of the relief in centimeters. The vertical scale is greatly exaggerated to illustrate the three-dimensional perspective of the topography. In this image, the maximum sea level (shown in white) is located in the western Pacific Ocean and the minimum sea level (indicated by magenta and dark blue) is shown around Antarctica. In the northern hemisphere, ocean currents flow clockwise around the highs of ocean topography and counterclockwise around the lows; this process is reversed in the southern hemisphere. These highs and lows are the oceanic counterparts of atmospheric circulation systems. While the basic structure of these ocean systems is constant, the details of the systems are constantly changing.
Although this image was constructed from only 10 days of TOPEX/Poseidon data (October 3 to October 12, 1992), it reveals most of the current systems that have been identified by shipboard observations collected over the last 100 years.
Oh, btw, you need to get some reading glasses because your eyesight must be failing if you are seeing bear bellies dragging on the ground. And you should stop imbibing in that stuff you're always taking and check your sense of humor at the door. That substance you're taking is altering your state of awareness, your cognition and sense of truth and humor in a way that discredits you and makes it impossible to take you seriously.
It is just like the predictions of 18th century alarmist Thomas Malthus, who was a progenitor of ideological Democrat leftist alarmists of today. He predicted that human population growth would be controlled by famine and disease, as we would not be able to expand food production fast enough to support population growth.
Instead, the polar bear populations are booming and like us they appear to be more at risk of death from overeating.
It is tough out there. Which reminds me of a quote attributed to John Wayne, but was actually coined by someone else, probably George V. Higgins.
“Life’s hard; it’s harder if you’re stupid” — John Wayne
Consider yourselves warned, lefties.
Please register to post and access all features of our very popular forum. It is free and quick. Over $68,000 in prizes has already been given out to active posters on our forum. Additional giveaways are planned.
Detailed information about all U.S. cities, counties, and zip codes on our site: City-data.com.

 Please register to participate in our discussions with 2 million other members - it's free and quick! Some forums can only be seen by registered members. After you create your account, you'll be able to customize options and access all our 15,000 new posts/day with fewer ads.


")