09-27-2017, 11:42 PM
Location: Sandy Eggo - Kensington
5,291 posts, read
12,737,271 times
Reputation: 3194
09-27-2017, 11:55 PM
Location: Sandy Eggo - Kensington
5,291 posts, read
12,737,271 times
Reputation: 3194
More interesting facts. Thanks to the forumers who created the threads below:
This is from the 2016 1 Year American Community Survey. By city only measuring the percentage of people aged 25+ with a
Bachelor's degree or higher.
Overall
1. Seattle: 63.13%
2. San Francisco: 57.24%
3. Washington DC: 56.83%
4. Portland: 49.6%
5. Austin: 49.16%
6. Boston: 48.39%
7. Denver: 47.4%
8. San Diego: 44.18%
9. Charlotte: 44.07%
10. San Jose: 42.56%
11. Nashville: 39.15%
12. Chicago: 38.50%
13. NYC: 37.02%
14. Columbus, OH: 35.25%
15. Albuquerque: 35.03%
16. Los Angeles: 32.81%
17. Houston: 32.47%
18. Dallas: 31.64%
19. Baltimore: 30.81%
20. Indianapolis: 30.05%
21. Oklahoma City: 29.67%
22. Philadelphia: 28.61%
23: Jacksonville: 27.93%
24. Phoenix: 27.91%
25. Fort Worth: 27.61%
26: Tucson: 26.07%
27. San Antonio: 25.99%
28. Memphis: 25.63%
29. El Paso: 23.82%
30. Milwaukee: 23.34%
31. Las Vegas: 22.95%
32. Fresno: 21.57%
33. Detroit: 14.86%
2016 Cities By Educational Attainment Percentage (500K+ Population)
50 Largest US Cities by Number of Households Earning $200,000+, 2016
Pop Rank/ City/ Households Earning $200,000+, 2016
1 New York, NY 291,016
2 Los Angeles, CA 116,445
13 San Francisco, CA 83,551
3 Chicago, IL 75,353
4 Houston, TX 62,229
10 San Jose, CA 62,201
18 Seattle, WA 49,444
8 San Diego, CA 48,029
21 Washington, DC 42,579
9 Dallas, TX 35,279
11 Austin, TX 35,158
5 Phoenix, AZ 27,832
22 Boston, MA 26,985
19 Denver, CO 25,289
17 Charlotte, NC 24,615
26 Portland, OR 21,217
6 Philadelphia, PA 20,115
38 Atlanta, GA 19,456
7 San Antonio, TX 18,741
45 Oakland, CA 18,223
24 Nashville, TN 13,619
41 Raleigh, NC 13,615
16 Fort Worth, TX 13,497
30 Baltimore, MD 12,933
46 Minneapolis, MN 11,908
15 Indianapolis, IN 11,694
27 Oklahoma City, OK 11,688
12 Jacksonville, FL 11,365
39 Long Beach, CA 10,888
29 Louisville, KY 10,151
43 Virginia Beach, VA 9,944
32 Albuquerque, NM 9,658
28 Las Vegas, NV 9,445
44 Omaha, NE 9,189
35 Sacramento, CA 8,785
42 Miami, FL 8,747
14 Columbus, OH 8,522
49 New Orleans, LA 8,294
40 Colorado Springs, CO 8,244
37 Kansas City, MO 7,764
25 Memphis, TN 7,666
47 Tulsa, OK 7,256
34 Fresno, CA 7,197
36 Mesa, AZ 6,896
50 Wichita, KS 5,552
47 El Paso, TX 5,488
48 Arlington, TX 4,786
31 Milwaukee 3,398
33 Tucson, AZ 3,129
23 Detroit, MI 1,917
Percentage of Households
That Earn $200,000+, 2016
San Francisco, CA 23.2%
San Jose, CA 19.4%
Seattle, WA 15.4%
Washington, DC 15.1%
Oakland, CA 11.5%
Atlanta, GA 10.0%
Boston, MA 10.0%
San Diego, CA 9.6%
Austin, TX 9.4%
New York, NY 9.3%
Denver, CO 8.6%
Los Angeles, CA 8.4%
Portland, OR 8.0%
Charlotte, NC 7.7%
Raleigh, NC 7.5%
Chicago, IL 7.1%
Houston, TX 7.1%
Dallas, TX 6.8%
Long Beach, CA 6.7%
Minneapolis, MN 6.4%
Virginia Beach, VA 5.8%
Baltimore, MD 5.3%
New Orleans, LA 5.3%
Omaha, NE 5.2%
Miami, FL 5.0%
Nashville, TN 5.0%
Phoenix, AZ 5.0%
Oklahoma City, OK 4.8%
Sacramento, CA 4.7%
Fort Worth, TX 4.6%
Colorado Springs, CO 4.4%
Albuquerque, NM 4.3%
Tulsa, OK 4.3%
Fresno, AZ 4.2%
Las Vegas, NV 4.2%
Louisville, KY 4.0%
Kansas City, MO 3.8%
Mesa, AZ 3.8%
San Antonio, TX 3.7%
Wichita, KS 3.6%
Arlington, TX 3.4%
Indianapolis, IN 3.4%
Jacksonville, FL 3.4%
Philadelphia, PA 3.4%
Memphis, TN 2.9%
Columbus, OH 2.4%
El Paso, TX 2.4%
Milwaukee, WI 1.4%
Tucson, AZ 1.4%
Detroit, MI 0.7%
source: factfinder.census.gov
50 Largest US Cities by Number of Households Earning $200,000+, 2016
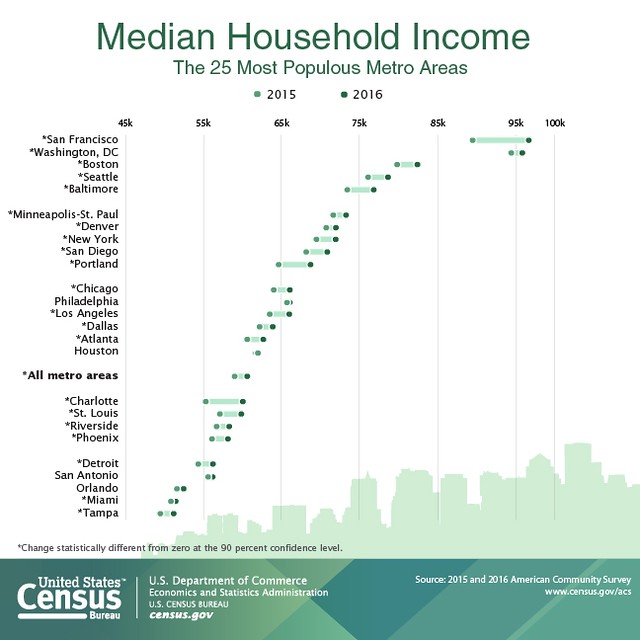
Median Household Income
Its interesting how city level median income numbers often swing wildly from year to year.
50 Largest US Cities by
Median Household Income, 2016
San Francisco, CA $103,801
San Jose, CA $101,940
Seattle, WA $83,476
Washington, DC $75,506
San Diego, CA $71,481
Virginia Beach, VA $71,117
Oakland, CA $68,060
Austin, TX $66,697
Raleigh, NC $64,456
Boston, MA $63,621
Portland, OR $62,127
Denver, CO $61,105
Charlotte, NC $61,017
Colorado Springs, CO $60,308
Long Beach, CA $60,075
New York, NY $58,856
Fort Worth, TX $56,428
Minneapolis, MN $56,255
Sacramento, CA $55,187
Los Angeles, CA $54,432
Nashville, TN $54,310
Arlington, TX $54,272
Atlanta, GA $53,843
Chicago, IL $53,006
Oklahoma City, OK $52,915
Omaha, NE $52,672
Mesa, AZ $52,393
Phoenix, AZ $52,060
Jacksonville, FL $51,298
Kansas City, MO $51,235
Las Vegas, NV $51,115
Albuquerque, NM $50,522
Columbus, OH $49,602
San Antonio, TX $49,268
Wichita, KS $49,202
Louisville, KY $48,996
Houston, TX $47,793
Baltimore, MD $47,350
Dallas, TX $47,243
Indianapolis, IN $44,615
Fresno, CA $44,095
El Paso, TX $43,200
Tulsa, OK $43,134
Philadelphia, PA $41,449
Tucson, AZ $40,021
Memphis, TN $38,826
New Orleans, LA $38,681
Milwaukee, WI $38,097
Miami, FL $34,901
Detroit, MI $28,099
MSA figures are much steadier...
Selected Metro Areas by Median Household Income, 2016
San Jose-Sunnyvale-Santa Clara, CA $110,040
San Francisco-Oakland-Hayward, CA $96,677
Washington-Arlington-Alexandria, DC-VA-MD-WV $95,843
Boston-Cambridge-Newton, MA-NH $82,380
Seattle-Tacoma-Bellevue, WA $78,612
Baltimore-Columbia-Towson, MD $76,788
New York-Newark-Jersey City, NY-NJ-PA $71,897
Minneapolis-St. Paul-Bloomington, MN-WI $71,231
Denver-Aurora-Lakewood, CO $71,926
Raleigh, NC $71,685
Austin-Round Rock, TX $71,000
San Diego-Carlsbad, CA $70,824
Portland-Vancouver-Hillsboro, OR-WA$68,676
Salt Lake City, UT $68,196
Chicago-Naperville-Elgin, IL-IN-WI $66,020
Philadelphia-Camden-Wilmington, PA-NJ-DE-MD $65,996
Los Angeles-Long Beach-Anaheim, CA $65,950
Sacramento--Roseville--Arden-Arcade, CA $64,052
Dallas-Fort Worth-Arlington, TX $63,812
Atlanta-Sandy Springs-Roswell, GA$62,613
Houston-The Woodlands-Sugar Land, TX $61,708
Columbus, OH $60,294
Cincinnati, OH-KY-IN $60,260
Nashville-Davidson--Murfreesboro--Franklin, TN $60,030
Charlotte-Concord-Gastonia, NC-SC $59,979
St. Louis, MO-IL $59,780
Riverside-San Bernardino-Ontario, CA$58,236
Phoenix-Mesa-Scottsdale, AZ $58,075
Milwaukee-Waukesha-West Allis, WI $58,029
Jacksonville, FL $56,840
Indianapolis-Carmel-Anderson, IN $56,750
Detroit-Warren-Dearborn, MI $56,142
San Antonio-New Braunfels, TX $56,105
Pittsburgh, PA $56,063
Las Vegas-Henderson-Paradise, NV $54,384
Orlando-Kissimmee-Sanford, FL $52,385
Cleveland-Elyria, OH Metro Area $52,131
Miami-Fort Lauderdale-West Palm Beach, FL $51,362
Tampa-St. Petersburg-Clearwater, FL $51,115
Memphis, TN-MS-AR $49,809
New Orleans-Metairie, LA $48,804
*Census Bureau 2016 One-Year Estimates Released Sep 14, 2017
50 Largest US Cities( and Metro Areas) by Median Household Income, 2016
09-28-2017, 12:00 AM
Location: Sandy Eggo - Kensington
5,291 posts, read
12,737,271 times
Reputation: 3194
2016 ACS Census Report: Foreign-Born Population for PCSAs
They just got around to releasing the 2016 census estimates for demographical trends in the United States metropolitan regions. First list is by all PCSAs that have a total population over 900,000 people. The "PCSA" stands for Primary Census Statistical Area, which means CSAs for areas that have them and MSAs for areas that don't have CSAs. I'll do a separate list for MSAs in the future, but for the time being will include the Washington DC MSA and Baltimore MSA separately under the overall list.
2016 Foreign-Born Population:
01. Greater New York CSA: 6,415,181
02. Greater Los Angeles CSA: 5,639,329
03. Greater San Francisco Bay Area CSA: 2,630,446
04. Greater Miami/Fort Lauderdale CSA: 2,547,223
05. Greater Washington DC-Baltimore CSA: 1,738,991
06. Greater Chicago CSA: 1,690,211
07. Greater Houston CSA: 1,608,306
08. Greater Dallas/Fort Worth Metroplex CSA: 1,350,257
09. Greater Boston CSA: 1,280,280
10. Greater Atlanta CSA: 861,723
11. Greater San Diego MSA: 797,991
12. Greater Philadelphia CSA: 782,886
13. Greater Seattle CSA: 754,083
14. Greater Phoenix MSA: 675,911
15. Greater Las Vegas CSA: 506,630
16. Greater Orlando CSA: 498,491
17. Greater Detroit CSA: 476,970
18. Greater Sacramento CSA: 453,780
19. Greater Denver CSA: 411,395
20. Greater Tampa Bay Area MSA: 403,995
21. Greater Minneapolis/Saint Paul CSA: 393,818
22. Greater Portland CSA: 370,475
23. Greater Austin MSA: 296,031
24. Greater San Antonio MSA: 295,313
25. Greater Charlotte CSA: 248,734
26. Greater Fresno CSA: 244,579
27. Greater Raleigh/Durham CSA: 243,723
28. Greater Salt Lake City CSA: 226,326
29. Greater Cape Coral-Fort Myers-Naples CSA: 211,125
30. Greater Hartford CSA: 178,568
31. Greater Cleveland CSA: 173,663
32. Greater Columbus CSA: 159,710
33. Greater Indianapolis CSA: 158,903
34. Greater Kansas City CSA: 158,560
35. Greater Tucson CSA: 150,994
36. Greater Nashville CSA: 146,185
37. Greater Saint Louis CSA: 135,957
38. Greater Milwaukee CSA: 131,606
39. Greater Jacksonville CSA: 129,941
40. Greater Greensboro/Winston-Salem CSA: 126,291
41. Greater Virginia Beach/Norfolk CSA: 116,031
42. Greater Albuquerque CSA: 103,603
43. Greater Cincinnati CSA: 98,419
44. Greater Pittsburgh CSA: 92,723
45. Greater Richmond MSA: 92,149
46. Greater Albany CSA: 81,217
47. Greater Greenville CSA: 78,676
48. Greater Grand Rapids CSA: 78,540
49. Greater Rochester CSA: 76,774
50. Greater Omaha CSA: 70,826
51. Greater Louisville CSA: 70,426
52. Greater Tulsa CSA: 70,046
53. Greater Buffalo CSA: 69,846
54. Greater Harrisburg CSA: 63,741
55. Greater Chattanooga CSA: 52,377
56. Greater Birmingham CSA: 51,971
57. Greater Knoxville CSA: 43,924
58. Greater Columbia CSA: 41,088
The Baltimore MSA and Washington D.C. MSA separately;
- Greater Baltimore MSA: 292,149
- Greater Washington D.C. MSA: 1,407,787
For whatever reason, information is either not available for or has become very difficult to extract for El Paso, Honolulu, McAllen. Same goes for San Juan. Those will be omitted because the ACS isn't giving me their 2016 numbers for whatever reason.
Also, I put in some separation between clusters of PCSAs (hence the gap), to show close clustering and general range and/or tiers.
2016 ACS Census Report: Foreign-Born Population for PCSAs
09-28-2017, 01:45 AM
8,390 posts, read
7,642,722 times
Reputation: 11020
Well, you know I love me some factual data! So, a great thread, suburbanite. Thanks for digging this up.
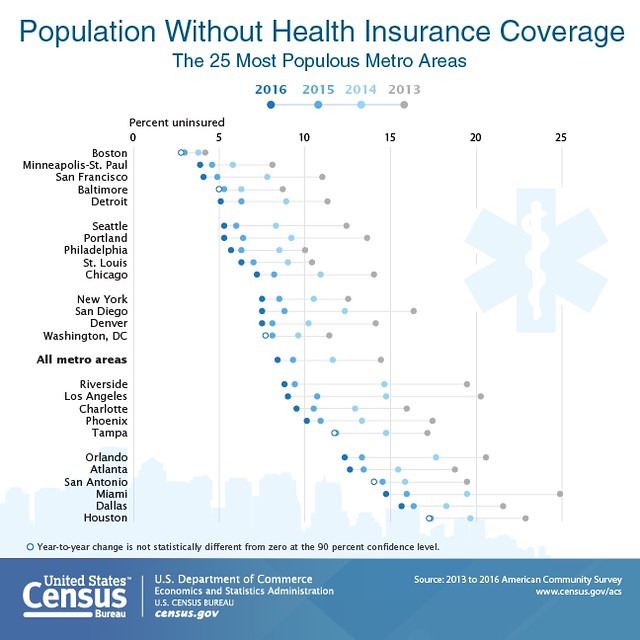
A couple of questions for clarification purposes: In the charts in post one, are the figures for healthcare coverage percentages of people insured or uninsured?
Also, I don't see NY City or NY metro on the list of median incomes. Was that just excluded or an oversight in transcription? It's very interesting to see the SD median incomes in comparison to other major metro areas. We like to tell ourselves that we are all underpaid here, but looking at the data it really doesn't look like we're doing all that bad.
Lots of other interesting data here to digest.
I'll add a few more statistics, just for perspective.
Median sales price of homes, June 2017 (includes all homes --single family, condos, mobile homes):$543,500
Median price of Single Family homes: $595,000
Median price for condos: $412,500
Median price for newly built homes: $787,000
$543,500: San Diego home price breaks another record - The San Diego Union-Tribune
Median rent for a one bedroom in San Diego County as of August 2017: $1800
Median rent for a two bedroom in San Diego County: $2259
https://www.rentjungle.com/average-r...o-rent-trends/
09-28-2017, 02:29 PM
334 posts, read
363,093 times
Reputation: 345
Thanks for posting sdurbanite
09-30-2017, 01:12 PM
Location: Sandy Eggo - Kensington
5,291 posts, read
12,737,271 times
Reputation: 3194
Quote:
Originally Posted by
RosieSD
It's the percentage of people who are uninsured.
Quote:
Originally Posted by
RosieSD
Also, I don't see NY City or NY metro on the list of median incomes. Was that just excluded or an oversight in transcription? It's very interesting to see the SD median incomes in comparison to other major metro areas. We like to tell ourselves that we are all underpaid here, but looking at the data it really doesn't look like we're doing all that bad.
Take a look again, Rosie. I see NYC included in all of the stats mentioned above.
And yes, I'm sure we all complain about being underpaid, but many places are worse than us. It's our home prices that throw everything off. This census data is a couple of years old, but shows SD ranked 5th in percentage of residents earning salaries over $150,000.
The 33 richest cities in the United States | WGN-TV
09-30-2017, 01:18 PM
Location: Sandy Eggo - Kensington
5,291 posts, read
12,737,271 times
Reputation: 3194
Quote:
Originally Posted by
snpdragr
Thanks for posting sdurbanite
I don't think the percentage would change much if you included their children. I'm guessing many of them were born in this country. Or maybe the estimates include children? The only surprises I see on that list is how high Detroit and Orlando are ranked.
09-30-2017, 11:44 PM
Location: San Diego A.K.A "D.A.Y.G.O City"
1,996 posts, read
4,769,387 times
Reputation: 2743
Is there an ajustment for the much higher COL in San Diego and other CA cities?
10-01-2017, 10:02 PM
Location: Sandy Eggo - Kensington
5,291 posts, read
12,737,271 times
Reputation: 3194
Quote:
Originally Posted by
sdlife619
Is there an ajustment for the much higher COL in San Diego and other CA cities?
There are plenty of articles and data out there that say all CA cities are among the least affordable in the country, and raw Census data is often used in those calculations. I find it interesting myself.
10-02-2017, 04:50 AM
Location: San Diego A.K.A "D.A.Y.G.O City"
1,996 posts, read
4,769,387 times
Reputation: 2743
Quote:
Originally Posted by
sdurbanite
There are plenty of articles and data out there that say all CA cities are among the least affordable in the country, and raw Census data is often used in those calculations. I find it interesting myself.
In the OC board, there’s a thread about how someone making 70-80k a year is actually considered low income in OC and how they would qualify for low income housing!!
That’s incredible if you ask me.
Not sure if that’s for a family of 2 or 4, but regardless it just goes to show how quickly expensive CA is becoming for a lot of people as wages aren’t going up fast enough to keep up with housing inflation. The math isn’t in favor for many people that live here anymore. The question is, is your job giving you a 6 to 8 percent raises every year? I am guessing no.
The homeless population has no choice but to grow as the housing shortage and a combination of greed from landlords has made matters worse. Driving downtown at night picking up drunk people after they party in the Gaslamp and EV really shocked me in terms of how dire the homeless population is becoming. It literally looks like a 3rd world country off imperial ave 16th and 17th st. The mental ones that are out of control yelling at nothing seem to be everywhere now. They’re like zombies from the walking dead. Not to mention the pungent odors of **** and **** driving down those streets almost makes me wanna puke!
So although SD does well in many stats, our city isn’t as rosy as we all might think it is. The lack of any political will seriously is crushing any hope we have to make SD a place for everyone to live happily not just the select few.
Please register City-data.com
Data:
Median household income ($)
Median household income (% change since 2000)
Household income diversity
Ratio of average income to average house value (%)
Ratio of average income to average rent
Median household income ($) - White
Median household income ($) - Black or African American
Median household income ($) - Asian
Median household income ($) - Hispanic or Latino
Median household income ($) - American Indian and Alaska Native
Median household income ($) - Multirace
Median household income ($) - Other Race
Median household income for houses/condos with a mortgage ($)
Median household income for apartments without a mortgage ($)
Races - White alone (%)
Races - White alone (% change since 2000)
Races - Black alone (%)
Races - Black alone (% change since 2000)
Races - American Indian alone (%)
Races - American Indian alone (% change since 2000)
Races - Asian alone (%)
Races - Asian alone (% change since 2000)
Races - Hispanic (%)
Races - Hispanic (% change since 2000)
Races - Native Hawaiian and Other Pacific Islander alone (%)
Races - Native Hawaiian and Other Pacific Islander alone (% change since 2000)
Races - Two or more races (%)
Races - Two or more races (% change since 2000)
Races - Other race alone (%)
Races - Other race alone (% change since 2000)
Racial diversity
Unemployment (%)
Unemployment (% change since 2000)
Unemployment (%) - White
Unemployment (%) - Black or African American
Unemployment (%) - Asian
Unemployment (%) - Hispanic or Latino
Unemployment (%) - American Indian and Alaska Native
Unemployment (%) - Multirace
Unemployment (%) - Other Race
Population density (people per square mile)
Population - Males (%)
Population - Females (%)
Population - Males (%) - White
Population - Males (%) - Black or African American
Population - Males (%) - Asian
Population - Males (%) - Hispanic or Latino
Population - Males (%) - American Indian and Alaska Native
Population - Males (%) - Multirace
Population - Males (%) - Other Race
Population - Females (%) - White
Population - Females (%) - Black or African American
Population - Females (%) - Asian
Population - Females (%) - Hispanic or Latino
Population - Females (%) - American Indian and Alaska Native
Population - Females (%) - Multirace
Population - Females (%) - Other Race
Coronavirus confirmed cases (Apr 23, 2024)
Deaths caused by coronavirus (Apr 23, 2024)
Coronavirus confirmed cases (per 100k population) (Apr 23, 2024)
Deaths caused by coronavirus (per 100k population) (Apr 23, 2024)
Daily increase in number of cases (Apr 23, 2024)
Weekly increase in number of cases (Apr 23, 2024)
Cases doubled (in days) (Apr 23, 2024)
Hospitalized patients (Apr 18, 2022)
Negative test results (Apr 18, 2022)
Total test results (Apr 18, 2022)
COVID Vaccine doses distributed (per 100k population) (Sep 19, 2023)
COVID Vaccine doses administered (per 100k population) (Sep 19, 2023)
COVID Vaccine doses distributed (Sep 19, 2023)
COVID Vaccine doses administered (Sep 19, 2023)
Likely homosexual households (%)
Likely homosexual households (% change since 2000)
Likely homosexual households - Lesbian couples (%)
Likely homosexual households - Lesbian couples (% change since 2000)
Likely homosexual households - Gay men (%)
Likely homosexual households - Gay men (% change since 2000)
Cost of living index
Median gross rent ($)
Median contract rent ($)
Median monthly housing costs ($)
Median house or condo value ($)
Median house or condo value ($ change since 2000)
Mean house or condo value by units in structure - 1, detached ($)
Mean house or condo value by units in structure - 1, attached ($)
Mean house or condo value by units in structure - 2 ($)
Mean house or condo value by units in structure by units in structure - 3 or 4 ($)
Mean house or condo value by units in structure - 5 or more ($)
Mean house or condo value by units in structure - Boat, RV, van, etc. ($)
Mean house or condo value by units in structure - Mobile home ($)
Median house or condo value ($) - White
Median house or condo value ($) - Black or African American
Median house or condo value ($) - Asian
Median house or condo value ($) - Hispanic or Latino
Median house or condo value ($) - American Indian and Alaska Native
Median house or condo value ($) - Multirace
Median house or condo value ($) - Other Race
Median resident age
Resident age diversity
Median resident age - Males
Median resident age - Females
Median resident age - White
Median resident age - Black or African American
Median resident age - Asian
Median resident age - Hispanic or Latino
Median resident age - American Indian and Alaska Native
Median resident age - Multirace
Median resident age - Other Race
Median resident age - Males - White
Median resident age - Males - Black or African American
Median resident age - Males - Asian
Median resident age - Males - Hispanic or Latino
Median resident age - Males - American Indian and Alaska Native
Median resident age - Males - Multirace
Median resident age - Males - Other Race
Median resident age - Females - White
Median resident age - Females - Black or African American
Median resident age - Females - Asian
Median resident age - Females - Hispanic or Latino
Median resident age - Females - American Indian and Alaska Native
Median resident age - Females - Multirace
Median resident age - Females - Other Race
Commute - mean travel time to work (minutes)
Travel time to work - Less than 5 minutes (%)
Travel time to work - Less than 5 minutes (% change since 2000)
Travel time to work - 5 to 9 minutes (%)
Travel time to work - 5 to 9 minutes (% change since 2000)
Travel time to work - 10 to 19 minutes (%)
Travel time to work - 10 to 19 minutes (% change since 2000)
Travel time to work - 20 to 29 minutes (%)
Travel time to work - 20 to 29 minutes (% change since 2000)
Travel time to work - 30 to 39 minutes (%)
Travel time to work - 30 to 39 minutes (% change since 2000)
Travel time to work - 40 to 59 minutes (%)
Travel time to work - 40 to 59 minutes (% change since 2000)
Travel time to work - 60 to 89 minutes (%)
Travel time to work - 60 to 89 minutes (% change since 2000)
Travel time to work - 90 or more minutes (%)
Travel time to work - 90 or more minutes (% change since 2000)
Marital status - Never married (%)
Marital status - Now married (%)
Marital status - Separated (%)
Marital status - Widowed (%)
Marital status - Divorced (%)
Median family income ($)
Median family income (% change since 2000)
Median non-family income ($)
Median non-family income (% change since 2000)
Median per capita income ($)
Median per capita income (% change since 2000)
Median family income ($) - White
Median family income ($) - Black or African American
Median family income ($) - Asian
Median family income ($) - Hispanic or Latino
Median family income ($) - American Indian and Alaska Native
Median family income ($) - Multirace
Median family income ($) - Other Race
Median year house/condo built
Median year apartment built
Year house built - Built 2005 or later (%)
Year house built - Built 2000 to 2004 (%)
Year house built - Built 1990 to 1999 (%)
Year house built - Built 1980 to 1989 (%)
Year house built - Built 1970 to 1979 (%)
Year house built - Built 1960 to 1969 (%)
Year house built - Built 1950 to 1959 (%)
Year house built - Built 1940 to 1949 (%)
Year house built - Built 1939 or earlier (%)
Average household size
Household density (households per square mile)
Average household size - White
Average household size - Black or African American
Average household size - Asian
Average household size - Hispanic or Latino
Average household size - American Indian and Alaska Native
Average household size - Multirace
Average household size - Other Race
Occupied housing units (%)
Vacant housing units (%)
Owner occupied housing units (%)
Renter occupied housing units (%)
Vacancy status - For rent (%)
Vacancy status - For sale only (%)
Vacancy status - Rented or sold, not occupied (%)
Vacancy status - For seasonal, recreational, or occasional use (%)
Vacancy status - For migrant workers (%)
Vacancy status - Other vacant (%)
Residents with income below the poverty level (%)
Residents with income below 50% of the poverty level (%)
Children below poverty level (%)
Poor families by family type - Married-couple family (%)
Poor families by family type - Male, no wife present (%)
Poor families by family type - Female, no husband present (%)
Poverty status for native-born residents (%)
Poverty status for foreign-born residents (%)
Poverty among high school graduates not in families (%)
Poverty among people who did not graduate high school not in families (%)
Residents with income below the poverty level (%) - White
Residents with income below the poverty level (%) - Black or African American
Residents with income below the poverty level (%) - Asian
Residents with income below the poverty level (%) - Hispanic or Latino
Residents with income below the poverty level (%) - American Indian and Alaska Native
Residents with income below the poverty level (%) - Multirace
Residents with income below the poverty level (%) - Other Race
Air pollution - Air Quality Index (AQI)
Air pollution - CO
Air pollution - NO2
Air pollution - SO2
Air pollution - Ozone
Air pollution - PM10
Air pollution - PM25
Air pollution - Pb
Crime - Murders per 100,000 population
Crime - Rapes per 100,000 population
Crime - Robberies per 100,000 population
Crime - Assaults per 100,000 population
Crime - Burglaries per 100,000 population
Crime - Thefts per 100,000 population
Crime - Auto thefts per 100,000 population
Crime - Arson per 100,000 population
Crime - City-data.com crime index
Crime - Violent crime index
Crime - Property crime index
Crime - Murders per 100,000 population (5 year average)
Crime - Rapes per 100,000 population (5 year average)
Crime - Robberies per 100,000 population (5 year average)
Crime - Assaults per 100,000 population (5 year average)
Crime - Burglaries per 100,000 population (5 year average)
Crime - Thefts per 100,000 population (5 year average)
Crime - Auto thefts per 100,000 population (5 year average)
Crime - Arson per 100,000 population (5 year average)
Crime - City-data.com crime index (5 year average)
Crime - Violent crime index (5 year average)
Crime - Property crime index (5 year average)
1996 Presidential Elections Results (%) - Democratic Party (Clinton)
1996 Presidential Elections Results (%) - Republican Party (Dole)
1996 Presidential Elections Results (%) - Other
2000 Presidential Elections Results (%) - Democratic Party (Gore)
2000 Presidential Elections Results (%) - Republican Party (Bush)
2000 Presidential Elections Results (%) - Other
2004 Presidential Elections Results (%) - Democratic Party (Kerry)
2004 Presidential Elections Results (%) - Republican Party (Bush)
2004 Presidential Elections Results (%) - Other
2008 Presidential Elections Results (%) - Democratic Party (Obama)
2008 Presidential Elections Results (%) - Republican Party (McCain)
2008 Presidential Elections Results (%) - Other
2012 Presidential Elections Results (%) - Democratic Party (Obama)
2012 Presidential Elections Results (%) - Republican Party (Romney)
2012 Presidential Elections Results (%) - Other
2016 Presidential Elections Results (%) - Democratic Party (Clinton)
2016 Presidential Elections Results (%) - Republican Party (Trump)
2016 Presidential Elections Results (%) - Other
2020 Presidential Elections Results (%) - Democratic Party (Biden)
2020 Presidential Elections Results (%) - Republican Party (Trump)
2020 Presidential Elections Results (%) - Other
Ancestries Reported - Arab (%)
Ancestries Reported - Czech (%)
Ancestries Reported - Danish (%)
Ancestries Reported - Dutch (%)
Ancestries Reported - English (%)
Ancestries Reported - French (%)
Ancestries Reported - French Canadian (%)
Ancestries Reported - German (%)
Ancestries Reported - Greek (%)
Ancestries Reported - Hungarian (%)
Ancestries Reported - Irish (%)
Ancestries Reported - Italian (%)
Ancestries Reported - Lithuanian (%)
Ancestries Reported - Norwegian (%)
Ancestries Reported - Polish (%)
Ancestries Reported - Portuguese (%)
Ancestries Reported - Russian (%)
Ancestries Reported - Scotch-Irish (%)
Ancestries Reported - Scottish (%)
Ancestries Reported - Slovak (%)
Ancestries Reported - Subsaharan African (%)
Ancestries Reported - Swedish (%)
Ancestries Reported - Swiss (%)
Ancestries Reported - Ukrainian (%)
Ancestries Reported - United States (%)
Ancestries Reported - Welsh (%)
Ancestries Reported - West Indian (%)
Ancestries Reported - Other (%)
Educational Attainment - No schooling completed (%)
Educational Attainment - Less than high school (%)
Educational Attainment - High school or equivalent (%)
Educational Attainment - Less than 1 year of college (%)
Educational Attainment - 1 or more years of college (%)
Educational Attainment - Associate degree (%)
Educational Attainment - Bachelor's degree (%)
Educational Attainment - Master's degree (%)
Educational Attainment - Professional school degree (%)
Educational Attainment - Doctorate degree (%)
School Enrollment - Nursery, preschool (%)
School Enrollment - Kindergarten (%)
School Enrollment - Grade 1 to 4 (%)
School Enrollment - Grade 5 to 8 (%)
School Enrollment - Grade 9 to 12 (%)
School Enrollment - College undergrad (%)
School Enrollment - Graduate or professional (%)
School Enrollment - Not enrolled in school (%)
School enrollment - Public schools (%)
School enrollment - Private schools (%)
School enrollment - Not enrolled (%)
Median number of rooms in houses and condos
Median number of rooms in apartments
Housing units lacking complete plumbing facilities (%)
Housing units lacking complete kitchen facilities (%)
Density of houses
Urban houses (%)
Rural houses (%)
Households with people 60 years and over (%)
Households with people 65 years and over (%)
Households with people 75 years and over (%)
Households with one or more nonrelatives (%)
Households with no nonrelatives (%)
Population in households (%)
Family households (%)
Nonfamily households (%)
Population in families (%)
Family households with own children (%)
Median number of bedrooms in owner occupied houses
Mean number of bedrooms in owner occupied houses
Median number of bedrooms in renter occupied houses
Mean number of bedrooms in renter occupied houses
Median number of vehichles in owner occupied houses
Mean number of vehichles in owner occupied houses
Median number of vehichles in renter occupied houses
Mean number of vehichles in renter occupied houses
Mortgage status - with mortgage (%)
Mortgage status - with second mortgage (%)
Mortgage status - with home equity loan (%)
Mortgage status - with both second mortgage and home equity loan (%)
Mortgage status - without a mortgage (%)
Average family size
Average family size - White
Average family size - Black or African American
Average family size - Asian
Average family size - Hispanic or Latino
Average family size - American Indian and Alaska Native
Average family size - Multirace
Average family size - Other Race
Geographical mobility - Same house 1 year ago (%)
Geographical mobility - Moved within same county (%)
Geographical mobility - Moved from different county within same state (%)
Geographical mobility - Moved from different state (%)
Geographical mobility - Moved from abroad (%)
Place of birth - Born in state of residence (%)
Place of birth - Born in other state (%)
Place of birth - Native, outside of US (%)
Place of birth - Foreign born (%)
Housing units in structures - 1, detached (%)
Housing units in structures - 1, attached (%)
Housing units in structures - 2 (%)
Housing units in structures - 3 or 4 (%)
Housing units in structures - 5 to 9 (%)
Housing units in structures - 10 to 19 (%)
Housing units in structures - 20 to 49 (%)
Housing units in structures - 50 or more (%)
Housing units in structures - Mobile home (%)
Housing units in structures - Boat, RV, van, etc. (%)
House/condo owner moved in on average (years ago)
Renter moved in on average (years ago)
Year householder moved into unit - Moved in 1999 to March 2000 (%)
Year householder moved into unit - Moved in 1995 to 1998 (%)
Year householder moved into unit - Moved in 1990 to 1994 (%)
Year householder moved into unit - Moved in 1980 to 1989 (%)
Year householder moved into unit - Moved in 1970 to 1979 (%)
Year householder moved into unit - Moved in 1969 or earlier (%)
Means of transportation to work - Drove car alone (%)
Means of transportation to work - Carpooled (%)
Means of transportation to work - Public transportation (%)
Means of transportation to work - Bus or trolley bus (%)
Means of transportation to work - Streetcar or trolley car (%)
Means of transportation to work - Subway or elevated (%)
Means of transportation to work - Railroad (%)
Means of transportation to work - Ferryboat (%)
Means of transportation to work - Taxicab (%)
Means of transportation to work - Motorcycle (%)
Means of transportation to work - Bicycle (%)
Means of transportation to work - Walked (%)
Means of transportation to work - Other means (%)
Working at home (%)
Industry diversity
Most Common Industries - Agriculture, forestry, fishing and hunting, and mining (%)
Most Common Industries - Agriculture, forestry, fishing and hunting (%)
Most Common Industries - Mining, quarrying, and oil and gas extraction (%)
Most Common Industries - Construction (%)
Most Common Industries - Manufacturing (%)
Most Common Industries - Wholesale trade (%)
Most Common Industries - Retail trade (%)
Most Common Industries - Transportation and warehousing, and utilities (%)
Most Common Industries - Transportation and warehousing (%)
Most Common Industries - Utilities (%)
Most Common Industries - Information (%)
Most Common Industries - Finance and insurance, and real estate and rental and leasing (%)
Most Common Industries - Finance and insurance (%)
Most Common Industries - Real estate and rental and leasing (%)
Most Common Industries - Professional, scientific, and management, and administrative and waste management services (%)
Most Common Industries - Professional, scientific, and technical services (%)
Most Common Industries - Management of companies and enterprises (%)
Most Common Industries - Administrative and support and waste management services (%)
Most Common Industries - Educational services, and health care and social assistance (%)
Most Common Industries - Educational services (%)
Most Common Industries - Health care and social assistance (%)
Most Common Industries - Arts, entertainment, and recreation, and accommodation and food services (%)
Most Common Industries - Arts, entertainment, and recreation (%)
Most Common Industries - Accommodation and food services (%)
Most Common Industries - Other services, except public administration (%)
Most Common Industries - Public administration (%)
Occupation diversity
Most Common Occupations - Management, business, science, and arts occupations (%)
Most Common Occupations - Management, business, and financial occupations (%)
Most Common Occupations - Management occupations (%)
Most Common Occupations - Business and financial operations occupations (%)
Most Common Occupations - Computer, engineering, and science occupations (%)
Most Common Occupations - Computer and mathematical occupations (%)
Most Common Occupations - Architecture and engineering occupations (%)
Most Common Occupations - Life, physical, and social science occupations (%)
Most Common Occupations - Education, legal, community service, arts, and media occupations (%)
Most Common Occupations - Community and social service occupations (%)
Most Common Occupations - Legal occupations (%)
Most Common Occupations - Education, training, and library occupations (%)
Most Common Occupations - Arts, design, entertainment, sports, and media occupations (%)
Most Common Occupations - Healthcare practitioners and technical occupations (%)
Most Common Occupations - Health diagnosing and treating practitioners and other technical occupations (%)
Most Common Occupations - Health technologists and technicians (%)
Most Common Occupations - Service occupations (%)
Most Common Occupations - Healthcare support occupations (%)
Most Common Occupations - Protective service occupations (%)
Most Common Occupations - Fire fighting and prevention, and other protective service workers including supervisors (%)
Most Common Occupations - Law enforcement workers including supervisors (%)
Most Common Occupations - Food preparation and serving related occupations (%)
Most Common Occupations - Building and grounds cleaning and maintenance occupations (%)
Most Common Occupations - Personal care and service occupations (%)
Most Common Occupations - Sales and office occupations (%)
Most Common Occupations - Sales and related occupations (%)
Most Common Occupations - Office and administrative support occupations (%)
Most Common Occupations - Natural resources, construction, and maintenance occupations (%)
Most Common Occupations - Farming, fishing, and forestry occupations (%)
Most Common Occupations - Construction and extraction occupations (%)
Most Common Occupations - Installation, maintenance, and repair occupations (%)
Most Common Occupations - Production, transportation, and material moving occupations (%)
Most Common Occupations - Production occupations (%)
Most Common Occupations - Transportation occupations (%)
Most Common Occupations - Material moving occupations (%)
People in Group quarters - Institutionalized population (%)
People in Group quarters - Correctional institutions (%)
People in Group quarters - Federal prisons and detention centers (%)
People in Group quarters - Halfway houses (%)
People in Group quarters - Local jails and other confinement facilities (including police lockups) (%)
People in Group quarters - Military disciplinary barracks (%)
People in Group quarters - State prisons (%)
People in Group quarters - Other types of correctional institutions (%)
People in Group quarters - Nursing homes (%)
People in Group quarters - Hospitals/wards, hospices, and schools for the handicapped (%)
People in Group quarters - Hospitals/wards and hospices for chronically ill (%)
People in Group quarters - Hospices or homes for chronically ill (%)
People in Group quarters - Military hospitals or wards for chronically ill (%)
People in Group quarters - Other hospitals or wards for chronically ill (%)
People in Group quarters - Hospitals or wards for drug/alcohol abuse (%)
People in Group quarters - Mental (Psychiatric) hospitals or wards (%)
People in Group quarters - Schools, hospitals, or wards for the mentally retarded (%)
People in Group quarters - Schools, hospitals, or wards for the physically handicapped (%)
People in Group quarters - Institutions for the deaf (%)
People in Group quarters - Institutions for the blind (%)
People in Group quarters - Orthopedic wards and institutions for the physically handicapped (%)
People in Group quarters - Wards in general hospitals for patients who have no usual home elsewhere (%)
People in Group quarters - Wards in military hospitals for patients who have no usual home elsewhere (%)
People in Group quarters - Juvenile institutions (%)
People in Group quarters - Long-term care (%)
People in Group quarters - Homes for abused, dependent, and neglected children (%)
People in Group quarters - Residential treatment centers for emotionally disturbed children (%)
People in Group quarters - Training schools for juvenile delinquents (%)
People in Group quarters - Short-term care, detention or diagnostic centers for delinquent children (%)
People in Group quarters - Type of juvenile institution unknown (%)
People in Group quarters - Noninstitutionalized population (%)
People in Group quarters - College dormitories (includes college quarters off campus) (%)
People in Group quarters - Military quarters (%)
People in Group quarters - On base (%)
People in Group quarters - Barracks, unaccompanied personnel housing (UPH), (Enlisted/Officer), ;and similar group living quarters for military personnel (%)
People in Group quarters - Transient quarters for temporary residents (%)
People in Group quarters - Military ships (%)
People in Group quarters - Group homes (%)
People in Group quarters - Homes or halfway houses for drug/alcohol abuse (%)
People in Group quarters - Homes for the mentally ill (%)
People in Group quarters - Homes for the mentally retarded (%)
People in Group quarters - Homes for the physically handicapped (%)
People in Group quarters - Other group homes (%)
People in Group quarters - Religious group quarters (%)
People in Group quarters - Dormitories (%)
People in Group quarters - Agriculture workers' dormitories on farms (%)
People in Group quarters - Job Corps and vocational training facilities (%)
People in Group quarters - Other workers' dormitories (%)
People in Group quarters - Crews of maritime vessels (%)
People in Group quarters - Other nonhousehold living situations (%)
People in Group quarters - Other noninstitutional group quarters (%)
Residents speaking English at home (%)
Residents speaking English at home - Born in the United States (%)
Residents speaking English at home - Native, born elsewhere (%)
Residents speaking English at home - Foreign born (%)
Residents speaking Spanish at home (%)
Residents speaking Spanish at home - Born in the United States (%)
Residents speaking Spanish at home - Native, born elsewhere (%)
Residents speaking Spanish at home - Foreign born (%)
Residents speaking other language at home (%)
Residents speaking other language at home - Born in the United States (%)
Residents speaking other language at home - Native, born elsewhere (%)
Residents speaking other language at home - Foreign born (%)
Class of Workers - Employee of private company (%)
Class of Workers - Self-employed in own incorporated business (%)
Class of Workers - Private not-for-profit wage and salary workers (%)
Class of Workers - Local government workers (%)
Class of Workers - State government workers (%)
Class of Workers - Federal government workers (%)
Class of Workers - Self-employed workers in own not incorporated business and Unpaid family workers (%)
House heating fuel used in houses and condos - Utility gas (%)
House heating fuel used in houses and condos - Bottled, tank, or LP gas (%)
House heating fuel used in houses and condos - Electricity (%)
House heating fuel used in houses and condos - Fuel oil, kerosene, etc. (%)
House heating fuel used in houses and condos - Coal or coke (%)
House heating fuel used in houses and condos - Wood (%)
House heating fuel used in houses and condos - Solar energy (%)
House heating fuel used in houses and condos - Other fuel (%)
House heating fuel used in houses and condos - No fuel used (%)
House heating fuel used in apartments - Utility gas (%)
House heating fuel used in apartments - Bottled, tank, or LP gas (%)
House heating fuel used in apartments - Electricity (%)
House heating fuel used in apartments - Fuel oil, kerosene, etc. (%)
House heating fuel used in apartments - Coal or coke (%)
House heating fuel used in apartments - Wood (%)
House heating fuel used in apartments - Solar energy (%)
House heating fuel used in apartments - Other fuel (%)
House heating fuel used in apartments - No fuel used (%)
Armed forces status - In Armed Forces (%)
Armed forces status - Civilian (%)
Armed forces status - Civilian - Veteran (%)
Armed forces status - Civilian - Nonveteran (%)
Fatal accidents locations in years 2005-2021
Fatal accidents locations in 2005
Fatal accidents locations in 2006
Fatal accidents locations in 2007
Fatal accidents locations in 2008
Fatal accidents locations in 2009
Fatal accidents locations in 2010
Fatal accidents locations in 2011
Fatal accidents locations in 2012
Fatal accidents locations in 2013
Fatal accidents locations in 2014
Fatal accidents locations in 2015
Fatal accidents locations in 2016
Fatal accidents locations in 2017
Fatal accidents locations in 2018
Fatal accidents locations in 2019
Fatal accidents locations in 2020
Fatal accidents locations in 2021
Alcohol use - People drinking some alcohol every month (%)
Alcohol use - People not drinking at all (%)
Alcohol use - Average days/month drinking alcohol
Alcohol use - Average drinks/week
Alcohol use - Average days/year people drink much
Audiometry - Average condition of hearing (%)
Audiometry - People that can hear a whisper from across a quiet room (%)
Audiometry - People that can hear normal voice from across a quiet room (%)
Audiometry - Ears ringing, roaring, buzzing (%)
Audiometry - Had a job exposure to loud noise (%)
Audiometry - Had off-work exposure to loud noise (%)
Blood Pressure & Cholesterol - Has high blood pressure (%)
Blood Pressure & Cholesterol - Checking blood pressure at home (%)
Blood Pressure & Cholesterol - Frequently checking blood cholesterol (%)
Blood Pressure & Cholesterol - Has high cholesterol level (%)
Consumer Behavior - Money monthly spent on food at supermarket/grocery store
Consumer Behavior - Money monthly spent on food at other stores
Consumer Behavior - Money monthly spent on eating out
Consumer Behavior - Money monthly spent on carryout/delivered foods
Consumer Behavior - Income spent on food at supermarket/grocery store (%)
Consumer Behavior - Income spent on food at other stores (%)
Consumer Behavior - Income spent on eating out (%)
Consumer Behavior - Income spent on carryout/delivered foods (%)
Current Health Status - General health condition (%)
Current Health Status - Blood donors (%)
Current Health Status - Has blood ever tested for HIV virus (%)
Current Health Status - Left-handed people (%)
Dermatology - People using sunscreen (%)
Diabetes - Diabetics (%)
Diabetes - Had a blood test for high blood sugar (%)
Diabetes - People taking insulin (%)
Diet Behavior & Nutrition - Diet health (%)
Diet Behavior & Nutrition - Milk product consumption (# of products/month)
Diet Behavior & Nutrition - Meals not home prepared (#/week)
Diet Behavior & Nutrition - Meals from fast food or pizza place (#/week)
Diet Behavior & Nutrition - Ready-to-eat foods (#/month)
Diet Behavior & Nutrition - Frozen meals/pizza (#/month)
Drug Use - People that ever used marijuana or hashish (%)
Drug Use - Ever used hard drugs (%)
Drug Use - Ever used any form of cocaine (%)
Drug Use - Ever used heroin (%)
Drug Use - Ever used methamphetamine (%)
Health Insurance - People covered by health insurance (%)
Kidney Conditions-Urology - Avg. # of times urinating at night
Medical Conditions - People with asthma (%)
Medical Conditions - People with anemia (%)
Medical Conditions - People with psoriasis (%)
Medical Conditions - People with overweight (%)
Medical Conditions - Elderly people having difficulties in thinking or remembering (%)
Medical Conditions - People who ever received blood transfusion (%)
Medical Conditions - People having trouble seeing even with glass/contacts (%)
Medical Conditions - People with arthritis (%)
Medical Conditions - People with gout (%)
Medical Conditions - People with congestive heart failure (%)
Medical Conditions - People with coronary heart disease (%)
Medical Conditions - People with angina pectoris (%)
Medical Conditions - People who ever had heart attack (%)
Medical Conditions - People who ever had stroke (%)
Medical Conditions - People with emphysema (%)
Medical Conditions - People with thyroid problem (%)
Medical Conditions - People with chronic bronchitis (%)
Medical Conditions - People with any liver condition (%)
Medical Conditions - People who ever had cancer or malignancy (%)
Mental Health - People who have little interest in doing things (%)
Mental Health - People feeling down, depressed, or hopeless (%)
Mental Health - People who have trouble sleeping or sleeping too much (%)
Mental Health - People feeling tired or having little energy (%)
Mental Health - People with poor appetite or overeating (%)
Mental Health - People feeling bad about themself (%)
Mental Health - People who have trouble concentrating on things (%)
Mental Health - People moving or speaking slowly or too fast (%)
Mental Health - People having thoughts they would be better off dead (%)
Oral Health - Average years since last visit a dentist
Oral Health - People embarrassed because of mouth (%)
Oral Health - People with gum disease (%)
Oral Health - General health of teeth and gums (%)
Oral Health - Average days a week using dental floss/device
Oral Health - Average days a week using mouthwash for dental problem
Oral Health - Average number of teeth
Pesticide Use - Households using pesticides to control insects (%)
Pesticide Use - Households using pesticides to kill weeds (%)
Physical Activity - People doing vigorous-intensity work activities (%)
Physical Activity - People doing moderate-intensity work activities (%)
Physical Activity - People walking or bicycling (%)
Physical Activity - People doing vigorous-intensity recreational activities (%)
Physical Activity - People doing moderate-intensity recreational activities (%)
Physical Activity - Average hours a day doing sedentary activities
Physical Activity - Average hours a day watching TV or videos
Physical Activity - Average hours a day using computer
Physical Functioning - People having limitations keeping them from working (%)
Physical Functioning - People limited in amount of work they can do (%)
Physical Functioning - People that need special equipment to walk (%)
Physical Functioning - People experiencing confusion/memory problems (%)
Physical Functioning - People requiring special healthcare equipment (%)
Prescription Medications - Average number of prescription medicines taking
Preventive Aspirin Use - Adults 40+ taking low-dose aspirin (%)
Reproductive Health - Vaginal deliveries (%)
Reproductive Health - Cesarean deliveries (%)
Reproductive Health - Deliveries resulted in a live birth (%)
Reproductive Health - Pregnancies resulted in a delivery (%)
Reproductive Health - Women breastfeeding newborns (%)
Reproductive Health - Women that had a hysterectomy (%)
Reproductive Health - Women that had both ovaries removed (%)
Reproductive Health - Women that have ever taken birth control pills (%)
Reproductive Health - Women taking birth control pills (%)
Reproductive Health - Women that have ever used Depo-Provera or injectables (%)
Reproductive Health - Women that have ever used female hormones (%)
Sexual Behavior - People 18+ that ever had sex (vaginal, anal, or oral) (%)
Sexual Behavior - Males 18+ that ever had vaginal sex with a woman (%)
Sexual Behavior - Males 18+ that ever performed oral sex on a woman (%)
Sexual Behavior - Males 18+ that ever had anal sex with a woman (%)
Sexual Behavior - Males 18+ that ever had any sex with a man (%)
Sexual Behavior - Females 18+ that ever had vaginal sex with a man (%)
Sexual Behavior - Females 18+ that ever performed oral sex on a man (%)
Sexual Behavior - Females 18+ that ever had anal sex with a man (%)
Sexual Behavior - Females 18+ that ever had any kind of sex with a woman (%)
Sexual Behavior - Average age people first had sex
Sexual Behavior - Average number of female sex partners in lifetime (males 18+)
Sexual Behavior - Average number of female vaginal sex partners in lifetime (males 18+)
Sexual Behavior - Average age people first performed oral sex on a woman (18+)
Sexual Behavior - Average number of woman performed oral sex on in lifetime (18+)
Sexual Behavior - Average number of male sex partners in lifetime (males 18+)
Sexual Behavior - Average number of male anal sex partners in lifetime (males 18+)
Sexual Behavior - Average age people first performed oral sex on a man (18+)
Sexual Behavior - Average number of male oral sex partners in lifetime (18+)
Sexual Behavior - People using protection when performing oral sex (%)
Sexual Behavior - Average number of times people have vaginal or anal sex a year
Sexual Behavior - People having sex without condom (%)
Sexual Behavior - Average number of male sex partners in lifetime (females 18+)
Sexual Behavior - Average number of male vaginal sex partners in lifetime (females 18+)
Sexual Behavior - Average number of female sex partners in lifetime (females 18+)
Sexual Behavior - Circumcised males 18+ (%)
Sleep Disorders - Average hours sleeping at night
Sleep Disorders - People that has trouble sleeping (%)
Smoking-Cigarette Use - People smoking cigarettes (%)
Taste & Smell - People 40+ having problems with smell (%)
Taste & Smell - People 40+ having problems with taste (%)
Taste & Smell - People 40+ that ever had wisdom teeth removed (%)
Taste & Smell - People 40+ that ever had tonsils teeth removed (%)
Taste & Smell - People 40+ that ever had a loss of consciousness because of a head injury (%)
Taste & Smell - People 40+ that ever had a broken nose or other serious injury to face or skull (%)
Taste & Smell - People 40+ that ever had two or more sinus infections (%)
Weight - Average height (inches)
Weight - Average weight (pounds)
Weight - Average BMI
Weight - People that are obese (%)
Weight - People that ever were obese (%)
Weight - People trying to lose weight (%)

 Please register to participate in our discussions with 2 million other members - it's free and quick! Some forums can only be seen by registered members. After you create your account, you'll be able to customize options and access all our 15,000 new posts/day with fewer ads.