Please register to participate in our discussions with 2 million other members - it's free and quick! Some forums can only be seen by registered members. After you create your account, you'll be able to customize options and access all our 15,000 new posts/day with fewer ads.
That is an interesting test actually. Which months are more prone to heat waves than cold snaps. For Portland, March-October have record highs that are greater departures from average than their record lows. From November to February, the opposite is true. Once again, this is consistent with my experience. November is much more prone to temperatures below 20 than March despite the fact that March has lower average lows overall.
Lots of missing data, not usable. Do you have another source for the full record? [Has to be downloadable in one file containing the entire period]
I usually get it from tutiempo, meteociel or weatheronline, but there are gaps in the data on all of those websites. The Met Office will have it, but they will charge.
Interesting. Helsinki is capable of very cold air, but the majority of days are quite close to the averages, or even above, but the occational cold outbreaks draw down the averages. Well, having living in the city, this is exactly my impression.
The diurnal ranges are low, even almost nonexisting when mild moist air comes from the W or SW. This is going on right now here in Turku. Observations from the last 24 hours. Red is temp, green is DP:
Better graph from Helsinki C for the last 30 days:
The station data was from the airport, btw Vantaa.
One difference I noticed is that there isn't much day to day range even if there's a lot of temperature range over the entire month. Big jump right around Jan 24, but otherwise not much change. Your variability range is a bit higher than mine [see table] but my graphs and table can't capture the variability in day to day ranges. I'd like to find a good way to measure that. Anyone have any suggestions?
I added more cities to the table [previous page]. More charts of other cities. Beijing & Shanghai:
Vancouver has a surprisingly low temperature range, a lot more than Paris; thought they'd be more similar.
Nothing stable about this area. Just a typical up and down winter.
This year going a tad higher going above 55F but hasn't been as cold as other years. So others years will have colder days/nights more often but still we get the 40s/low 50s to happen. And the swings definitely feels more often this year. Usually will be a week or so, not within days
Teens, 20s & 30s to 30s, 40s & 50s.... up and down, round and round. Weeeee.
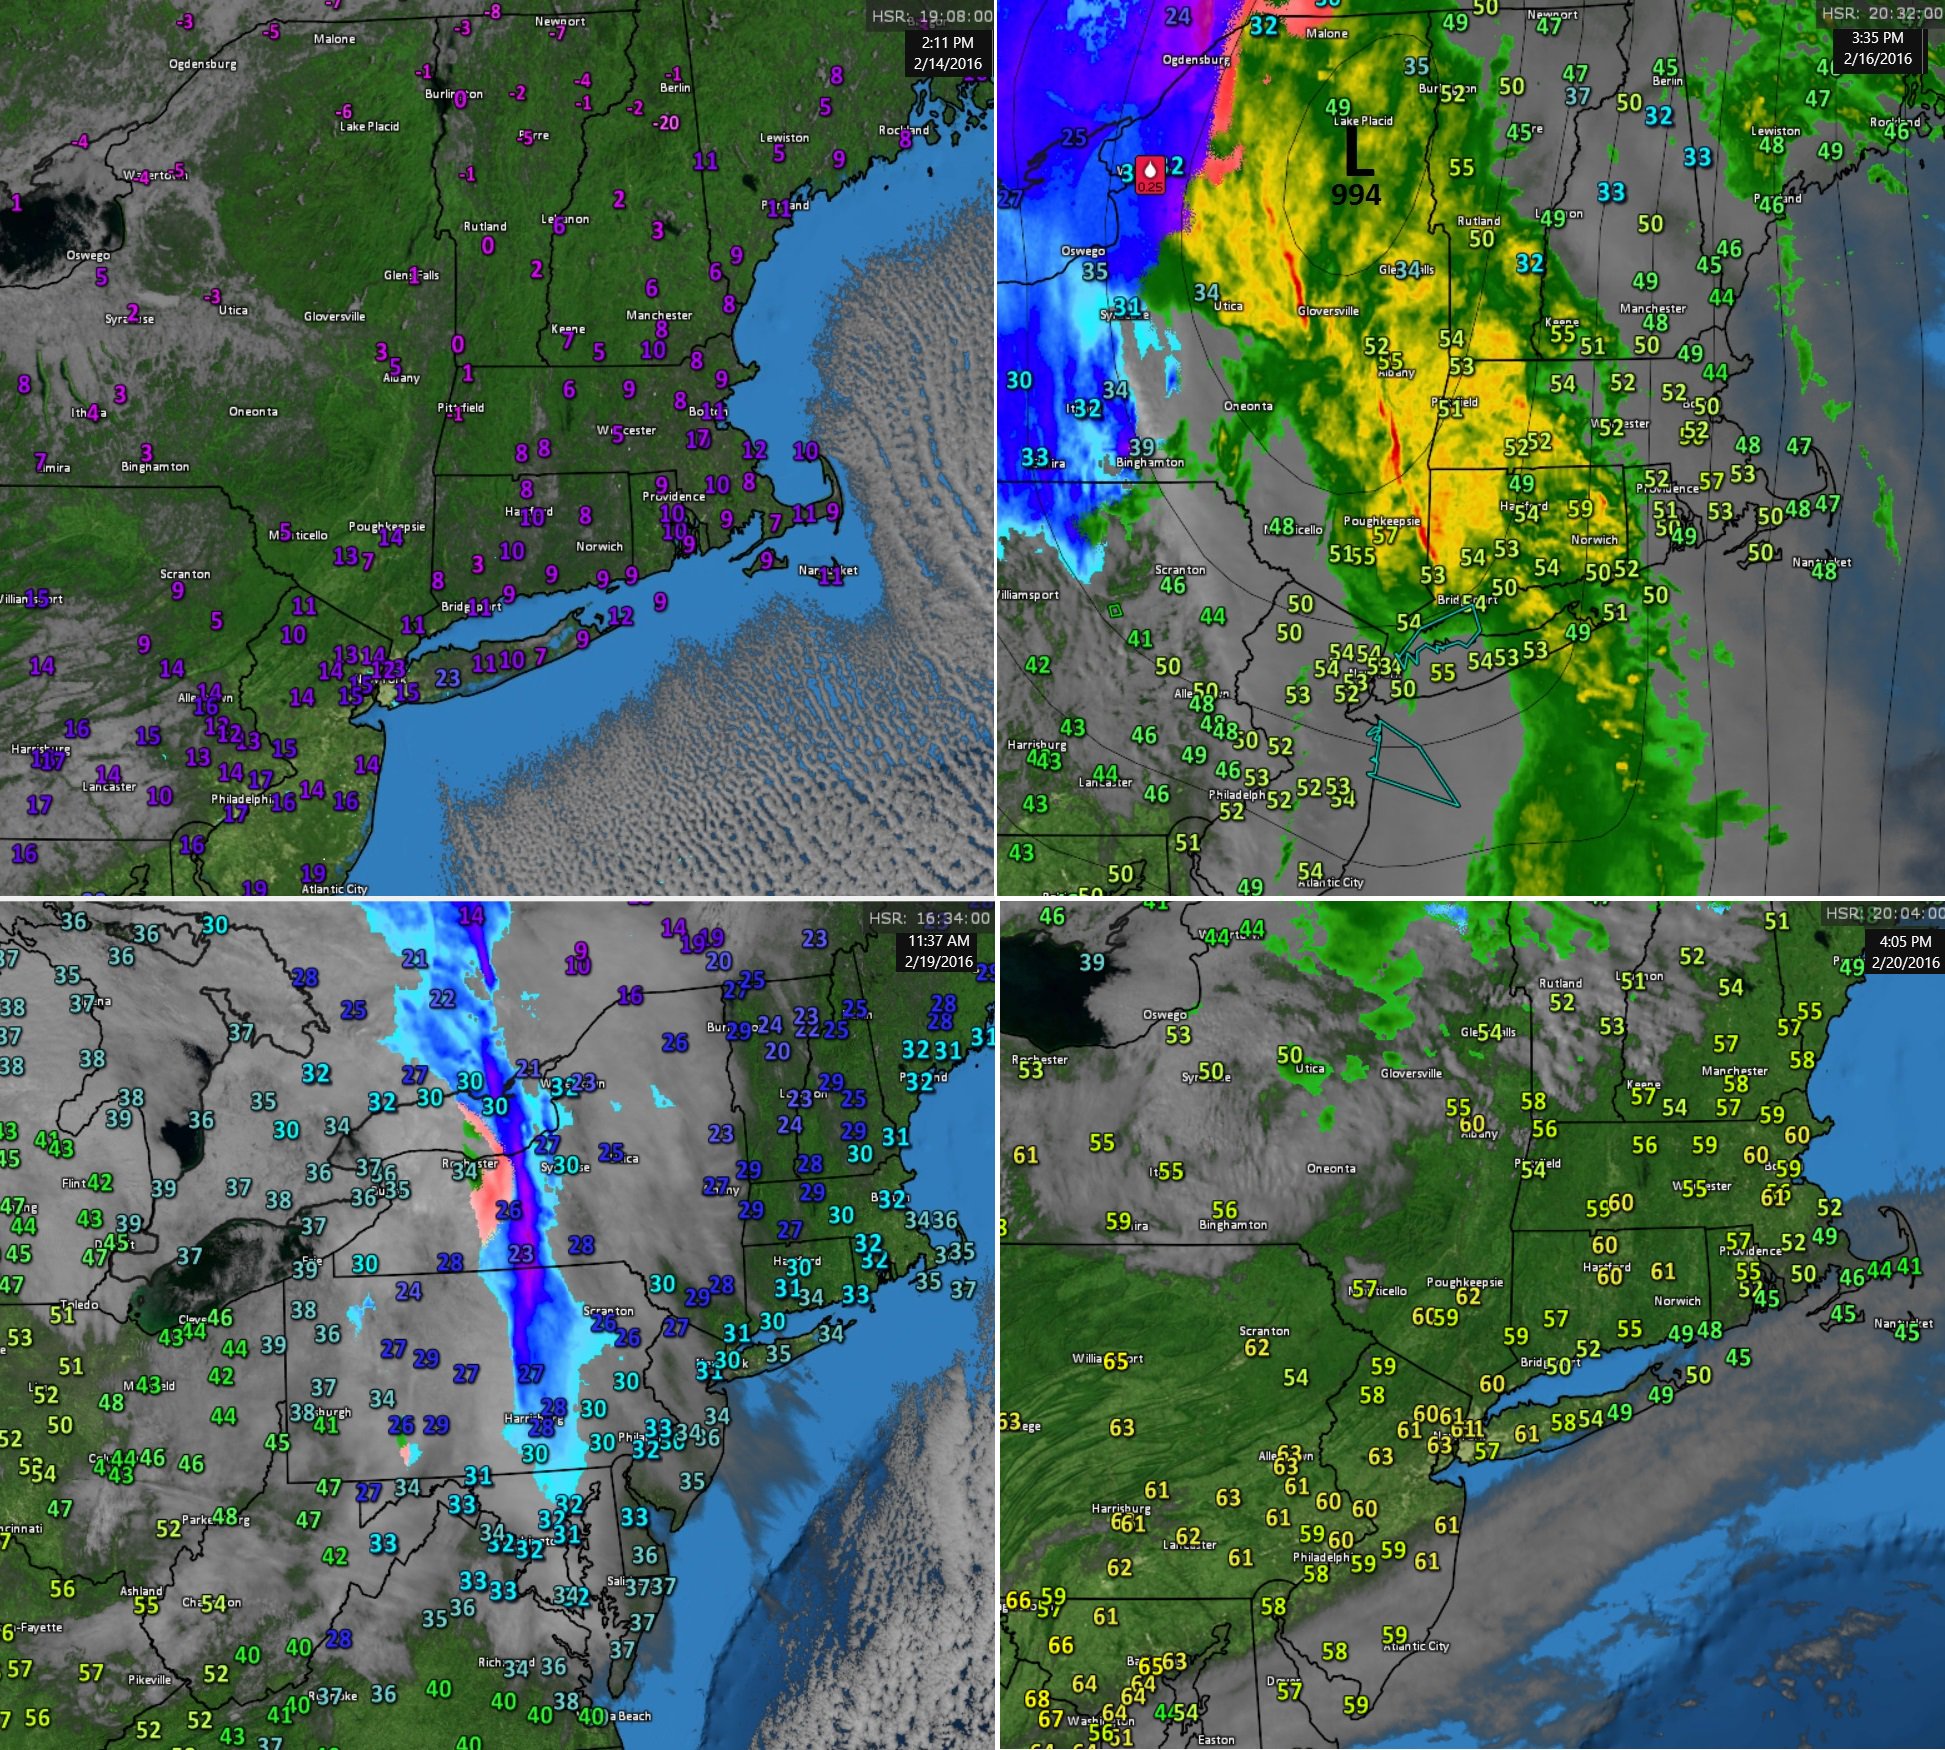
Just using Max Temps:
Jan 10: 59°
Jan 23: 26°
Feb 1: 60°
Feb 14: 12°
Feb 16: 54°
Feb 18: 32°
Feb 25: 63°
Feb 26: 37°
Feb 29: 50s
And it continues for CT and Southern New England...
Teens & 20s to 60s & maybe 70s coming
Max temps struggling past mid 30s to max temps reaching into the 60s within a couple days
Actually where is the Spring stability thread now.
Please register to post and access all features of our very popular forum. It is free and quick. Over $68,000 in prizes has already been given out to active posters on our forum. Additional giveaways are planned.
Detailed information about all U.S. cities, counties, and zip codes on our site: City-data.com.

 Please register to participate in our discussions with 2 million other members - it's free and quick! Some forums can only be seen by registered members. After you create your account, you'll be able to customize options and access all our 15,000 new posts/day with fewer ads.


")