Please register to participate in our discussions with 2 million other members - it's free and quick! Some forums can only be seen by registered members. After you create your account, you'll be able to customize options and access all our 15,000 new posts/day with fewer ads.
Here's an interesting fact, The hottest temperature recorded in BC each year averages 40.6C/105F. 2015 was above that at 42C (108F). The BC average is far and away above any other province.
At the other end of the extreme spectrum, the Yukon typically drops below -52C (62F). This is far colder than anyone else.
Looks like you used a forum link with the image tags so they weren't coming up. So I pasted the images into your post above..
Nice maps! I like how Prince Edward Island near Nova Scotia has a colder extreme max south and East of Hudson Bay. Also makes sense how Ontario has colder extremes than anywhere in Quebec. but I assume there is lack of data around to get an entire providence the same color(temp). Would think northern Quebec see's colder temps than southern Ontario.
Do you have a link or images for the monthly Max/Min Averages? Preferably winter months for now since we're in season now.
I find it strange that the average extreme max in so much warmer in the NWT compared to Nunavut. There's probably no weather station in the SE corner of Nunavut away from Hudson Bay.
Also, it's interesting that the hottest and coldest temperatures on average are recorded in the two westernmost provinces, as western sides have a reputation for moderation.
Also, it's interesting that the hottest and coldest temperatures on average are recorded in the two westernmost provinces, as western sides have a reputation for moderation.
The heat records probably have to do with drier summers in British Columbia, as well as Alberta being at moderate elevation. West sides don't always have more moderate summers; Spain has hot summers for its latitude in many spots and has recorded some heat extremes. Southern France doesn't have cool summers for its latitude.
Never understood why parts of the west have their coldest days in December. Might have something to do with the trough/ridge patterns coming off the Pacific?
Never understood why parts of the west have their coldest days in December. Might have something to do with the trough/ridge patterns coming off the Pacific?
Me either. I was going to say that same thing but I know you guys are more keen on Western U.S climate so I didn't. But now I wonder again. lol
I'm going to assume it has to do with the delayed strength of the Polar Jet stream and Vortex that it doesn't really push down till mid winter, in which case the Eastern half would get their coldest of the year.
Never understood why parts of the west have their coldest days in December. Might have something to do with the trough/ridge patterns coming off the Pacific?
Another interesting thing to note that the higher elevation places have more of a lag than the lower elevations, which seems opposite of what you'd expect! ... On second thought, I think that this is because inversions happen when the days are shortest.
Quote:
Originally Posted by Cambium
Do you have a link or images for the monthly Max/Min Averages? Preferably winter months for now since we're in season now.
To be clear, these maps are based upon the extreme temperatures. For example, even though the BC coast is the mildest place in Canada, the northeast corner almost always gets down to -40C/-40.00000000000000F. As for Quebec and Ontario, the southern part of Quebec around Montreal sees the hottest temperatures, and these are similar to southern Ontario.
As for the maps you are requesting... here you go...
This one shows both sides of the border:
Here's another one:
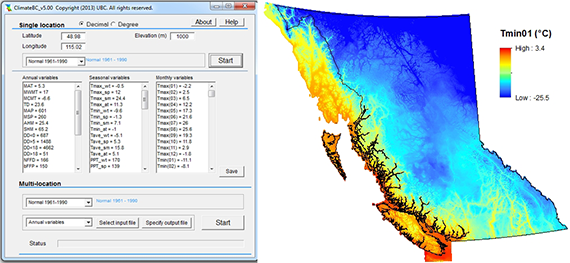
Those are summer, but here is what winter looks like:
This map shows precipitation:
Here is a precipitation map of western Canada:
And a zoomed in one:
And finally, here is a Alaska and the Yukon:
Quote:
Originally Posted by Rozenn
I find it strange that the average extreme max in so much warmer in the NWT compared to Nunavut. There's probably no weather station in the SE corner of Nunavut away from Hudson Bay.
Also, it's interesting that the hottest and coldest temperatures on average are recorded in the two westernmost provinces, as western sides have a reputation for moderation.
You are wrongly assuming that the NWT gets it's extreme heat on the southern border, though you are right that Nunavut doesn't have a lot in the way of weather stations in the south. The extreme heat in the NWT typically happens west of the Alberta border, typically along the Liard and Mackenzie rivers (Fort Good Hope, For Liard, Fort Simpson, etc.). Even though Fort Smith is the southernmost place, situated right on the Alberta border, it has only been the NWT's hottest spot once in the past 20 years (that was in 2012).
The extreme west coast is moderate, but not inland. The air is drier in BC and Alberta than it is in Saskatchewan and Manitoba so it doesn't take nearly as much energy to generate high temperatures.
Please register to post and access all features of our very popular forum. It is free and quick. Over $68,000 in prizes has already been given out to active posters on our forum. Additional giveaways are planned.
Detailed information about all U.S. cities, counties, and zip codes on our site: City-data.com.

 Please register to participate in our discussions with 2 million other members - it's free and quick! Some forums can only be seen by registered members. After you create your account, you'll be able to customize options and access all our 15,000 new posts/day with fewer ads.