Please register to participate in our discussions with 2 million other members - it's free and quick! Some forums can only be seen by registered members. After you create your account, you'll be able to customize options and access all our 15,000 new posts/day with fewer ads.
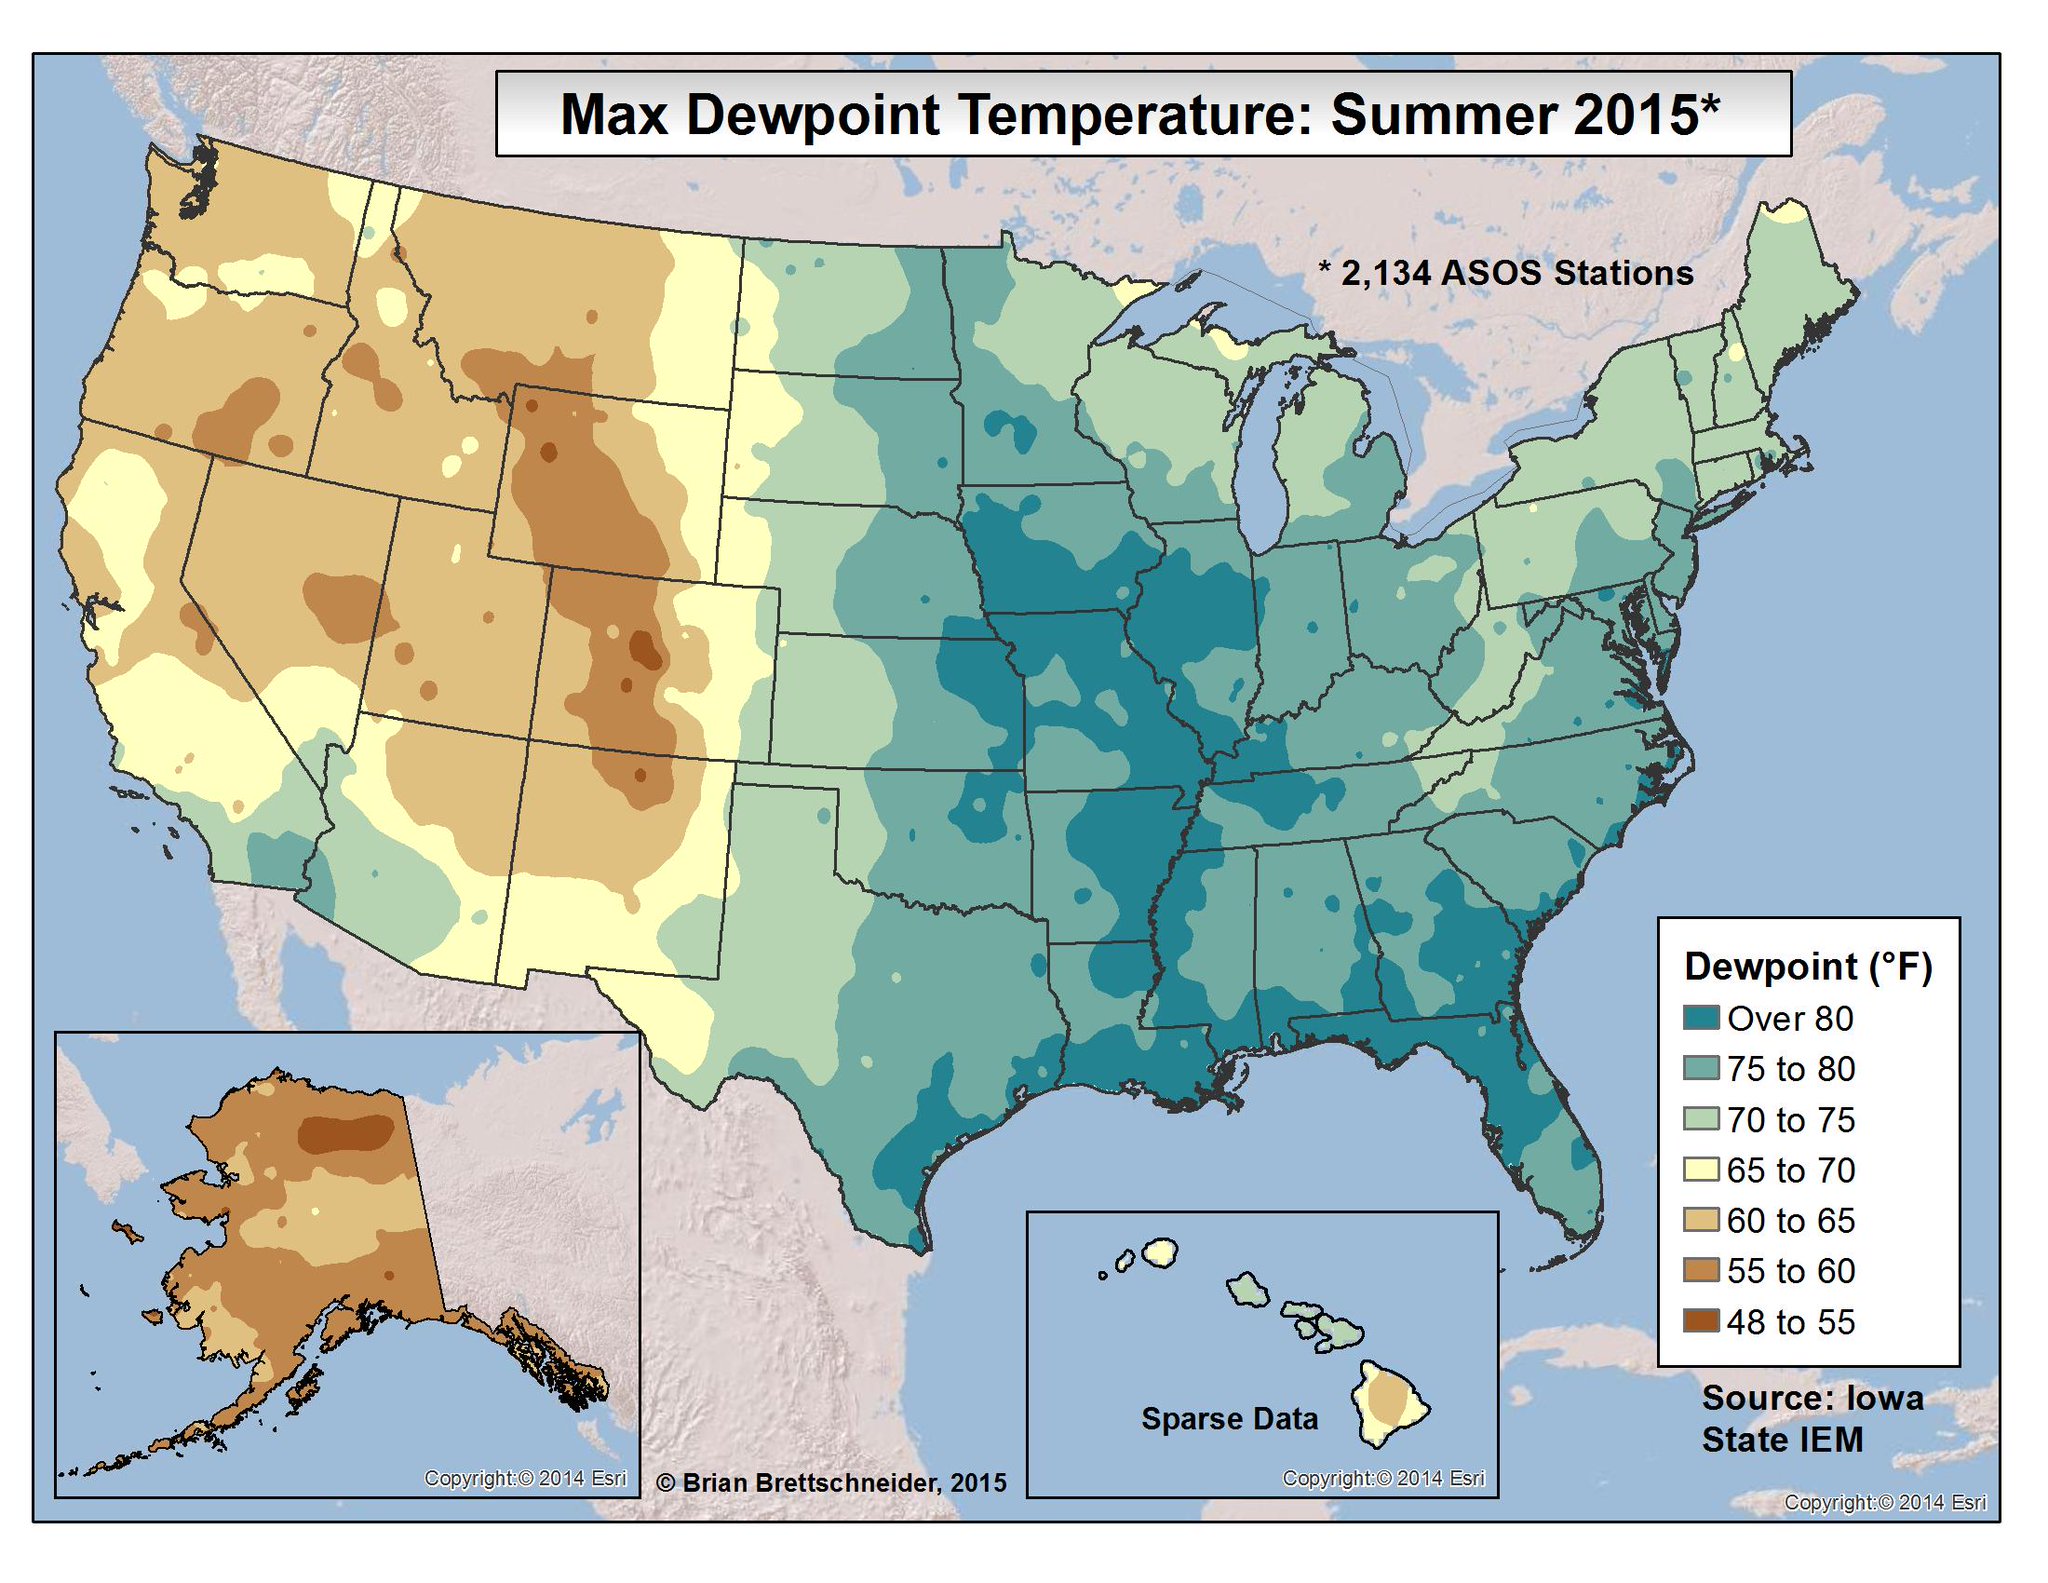
The international airports in Charleston, Savannah, New Orleans, Memphis did not report an 80+ dewpoint this summer. That shading seems unrealistically broad.
The international airports in Charleston, Savannah, New Orleans, Memphis did not report an 80+ dewpoint this summer. That shading seems unrealistically broad.
Quick check I see Savannah got to 79F 7/21/15 so maybe they did hit 80 with another source?
And yeah, its hard to color a map when we dont have enough data to plot..especially if you dont know the area.
I'd love to live in the 5000+ zone, which probably exists somewhere in Siberia (maybe). I think (based on the video below) that Islip got around 1000 this season, which is better than the 1980-2014 average of 300 from that map.
Anyways, I was curious as to how it's calculated. It's explained in the video below, but the point system seems kind of arbitrary. It's mainly based on max temp, min temp, snow fall, and snow depth for each day. Too lazy to watch entire thing.
At 9:05 is the chart/explanation of point gathering:
Interesting. Thanks! I will take a look tomorrow as I was curious myself
Wow to that video!! Nice find! I need to find time to watch it all. Damn. And yeah, our previous winter was definitely more severe than normal..in fact near extreme but in comparison it was like northern New England. Which I can get used to. lol
Wow to that video!! Nice find! I need to find time to watch it all. Damn. And yeah, our previous winter was definitely more severe than normal..in fact near extreme but in comparison it was like northern New England. Which I can get used to. lol
Here's the same average map but shaded.
Does he have the Summer severity index?
Please register to post and access all features of our very popular forum. It is free and quick. Over $68,000 in prizes has already been given out to active posters on our forum. Additional giveaways are planned.
Detailed information about all U.S. cities, counties, and zip codes on our site: City-data.com.

 Please register to participate in our discussions with 2 million other members - it's free and quick! Some forums can only be seen by registered members. After you create your account, you'll be able to customize options and access all our 15,000 new posts/day with fewer ads.


")


