Abbeville, SC (South Carolina) Houses and Residents
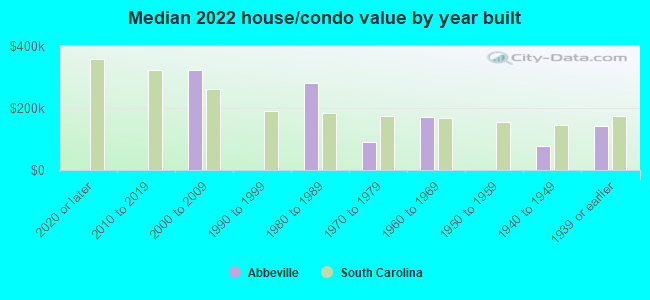
| Abbeville: | $129,420 |
| South Carolina: | $254,600 |
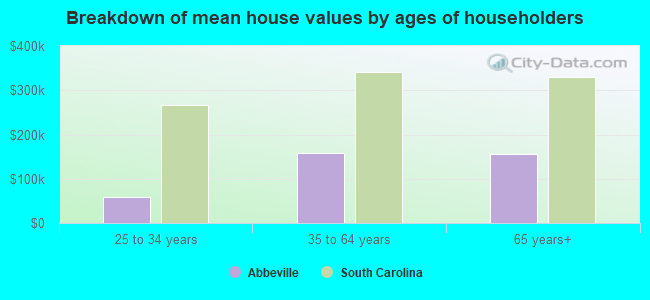
Mean price in 2022:
Detached houses: $186,361
Here: $186,361 State: $368,255 Mobile homes: $20,427
Here: $20,427 State: $102,531
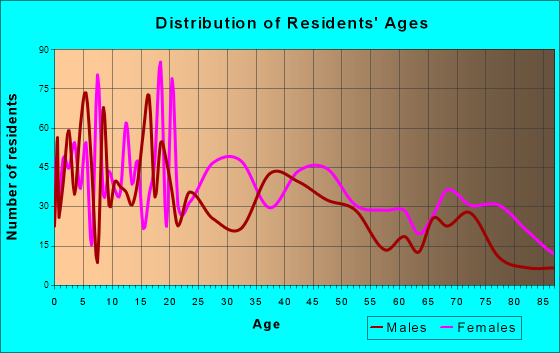
Total population: 5,191 (All urban)
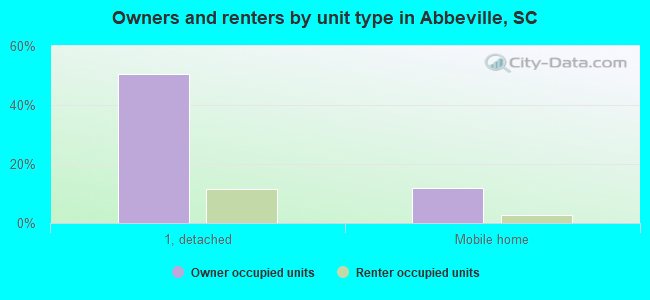
Houses: 2,337 (2,084 occupied: 1,034 owner occupied, 1,090 renter occupied)
| % of renters here: | 51% |
| State: | 28% |
Housing density: 398 houses/condos per square mile
Median price asked for vacant for-sale houses and condos in 2022 in this county: $110,686.
Median contract rent in 2022: $485 (lower quartile is $362, upper quartile is $648)
Median rent asked for vacant for-rent units in 2022: $426
Median gross rent in Abbeville, SC in 2022: $815
Housing units in Abbeville with a mortgage: 392 (0 second mortgage, 0 home equity loan, 0 both second mortgage and home equity loan)
Houses without a mortgage: 0
Median household income for houses/condos with a mortgage: $69,871
Median household income for apartments without a mortgage: $50,176
Median monthly housing costs: $749
Compare current foreclosures near Abbeville, SC:
| Photo | Address | Area | Beds / Baths | Price | Details |
|---|---|---|---|---|---|

|
#1
Mcgowan Ave
Abbeville, SC 29620
|
1,040 sq. feet
|
1 baths 2 beds |
show details | |

|
#2
Carwellyn Rd Apt 5c
Abbeville, SC 29620
|
- sq. feet
|
- baths - beds |
show details | |

|
#3
Highway 28 S
Abbeville, SC 29620
|
- sq. feet
|
- baths - beds |
show details | |

|
#4
Grey Rock Est
Abbeville, SC 29620
|
- sq. feet
|
- baths - beds |
show details | |

|
#5
Crooks Rd
Abbeville, SC 29620
|
- sq. feet
|
- baths - beds |
show details | |

|
#6
Grey Rock Est
Abbeville, SC 29620
|
- sq. feet
|
- baths - beds |
show details | |

|
#7
Centipede Ct
Greenwood, SC 29649
|
3,300 sq. feet
|
2 baths 3 beds |
show details | |

|
#8
Cothran Ave
Greenwood, SC 29649
|
1,906 sq. feet
|
2 baths 3 beds |
show details | |

|
#9
Laurel Ridge Pl
Greenwood, SC 29649
|
1,374 sq. feet
|
2 baths 3 beds |
show details | |

|
#10
Smith Street Ext
Ware Shoals, SC 29692
|
2,322 sq. feet
|
2 baths 3 beds |
show details |
| Photo | Address | Area | Beds / Baths | Price | Details |
|---|---|---|---|---|---|

|
#11
Deerfield Dr
Honea Path, SC 29654
|
1,794 sq. feet
|
1 baths 3 beds |
show details | |

|
#12
Piedmont Ave
Greenwood, SC 29646
|
1,334 sq. feet
|
1 baths 2 beds |
show details | |

|
#13
Lowe Ave
Greenwood, SC 29646
|
1,249 sq. feet
|
2 baths 3 beds |
show details | |

|
#14
Highland Forest Dr
Greenwood, SC 29646
|
1,160 sq. feet
|
2 baths 3 beds |
show details | |

|
#15
Audubon Rd
Ware Shoals, SC 29692
|
1,106 sq. feet
|
- baths - beds |
show details | |

|
#16
New Market St
Greenwood, SC 29646
|
- sq. feet
|
- baths - beds |
show details | |

|
#17
Hospital St S # A
Greenwood, SC 29646
|
- sq. feet
|
- baths - beds |
show details | |

|
#18
Highway 25 N
Hodges, SC 29653
|
- sq. feet
|
- baths - beds |
show details | |

|
#19
Main St S
Greenwood, SC 29646
|
1,240 sq. feet
|
- baths - beds |
show details | |

|
#20
Joe Louis Blvd
Greenwood, SC 29646
|
1,928 sq. feet
|
- baths - beds |
show details |
| Photo | Address | Area | Beds / Baths | Price | Details |
|---|---|---|---|---|---|

|
#21
Ashcroft Dr
Greenwood, SC 29646
|
1,092 sq. feet
|
- baths - beds |
show details | |

|
#22
Alabama Ave
Greenwood, SC 29646
|
1,202 sq. feet
|
- baths - beds |
show details | |

|
#23
Lincoln Ave
Greenwood, SC 29646
|
1,524 sq. feet
|
- baths - beds |
show details | |

|
#24
County Farm Rd Lot 5
Greenwood, SC 29646
|
- sq. feet
|
- baths - beds |
show details | |

|
#25
Ridgemont Dr
Greenwood, SC 29649
|
1,329 sq. feet
|
- baths - beds |
show details | |

|
#26
Old Laurens Rd
Greenwood, SC 29649
|
2,412 sq. feet
|
- baths - beds |
show details | |

|
#27
Old Laurens Rd
Greenwood, SC 29649
|
1,498 sq. feet
|
- baths - beds |
show details | |

|
#28
Beechwood Cir
Greenwood, SC 29646
|
- sq. feet
|
- baths - beds |
show details | |

|
#29
Frances St
Greenwood, SC 29646
|
- sq. feet
|
- baths - beds |
show details | |

|
#30
Milford Springs Rd
Greenwood, SC 29649
|
- sq. feet
|
- baths - beds |
show details |
| Photo | Address | Area | Beds / Baths | Price | Details |
|---|---|---|---|---|---|

|
#31
Spring Valley Rd
Greenwood, SC 29649
|
700 sq. feet
|
- baths - beds |
show details | |

|
#32
Weldon Ave
Greenwood, SC 29646
|
1,073 sq. feet
|
- baths - beds |
show details | |

|
#33
Gregg Ct
Hodges, SC 29653
|
1,092 sq. feet
|
- baths - beds |
show details | |

|
#34
Boulware Dr
Bradley, SC 29819
|
1,208 sq. feet
|
- baths - beds |
show details | |

|
#35
Thompson Dr
Greenwood, SC 29646
|
1,476 sq. feet
|
- baths - beds |
show details | |

|
#36
Salak Rd
Greenwood, SC 29646
|
1,680 sq. feet
|
- baths - beds |
show details | |

|
#37
Westbrook Dr Apt 1c
Greenwood, SC 29649
|
- sq. feet
|
- baths - beds |
show details | |

|
#38
Carlton St
Greenwood, SC 29649
|
1,682 sq. feet
|
- baths - beds |
show details | |

|
#39
Lake Forest Rd
Greenwood, SC 29649
|
1,809 sq. feet
|
- baths - beds |
show details | |

|
#40
Belcher Rd
Calhoun Falls, SC 29628
|
- sq. feet
|
- baths - beds |
show details |
| Photo | Address | Area | Beds / Baths | Price | Details |
|---|---|---|---|---|---|

|
#41
Lowell Ave
Greenwood, SC 29646
|
1,230 sq. feet
|
- baths - beds |
show details | |

|
#42
Marion Ave
Greenwood, SC 29646
|
988 sq. feet
|
- baths - beds |
show details | |

|
#43
Grace St
Greenwood, SC 29649
|
- sq. feet
|
- baths - beds |
show details | |

|
#44
Sally White Rd
Hodges, SC 29653
|
- sq. feet
|
- baths - beds |
show details | |

|
#45
Rumford Ct
Greenwood, SC 29649
|
2,096 sq. feet
|
- baths - beds |
show details | |

|
#46
Coates Ln
Hodges, SC 29653
|
2,071 sq. feet
|
- baths - beds |
show details | |

|
#47
Colonial Dr
Greenwood, SC 29649
|
- sq. feet
|
- baths - beds |
show details | |

|
#48
Reynolds Ave
Greenwood, SC 29649
|
1,219 sq. feet
|
- baths - beds |
show details | |

|
#49
Phoenix St
Greenwood, SC 29646
|
- sq. feet
|
- baths - beds |
show details | |

|
Check over 1 million property listings on Foreclosure.com!
|
browse all offers | |||

Latest news about housing in Abbeville, SC collected exclusively by city-data.com from local newspapers, TV, and radio stations

 | Recently Closed Businesses in the Greenville-Spartanburg Area - Post Them Here. (4084 replies) |
| Charleston is old and busted. Greenville is the new hotness. (717 replies) |
| Empty nesters looking for small town SC charm (23 replies) |
| McCormick Details / Info / Thoughts & more (44 replies) |
| The Vista and 5 Points (3452 replies) |
| New retail/restaurant thread, Part 2, 1/1/2020 through xxxxx. (1974 replies) |
Median year apartment built: 1973
Household type by relationship:
Households: 5,025- Male householders: 984 (410 living alone), Female householders: 1,083 (384 living alone)
518 spouses (518 opposite-sex spouses), 187 unmarried partners, (187 opposite-sex unmarried partners), 1,344 children (1,276 natural, 0 adopted, 67 stepchildren), 366 grandchildren, 32 brothers or sisters, 67 parents, 0 foster children, 269 other relatives, 39 non-relatives
- In group quarters: 130
Size of family households: 663 2-persons, 132 3-persons, 144 4-persons, 82 5-persons, 88 7-or-more-persons.
Size of nonfamily households: 808 1-person, 219 2-persons.
358 married couples with children.
538 single-parent households (37 men, 501 women).
99.5% of residents of Abbeville speak English at home.
0.6% of residents speak Spanish at home (100% speak English very well).
Foreign born population: 99 (2.0%)
(108.1% of them are naturalized citizens)
| Here: | 6.1 |
| State: | 6.4 |
| Here: | 4.0 |
| State: | 4.5 |
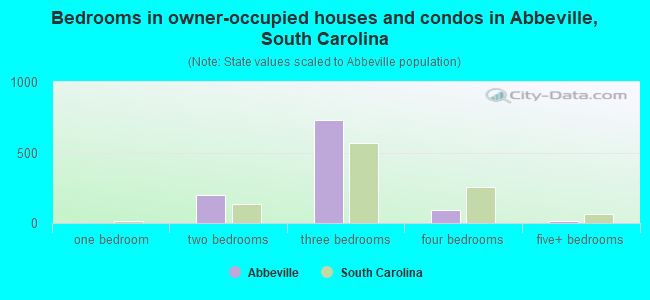
- Bedrooms in owner-occupied houses and condos in Abbeville, South Carolina
- 0no bedroom
- 01 bedroom
- 2012 bedrooms
- 7313 bedrooms
- 924 bedrooms
- 125+ bedrooms
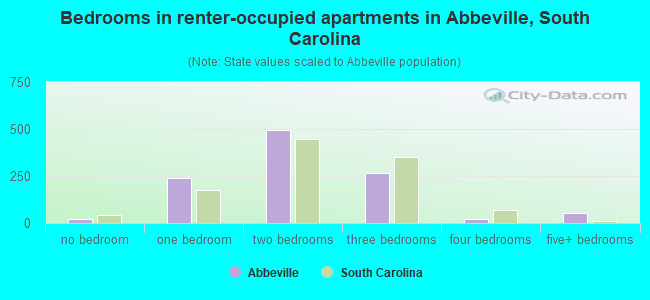
- Bedrooms in renter-occupied apartments in Abbeville, South Carolina
- 19no bedroom
- 2371 bedroom
- 4932 bedrooms
- 2683 bedrooms
- 204 bedrooms
- 545+ bedrooms
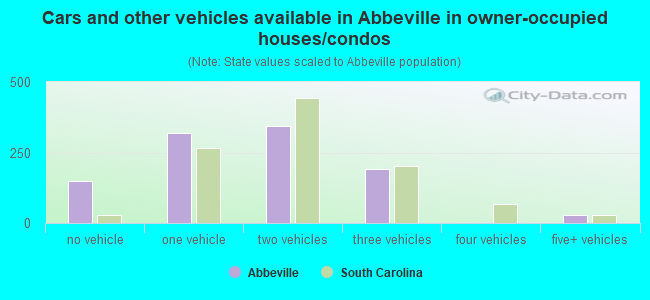
- Cars and other vehicles available in Abbeville in owner-occupied houses/condos
- 150no vehicle
- 3191 vehicle
- 3452 vehicles
- 1923 vehicles
- 04 vehicles
- 295+ vehicles
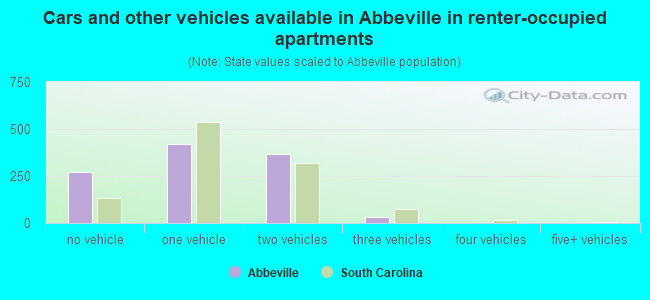
- Cars and other vehicles available in Abbeville in renter-occupied apartments
- 271no vehicle
- 4211 vehicle
- 3682 vehicles
- 303 vehicles
- 04 vehicles
- 05+ vehicles
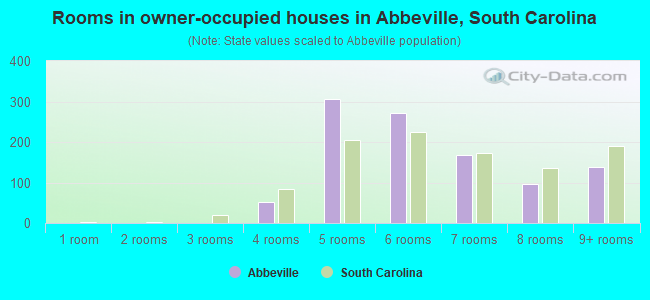
- Rooms in owner-occupied houses in Abbeville, South Carolina
- 01 room
- 02 rooms
- 03 rooms
- 524 rooms
- 3065 rooms
- 2716 rooms
- 1697 rooms
- 978 rooms
- 1399+ rooms
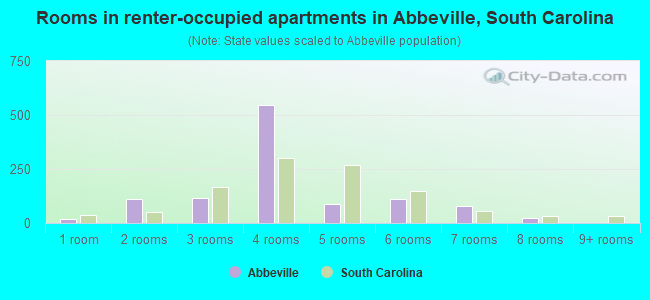
- Rooms in renter-occupied apartments in Abbeville, South Carolina
- 191 room
- 1132 rooms
- 1153 rooms
- 5444 rooms
- 905 rooms
- 1106 rooms
- 797 rooms
- 218 rooms
- 09+ rooms
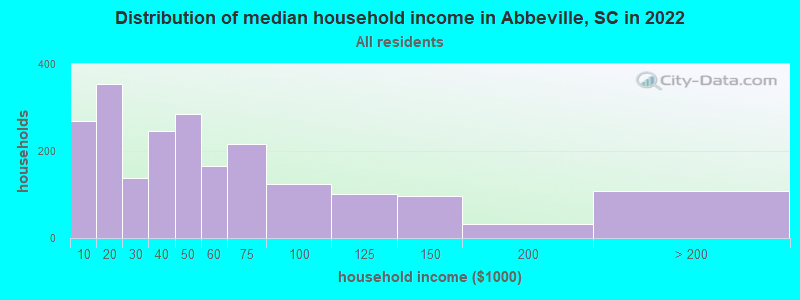
Abbeville, SC household income distribution

- 268Less than $10,000
- 355$10,000 to $19,999
- 137$20,000 to $29,999
- 247$30,000 to $39,999
- 286$40,000 to $49,999
- 165$50,000 to $59,999
- 215$60,000 to $74,999
- 123$75,000 to $99,999
- 101$100,000 to $124,999
- 96$125,000 to $149,999
- 32$150,000 to $199,999
- 107$200,000 or more
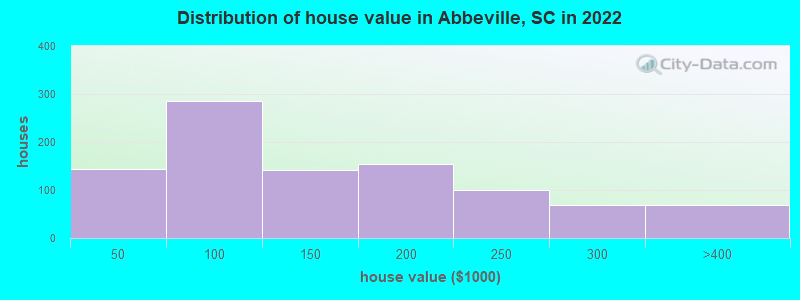
Home value of owner - occupied houses in 2022 in Abbeville, SC
-
- 46Less than $10,000
- 18$30,000 to $34,999
- 38$35,000 to $39,999
- 40$40,000 to $49,999
- 28$50,000 to $59,999
- 55$60,000 to $69,999
- 56$70,000 to $79,999
- 83$80,000 to $89,999
- 21$90,000 to $99,999
- 131$100,000 to $124,999
- 9$125,000 to $149,999
- 65$150,000 to $174,999
- 89$175,000 to $199,999
- 99$200,000 to $249,999
- 69$250,000 to $299,999
- 68$300,000 to $399,999
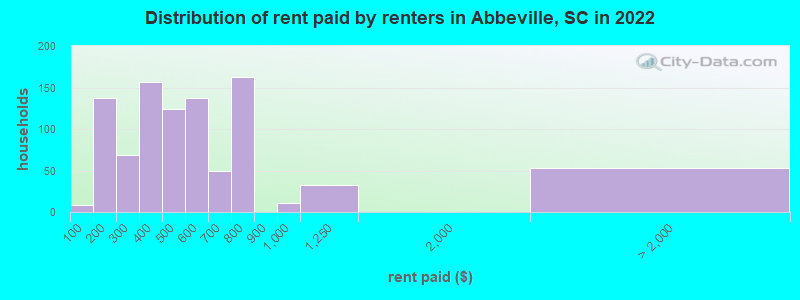
Rent paid by renters in 2022 in Abbeville, SC
-
- 7Less than $100
- 137$100 to $149
- 52$200 to $249
- 16$250 to $299
- 19$300 to $349
- 137$350 to $399
- 63$400 to $449
- 60$450 to $499
- 36$500 to $549
- 100$550 to $599
- 18$600 to $649
- 32$650 to $699
- 57$700 to $749
- 105$750 to $799
- 11$900 to $999
- 31$1,000 to $1,249
- 52No cash rent
Percentage of workers working in this county: 55.7%
Number of people working at home: 190 (10.3% of all workers)
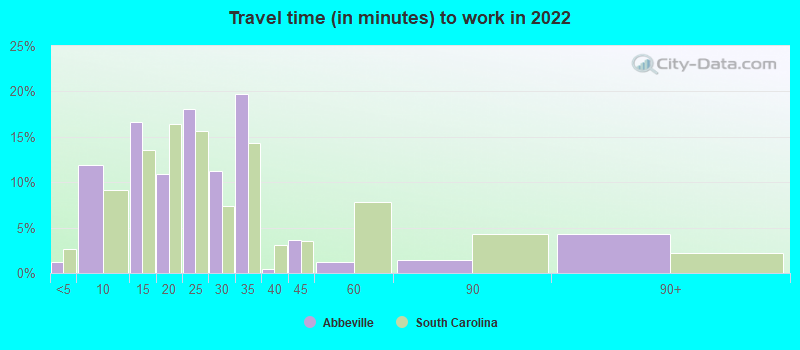
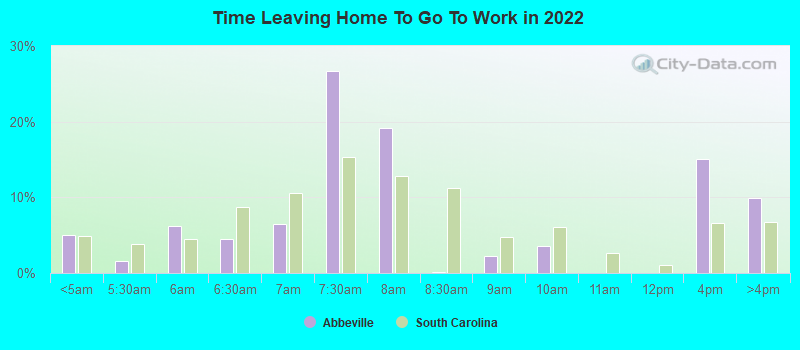
Travel time to work (commute)
- Less than 5 minutes: 36
- 5 to 9 minutes: 244
- 10 to 14 minutes: 313
- 15 to 19 minutes: 295
- 20 to 24 minutes: 119
- 25 to 29 minutes: 99
- 30 to 34 minutes: 123
- 35 to 39 minutes: 43
- 40 to 44 minutes: 48
- 45 to 59 minutes: 163
- 60 to 89 minutes: 90
- 90 or more minutes: 67
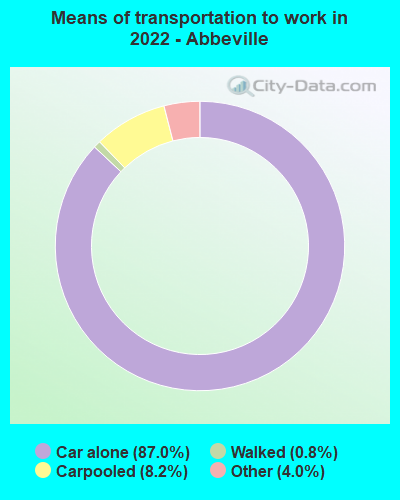
Means of transportation to work:
- Drove a car alone: 1,751 (78.4%)
- Carpooled: 173 (7.7%)
- Taxi: 90 (4.0%)
- Walked: 14 (0.6%)
- Worked at home: 190 (8.5%)
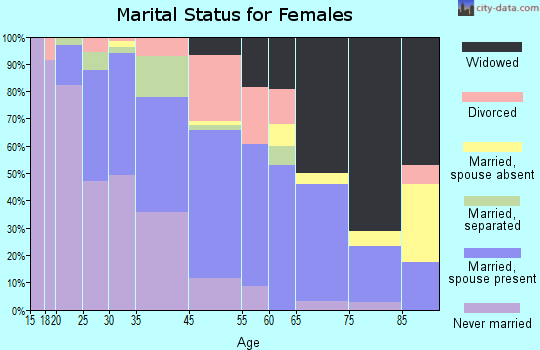
- Unemployment by race in 2022
- Unemployment rate for White non-Hispanic residents
- 18.0%Females
- Unemployment rate for Black residents
- 3.5%Females
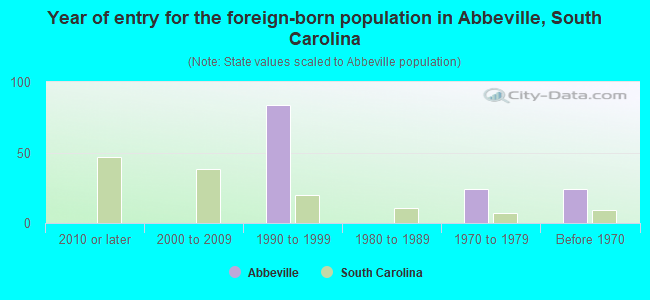
- Year of entry for the foreign-born population in Abbeville, South Carolina
- 02010 or later
- 02000 to 2009
- 841990 to 1999
- 01980 to 1989
- 241970 to 1979
- 24Before 1970
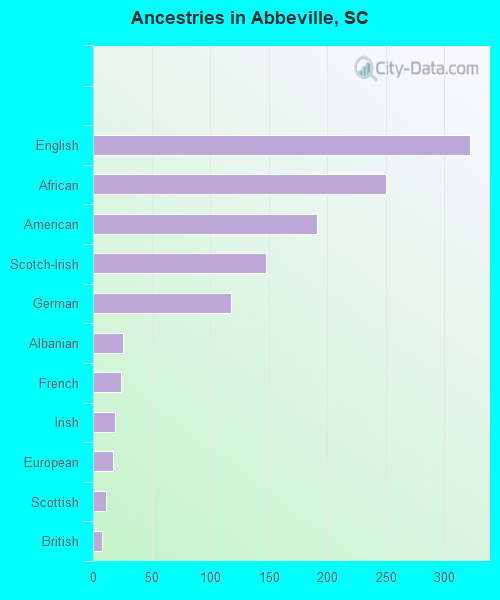
First ancestries reported:
- English: 322 (14.8%)
- African: 250 (11.5%)
- American: 191 (8.8%)
- Scotch-Irish: 148 (6.8%)
- German: 118 (5.4%)
- Albanian: 26 (1.2%)
- French: 24 (1.1%)
- Irish: 19 (0.9%)
- European: 17 (0.8%)
- Scottish: 11 (0.5%)
- British: 8 (0.4%)
- Polish: 2 (0.09%)
Most common places of birth for foreign-born residents (%):
| Abbeville: | 71.7% (71) |
| South Carolina: | 22.5% (60,774) |
| Abbeville: | 32.3% (32) |
| South Carolina: | 0.2% (495) |
Place of birth for U.S.-born residents:
- This state: 4,040
- Other state: 801
- Northeast: 160
- Midwest: 150
- South: 427
- West: 61
92.1% of Abbeville residents lived in the same house 1 years ago.
Out of people who lived in different houses, 21.4% lived in this county.
Out of people who lived in different counties, 93.2% lived in South Carolina.
| Abbeville: | 92.1% |
| State average: | 86.5% |
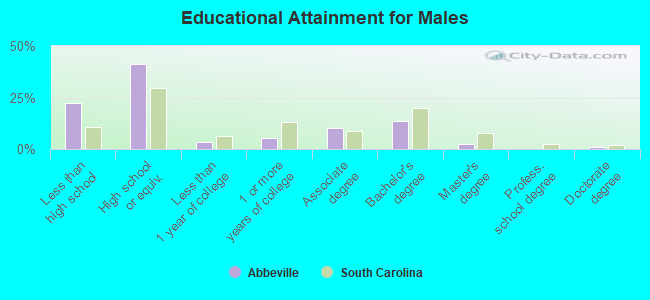
Education attainment for males 25 years and older:
- No schooling: 15
- Nursery to 4th grade: 0
- 5th and 6th grade: 43
- 7th and 8th grade: 54
- 9th grade: 0
- 10th grade: 110
- 11th grade: 107
- 12th grade, no diploma: 32
- High school graduate (or equivalency): 667
- Less than 1 year of college: 54
- Some college more than 1 year, no degree: 87
- Associate degree: 168
- Bachelor's degree: 223
- Master's degree: 43
- Professional school degree: 0
- Doctorate degree: 19
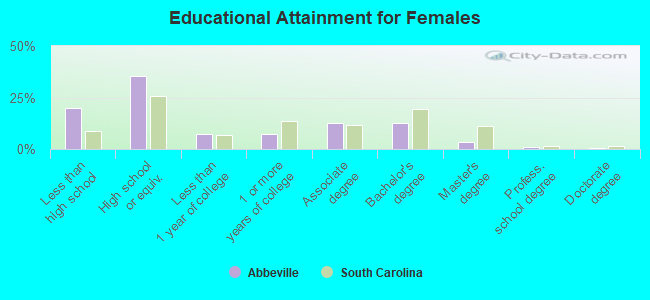
Education attainment for females 25 years and older:
- No schooling: 0
- Nursery to 4th grade: 9
- 5th and 6th grade: 0
- 7th and 8th grade: 59
- 9th grade: 0
- 10th grade: 171
- 11th grade: 87
- 12th grade, no diploma: 26
- High school graduate (or equivalency): 628
- Less than 1 year of college: 127
- Some college more than 1 year, no degree: 125
- Associate degree: 226
- Bachelor's degree: 228
- Master's degree: 62
- Professional school degree: 15
- Doctorate degree: 12
Housing units in structures:
- One, detached: 1,458
- Two: 101
- 3 or 4: 276
- 5 to 9: 220
- 20 to 49: 32
- Mobile homes: 248
Median worth of mobile homes: $39,321
Housing units lacking complete kitchen facilities in 2022: 4.9%
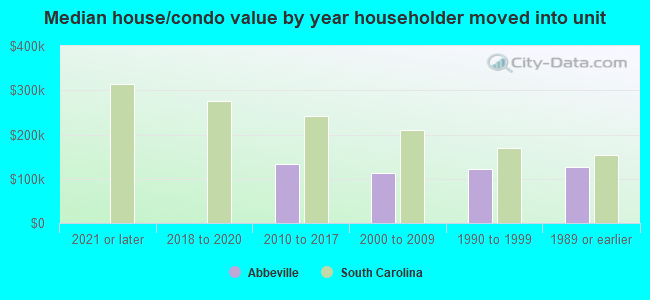
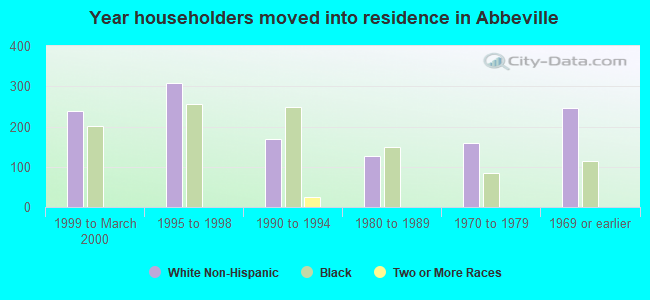
House/condo owner moved in on average 17 years ago
Renter moved in on average 4 years ago
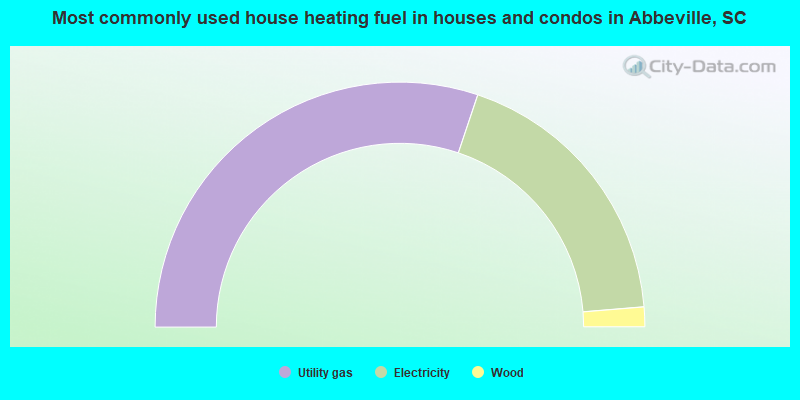
- 60.3%Utility gas
- 37.1%Electricity
- 2.6%Wood
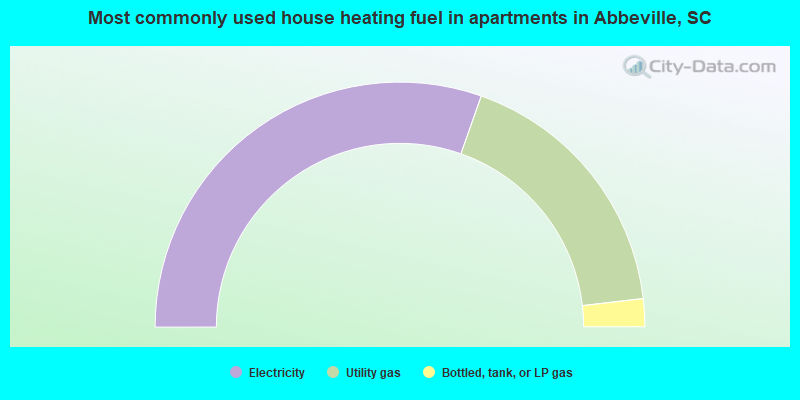
- 60.8%Electricity
- 35.5%Utility gas
- 3.7%Bottled, tank, or LP gas
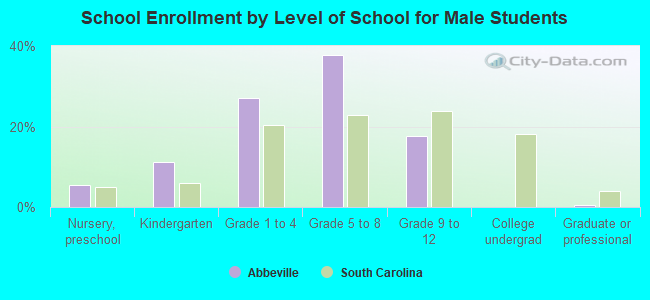
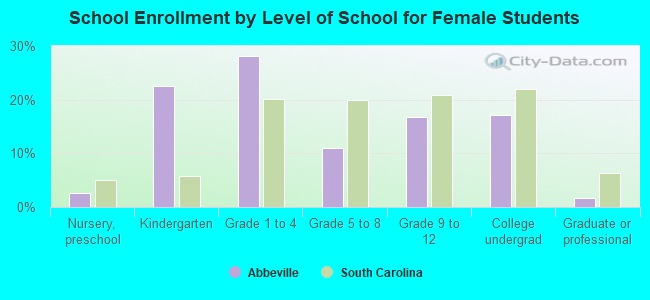
Private vs. public school enrollment:
| Here: | 15.2% |
| South Carolina: | 14.4% |
| Here: | 34.4% |
| South Carolina: | 11.1% |
| Here: | 0.0% |
| South Carolina: | 21.9% |