Arivaca, AZ (Arizona) Houses and Residents
Estimated median house or condo value in 2022: $286,721 (it was $92,800 in 2000 )
Arivaca:
$286,721Arizona:
$402,800
Lower value quartile - upper value quartile: $199,395 - $401,769Total population: 59,243 (Urban population: 35,685 (17,579 inside urbanized areas, 18,106 inside urban clusters ), Rural population: 14,738 (281 farm, 14,457 nonfarm ))
Houses: 24,473 (20,230 occupied: 17,425 owner occupied, 2,805 renter occupied )
% of renters here:
14%State:
33%
Housing density: 19 houses/condos per square mile
Median price asked for vacant for-sale houses and condos in 2022 in this county: $287,979.
Median contract rent in 2022: $947 (lower quartile is $679, upper quartile is $1,396)
Median rent asked for vacant for-rent units in 2022: $1,358
Median gross rent in Arivaca, AZ in 2022: $1,187
Housing units in Arivaca with a mortgage: 6,694 (561 second mortgage, 670 home equity loan, 9 both second mortgage and home equity loan )Houses without a mortgage: 6,396
Data:
Median house or condo value ($)
Median house or condo value ($ change since 2000)
Median house or condo value ($) - White
Median house or condo value ($) - Black or African American
Median house or condo value ($) - Asian
Median house or condo value ($) - Hispanic or Latino
Median house or condo value ($) - American Indian and Alaska Native
Median house or condo value ($) - Multirace
Median house or condo value ($) - Other Race
Median price asked for mobile homes ($)
Household density (households per square mile)
Mean house or condo value by units in structure - 1, detached ($)
Mean house or condo value by units in structure - 1, attached ($)
Mean house or condo value by units in structure - 2 ($)
Mean house or condo value by units in structure by units in structure - 3 or 4 ($)
Mean house or condo value by units in structure - 5 or more ($)
Mean house or condo value by units in structure - Boat, RV, van, etc. ($)
Mean house or condo value by units in structure - Mobile home ($)
Median contract rent ($)
Median contract rent - Lower quartile ($)
Median contract rent - Upper quartile ($)
Median gross rent ($)
Urban houses (%)
Rural houses (%)
Houses occupied (%)
Houses occupied (% change since 2000)
Houses owner occupied (%)
Houses owner occupied (% change since 2000)
Houses renter occupied (%)
Houses renter occupied (% change since 2000)
Vacant housing units - For rent (%)
Vacant housing units - For rent (% change since 2000)
Vacant housing units - For sale only (%)
Vacant housing units - For sale only (% change since 2000)
Vacant housing units - Rented or sold, not occupied (%)
Vacant housing units - Rented or sold, not occupied (% change since 2000)
Vacant housing units - For seasonal, recreational, or occasional use (%)
Vacant housing units - For seasonal, recreational, or occasional use (% change since 2000)
Vacant housing units - For migrant workers (%)
Vacant housing units - For migrant workers (% change since 2000)
Vacant housing units - Other vacant (%)
Vacant housing units - Other vacant (% change since 2000)
Median monthly housing costs ($)
Median household income for houses/condos with a mortgage ($)
Median household income for houses/condos without a mortgage ($)
Median household income ($)
Median household income ($) - White
Median household income ($) - Black or African American
Median household income ($) - Asian
Median household income ($) - Hispanic or Latino
Median household income ($) - American Indian and Alaska Native
Median household income ($) - Multirace
Median household income ($) - Other Race
Mortgage status - with mortgage (%)
Mortgage status - with second mortgage (%)
Mortgage status - with home equity loan (%)
Mortgage status - with both second mortgage and home equity loan (%)
Mortgage status - without a mortgage (%)
Median year house/condo built
Median year apartment built
Household type by relationship - Male householder living alone (%)
Household type by relationship - Male householder not living alone (%)
Household type by relationship - Female householder living alone (%)
Household type by relationship - Female householder not living alone (%)
Household type by relationship - Opposite-Sex spouse (%)
Household type by relationship - Same-Sex spouse (%)
Household type by relationship - Opposite-Sex unmarried partner (%)
Household type by relationship - Same-Sex unmarried partner (%)
Household type by relationship - In group quarters (%)
Size of family households - 2-person household (%)
Size of family households - 3-person household (%)
Size of family households - 4-person household (%)
Size of family households - 5-person household (%)
Size of family households - 6-person household (%)
Size of family households - 7-or-more-person household (%)
Size of nonfamily households - 1-person household (%)
Size of nonfamily households - 2-person household (%)
Size of nonfamily households - 3-person household (%)
Size of nonfamily households - 4-person household (%)
Size of nonfamily households - 5-person household (%)
Size of nonfamily households - 6-person household (%)
Size of nonfamily households - 7-or-moreperson household (%)
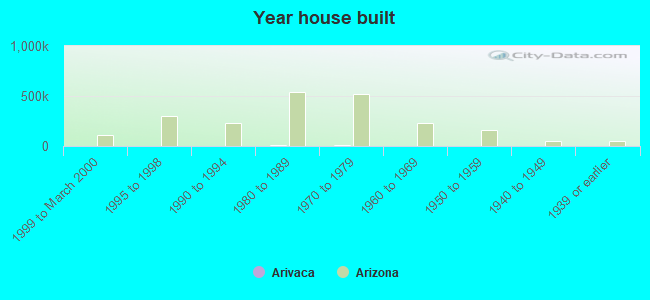
Year house built - Built 2010 or later (%)
Year house built - Built 2000 to 2009 (%)
Year house built - Built 1990 to 1999 (%)
Year house built - Built 1980 to 1989 (%)
Year house built - Built 1970 to 1979 (%)
Year house built - Built 1960 to 1969 (%)
Year house built - Built 1950 to 1959 (%)
Year house built - Built 1940 to 1949 (%)
Year house built - Built 1939 or earlier (%)
Median number of rooms in houses and condos
Median number of rooms in apartments
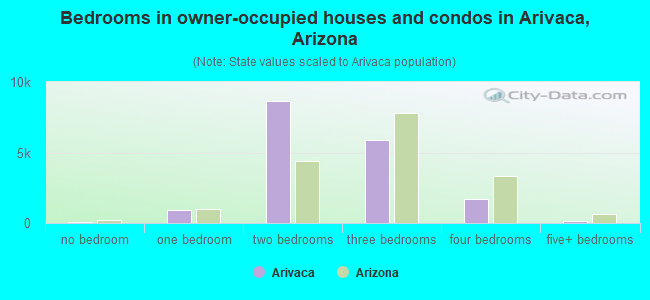
Median number of bedrooms in owner occupied houses
Mean number of bedrooms in owner occupied houses
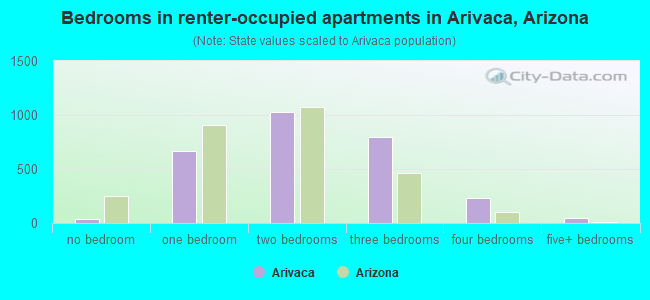
Median number of bedrooms in renter occupied houses
Mean number of bedrooms in renter occupied houses
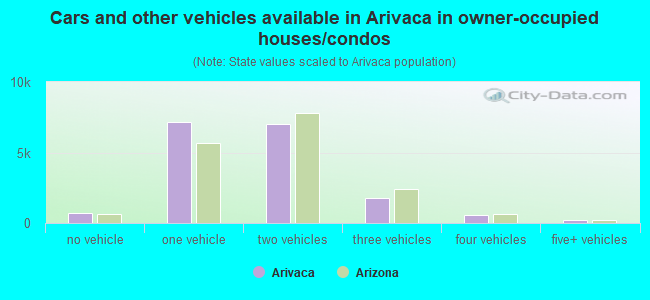
Median number of vehichles in owner occupied houses
Mean number of vehichles in owner occupied houses
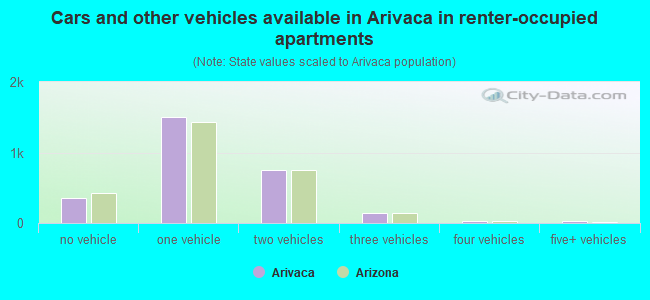
Median number of vehichles in renter occupied houses
Mean number of vehichles in renter occupied houses
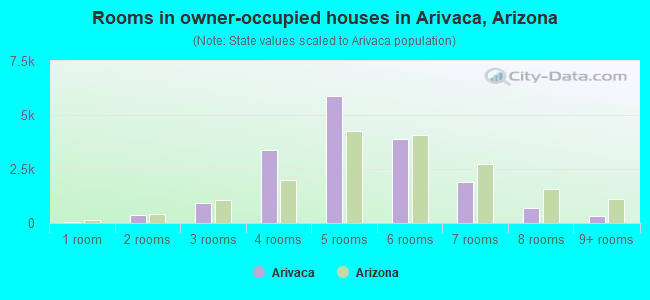
Rooms in owner-occupied houses - 1 room (%)
Rooms in owner-occupied houses - 2 rooms (%)
Rooms in owner-occupied houses - 3 rooms (%)
Rooms in owner-occupied houses - 4 rooms (%)
Rooms in owner-occupied houses - 5 rooms (%)
Rooms in owner-occupied houses - 6 rooms (%)
Rooms in owner-occupied houses - 7 rooms (%)
Rooms in owner-occupied houses - 8 rooms (%)
Rooms in owner-occupied houses - 9+ rooms (%)
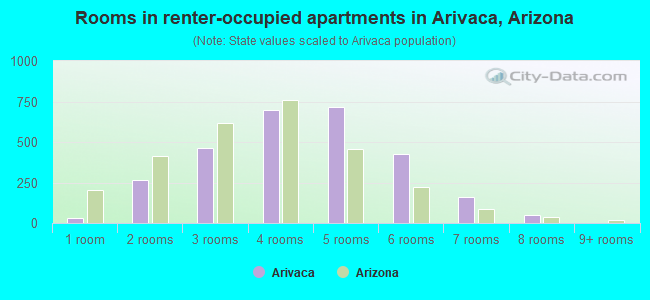
Rooms in renter-occupied houses - 1 room (%)
Rooms in renter-occupied houses - 2 rooms (%)
Rooms in renter-occupied houses - 3 rooms (%)
Rooms in renter-occupied houses - 4 rooms (%)
Rooms in renter-occupied houses - 5 rooms (%)
Rooms in renter-occupied houses - 6 rooms (%)
Rooms in renter-occupied houses - 7 rooms (%)
Rooms in renter-occupied houses - 8 rooms (%)
Rooms in renter-occupied houses - 9+ rooms (%)
Bedrooms in owner-occupied houses - no bedrooms (%)
Bedrooms in owner-occupied houses - 1 bedroom (%)
Bedrooms in owner-occupied houses - 2 bedrooms (%)
Bedrooms in owner-occupied houses - 3 bedrooms (%)
Bedrooms in owner-occupied houses - 4 bedrooms (%)
Bedrooms in owner-occupied houses - 5+ bedrooms (%)
Bedrooms in renter-occupied houses - no bedrooms (%)
Bedrooms in renter-occupied houses - 1 bedroom (%)
Bedrooms in renter-occupied houses - 2 bedrooms (%)
Bedrooms in renter-occupied houses - 3 bedrooms (%)
Bedrooms in renter-occupied houses - 4 bedrooms (%)
Bedrooms in renter-occupied houses - 5+ bedrooms (%)
Vehicles available in owner-occupied houses - no vehicle available (%)
Vehicles available in owner-occupied houses - 1 vehicle available(%)
Vehicles available in owner-occupied houses - 2 Vehicles available (%)
Vehicles available in owner-occupied houses - 3 Vehicles available (%)
Vehicles available in owner-occupied houses - 4 Vehicles available (%)
Vehicles available in owner-occupied houses - 5+ Vehicles available (%)
Vehicles available in renter-occupied houses - no vehicle available (%)
Vehicles available in renter-occupied houses - 1 vehicle available (%)
Vehicles available in renter-occupied houses - 2 Vehicles available (%)
Vehicles available in renter-occupied houses - 3 Vehicles available (%)
Vehicles available in renter-occupied houses - 4 Vehicles available (%)
Vehicles available in renter-occupied houses - 5+ Vehicles available (%)
Housing units in structures - 1, detached (%)
Housing units in structures - 1, attached (%)
Housing units in structures - 2 (%)
Housing units in structures - 3 or 4 (%)
Housing units in structures - 5 to 9 (%)
Housing units in structures - 10 to 19 (%)
Housing units in structures - 20 to 49 (%)
Housing units in structures - 50 or more (%)
Housing units in structures - Mobile home (%)
Housing units in structures - Boat, RV, van, etc. (%)
Housing units in structures - Owners - 1, detached (%)
Housing units in structures - Owners - 1, attached (%)
Housing units in structures - Owners - 2 (%)
Housing units in structures - Owners - 3 or 4 (%)
Housing units in structures - Owners - 5 to 9 (%)
Housing units in structures - Owners - 10 to 19 (%)
Housing units in structures - Owners - 20 to 49 (%)
Housing units in structures - Owners - 50 or more (%)
Housing units in structures - Owners - Mobile home (%)
Housing units in structures - Owners - Boat, RV, van, etc. (%)
Housing units in structures - Renters - 1, detached (%)
Housing units in structures - Renters - 1, attached (%)
Housing units in structures - Renters - 2 (%)
Housing units in structures - Renters - 3 or 4 (%)
Housing units in structures - Renters - 5 to 9 (%)
Housing units in structures - Renters - 10 to 19 (%)
Housing units in structures - Renters - 20 to 49 (%)
Housing units in structures - Renters - 50 or more (%)
Housing units in structures - Renters - Mobile home (%)
Housing units in structures - Renters - Boat, RV, van, etc. (%)
House/condo owner moved in on average (years ago)
Renter moved in on average (years ago)
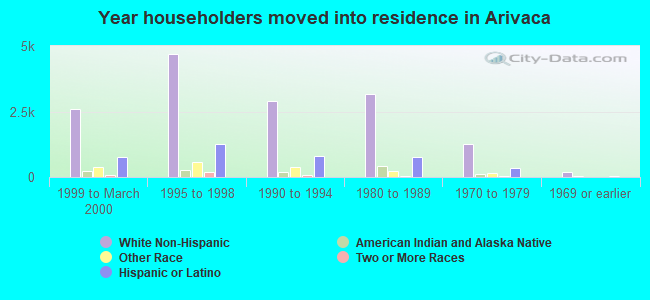
Year householder moved into unit - Moved in 1999 to March 2000 (%)
Year householder moved into unit - Moved in 1999 to March 2000 (%) - White
Year householder moved into unit - Moved in 1999 to March 2000 (%) - Black or African American
Year householder moved into unit - Moved in 1999 to March 2000 (%) - Asian
Year householder moved into unit - Moved in 1999 to March 2000 (%) - Hispanic or Latino
Year householder moved into unit - Moved in 1999 to March 2000 (%) - American Indian and Alaska Native
Year householder moved into unit - Moved in 1999 to March 2000 (%) - Multirace
Year householder moved into unit - Moved in 1999 to March 2000 (%) - Other Race
Year householder moved into unit - Moved in 1995 to 1998 (%)
Year householder moved into unit - Moved in 1995 to 1998 (%) - White
Year householder moved into unit - Moved in 1995 to 1998 (%) - Black or African American
Year householder moved into unit - Moved in 1995 to 1998 (%) - Asian
Year householder moved into unit - Moved in 1995 to 1998 (%) - Hispanic or Latino
Year householder moved into unit - Moved in 1995 to 1998 (%) - American Indian and Alaska Native
Year householder moved into unit - Moved in 1995 to 1998 (%) - Multirace
Year householder moved into unit - Moved in 1995 to 1998 (%) - Other Race
Year householder moved into unit - Moved in 1990 to 1994 (%)
Year householder moved into unit - Moved in 1990 to 1994 (%) - White
Year householder moved into unit - Moved in 1990 to 1994 (%) - Black or African American
Year householder moved into unit - Moved in 1990 to 1994 (%) - Asian
Year householder moved into unit - Moved in 1990 to 1994 (%) - Hispanic or Latino
Year householder moved into unit - Moved in 1990 to 1994 (%) - American Indian and Alaska Native
Year householder moved into unit - Moved in 1990 to 1994 (%) - Multirace
Year householder moved into unit - Moved in 1990 to 1994 (%) - Other Race
Year householder moved into unit - Moved in 1980 to 1989 (%)
Year householder moved into unit - Moved in 1980 to 1989 (%) - White
Year householder moved into unit - Moved in 1980 to 1989 (%) - Black or African American
Year householder moved into unit - Moved in 1980 to 1989 (%) - Asian
Year householder moved into unit - Moved in 1980 to 1989 (%) - Hispanic or Latino
Year householder moved into unit - Moved in 1980 to 1989 (%) - American Indian and Alaska Native
Year householder moved into unit - Moved in 1980 to 1989 (%) - Multirace
Year householder moved into unit - Moved in 1980 to 1989 (%) - Other Race
Year householder moved into unit - Moved in 1970 to 1979 (%)
Year householder moved into unit - Moved in 1970 to 1979 (%) - White
Year householder moved into unit - Moved in 1970 to 1979 (%) - Black or African American
Year householder moved into unit - Moved in 1970 to 1979 (%) - Asian
Year householder moved into unit - Moved in 1970 to 1979 (%) - Hispanic or Latino
Year householder moved into unit - Moved in 1970 to 1979 (%) - American Indian and Alaska Native
Year householder moved into unit - Moved in 1970 to 1979 (%) - Multirace
Year householder moved into unit - Moved in 1970 to 1979 (%) - Other Race
Year householder moved into unit - Moved in 1969 or earlier (%)
Year householder moved into unit - Moved in 1969 or earlier (%) - White
Year householder moved into unit - Moved in 1969 or earlier (%) - Black or African American
Year householder moved into unit - Moved in 1969 or earlier (%) - Asian
Year householder moved into unit - Moved in 1969 or earlier (%) - Hispanic or Latino
Year householder moved into unit - Moved in 1969 or earlier (%) - American Indian and Alaska Native
Year householder moved into unit - Moved in 1969 or earlier (%) - Multirace
Year householder moved into unit - Moved in 1969 or earlier (%) - Other Race
Housing units lacking complete plumbing facilities (%)
Housing units lacking complete kitchen facilities (%)
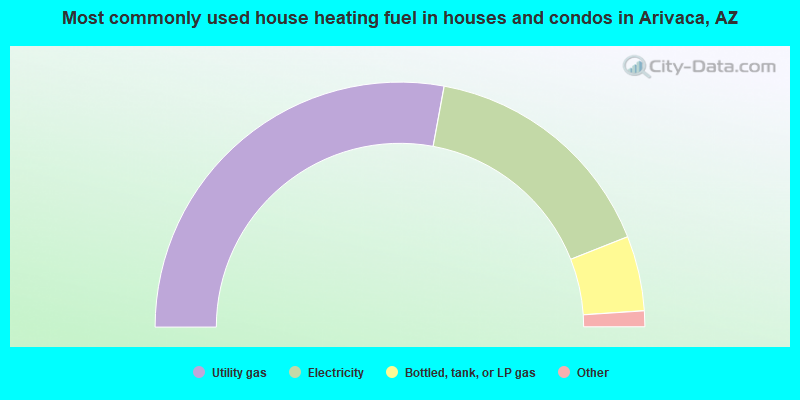
House heating fuel used in houses and condos - Utility gas (%)
House heating fuel used in houses and condos - Bottled, tank, or LP gas (%)
House heating fuel used in houses and condos - Electricity (%)
House heating fuel used in houses and condos - Fuel oil, kerosene, etc. (%)
House heating fuel used in houses and condos - Coal or coke (%)
House heating fuel used in houses and condos - Wood (%)
House heating fuel used in houses and condos - Solar energy (%)
House heating fuel used in houses and condos - Other fuel (%)
House heating fuel used in houses and condos - No fuel used (%)
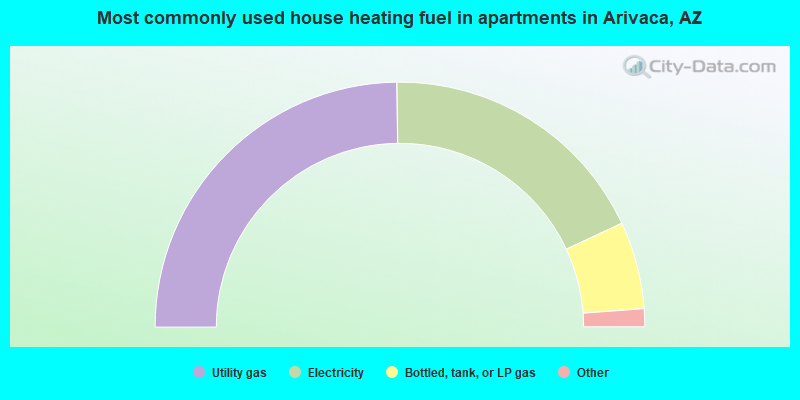
House heating fuel used in apartments - Utility gas (%)
House heating fuel used in apartments - Bottled, tank, or LP gas (%)
House heating fuel used in apartments - Electricity (%)
House heating fuel used in apartments - Fuel oil, kerosene, etc. (%)
House heating fuel used in apartments - Coal or coke (%)
House heating fuel used in apartments - Wood (%)
House heating fuel used in apartments - Solar energy (%)
House heating fuel used in apartments - Other fuel (%)
House heating fuel used in apartments - No fuel used (%)
Household type by relationship:
Households: 956,124
In family households: 768,799 (166,055 male householders , 77,112 female householders )
172,857 spouses , 262,621 children (241,454 natural , 7,750 adopted , 13,417 stepchildren ), 25,096 grandchildren , 10,634 brothers or sisters , 9,582 parents , foster children , 12,552 other relatives , 25,522 non-relatives In nonfamily households: 187,325 (70,125 male householders (52,289 living alone )), 75,368 female householders (61,272 living alone )), 41,832 nonrelatives In group quarters: 24,139 (12,178 institutionalized population)
127,168 married couples with children. single-parent households (13,106 men , 42,204 women ).
70.1% of residents of Arivaca speak English at home. of residents speak Spanish at home (68% speak English very well , 18% speak English well , 10% speak English not well , 4% don't speak English at all ).of residents speak other Indo-European language at home (77% speak English very well , 21% speak English well , 2% speak English not well ).of residents speak Asian or Pacific Island language at home (25% speak English very well , 47% speak English well , 28% speak English not well ).of residents speak other language at home (70% speak English very well , 25% speak English well , 5% speak English not well ).
Foreign born population: 6,196 (9.8%)of them are naturalized citizens )
Median number of rooms in houses and condos:
Median number of rooms in apartments
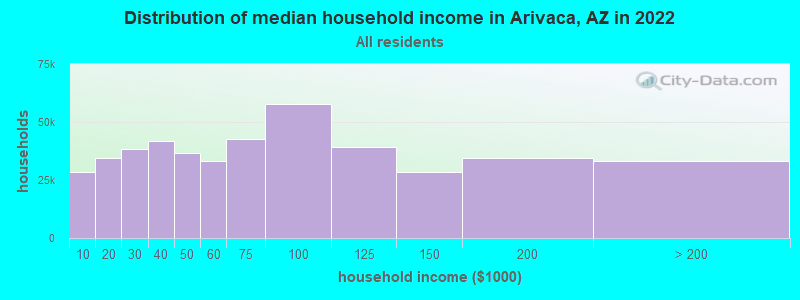
Arivaca, AZ household income distribution 28,287 Less than $10,00034,460 $10,000 to $19,99938,439 $20,000 to $29,99941,845 $30,000 to $39,99936,502 $40,000 to $49,99933,132 $50,000 to $59,99942,716 $60,000 to $74,99957,882 $75,000 to $99,99939,096 $100,000 to $124,99928,565 $125,000 to $149,99934,559 $150,000 to $199,99933,040 $200,000 or more
Percentage of workers working in this county: 93.0%Number of people working at home: 2,895 (14.6% of all workers )
Travel time to work (commute)
Less than 5 minutes: 3435 to 9 minutes: 1,48310 to 14 minutes: 1,53815 to 19 minutes: 1,92620 to 24 minutes: 2,04225 to 29 minutes: 1,12530 to 34 minutes: 2,28235 to 39 minutes: 51440 to 44 minutes: 81145 to 59 minutes: 1,57660 to 89 minutes: 86190 or more minutes: 377
Means of transportation to work:
Drove a car alone: 11,129 (72.0%)Carpooled: 3,141 (20.3%)Bus or trolley bus : 139 (0.9%)Subway or elevated : 7 (0.0%)Railroad : 6 (0.0%)Motorcycle: 49 (0.3%)Bicycle: 21 (0.1%)Walked: 210 (1.4%)Other means: 176 (1.1%)Worked at home: 573 (3.7%)
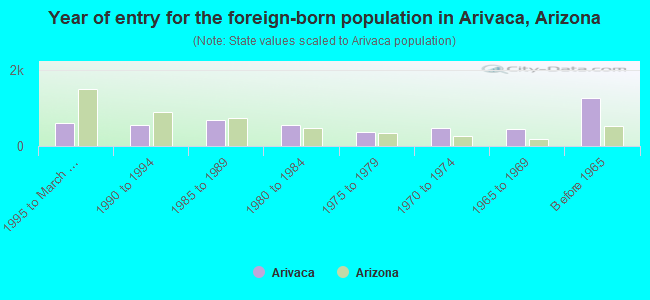
Year of entry for the foreign-born population in Arivaca, Arizona
601 1995 to March 2000 563 1990 to 1994 682 1985 to 1989 561 1980 to 1984 360 1975 to 1979 485 1970 to 1974 443 1965 to 1969 1,265 Before 1965
Most common places of birth for foreign-born residents (%): Mexico Arivaca:
69.3% (3,438)Arizona:
66.4% (436,022)
Canada Arivaca:
5.9% (295)Arizona:
4.0% (26,323)
Germany Arivaca:
5.3% (261)Arizona:
2.4% (15,868)
United Kingdom Arivaca:
2.9% (142)Arizona:
2.2% (14,655)
Korea Arivaca:
1.9% (95)Arizona:
1.2% (8,075)
Other Western Europe Arivaca:
1.6% (78)Arizona:
0.3% (1,928)
Place of birth for U.S.-born residents:
This state: 18,480Other state: 26,515Northeast: 4,747Midwest: 12,049South: 3,909West: 5,810 56% of Arivaca residents lived in the same house 5 years ago.
Out of people who lived in different houses, 50% lived in this county.
Out of people who lived in different counties, 20% lived in Arizona.
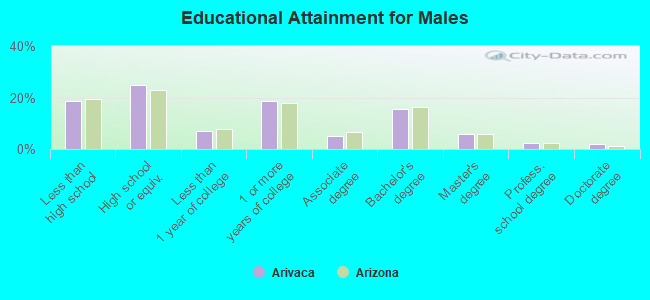
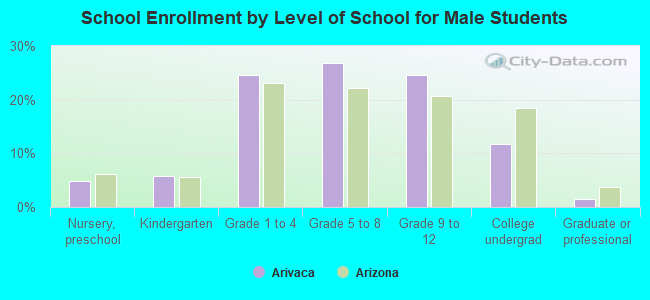
Education attainment for males 25 years and older:
No schooling: 161Nursery to 4th grade: 1375th and 6th grade: 3657th and 8th grade: 5519th grade: 35610th grade: 46811th grade: 48912th grade, no diploma: 587High school graduate (or equivalency): 4,158Less than 1 year of college: 1,161Some college more than 1 year, no degree: 3,092Associate degree: 837Bachelor's degree: 2,613Master's degree: 1,002Professional school degree: 400Doctorate degree: 295
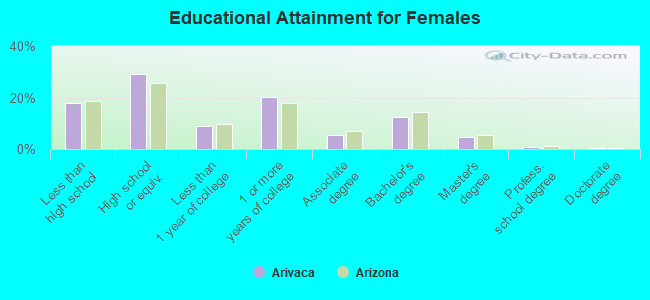
Education attainment for females 25 years and older:
No schooling: 175Nursery to 4th grade: 1445th and 6th grade: 2877th and 8th grade: 6509th grade: 40010th grade: 58511th grade: 49112th grade, no diploma: 715High school graduate (or equivalency): 5,597Less than 1 year of college: 1,730Some college more than 1 year, no degree: 3,874Associate degree: 1,069Bachelor's degree: 2,362Master's degree: 862Professional school degree: 182Doctorate degree: 67
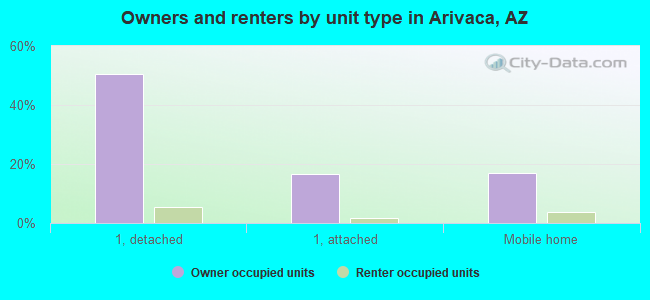
Housing units in structures:
One, detached: 12,741One, attached: 5,548Two: 1163 or 4: 6255 to 9: 11010 to 19: 11320 to 49: 5850 or more: 218Mobile homes: 4,801Boats, RVs, vans, etc.: 143Median worth of mobile homes: $103,495
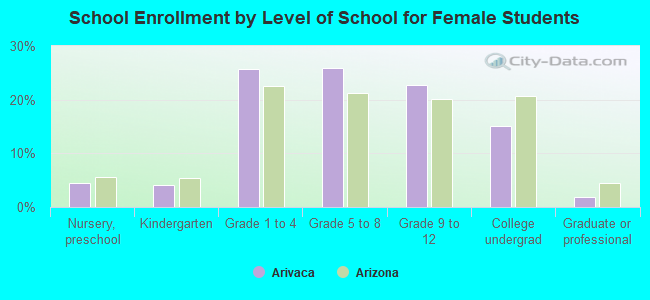
Housing units lacking complete plumbing facilities: 0.9%Housing units lacking complete kitchen facilities: 0.8%Private vs. public school enrollment:
Students in private schools in grades 1 to 8 (elementary and middle school): 397 Students in private schools in grades 9 to 12 (high school): 140 Students in private undergraduate colleges: 163