Housing density: 1,775 houses/condos per square mile
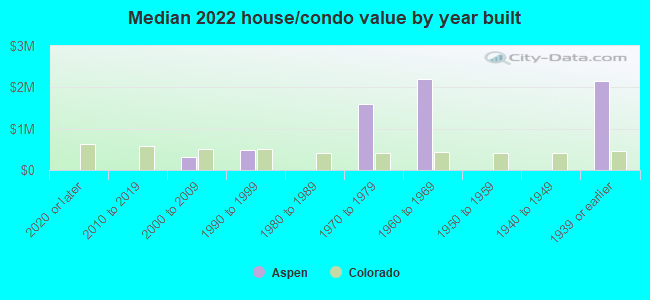
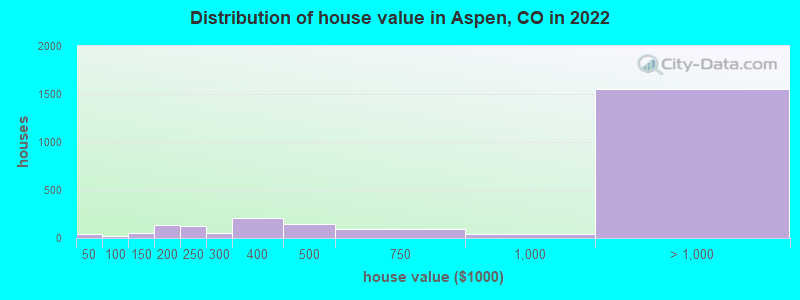
Median price asked for vacant for-sale houses and condos in 2022: $3,187,644.
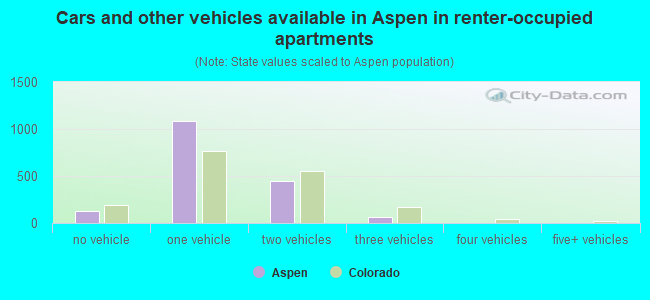
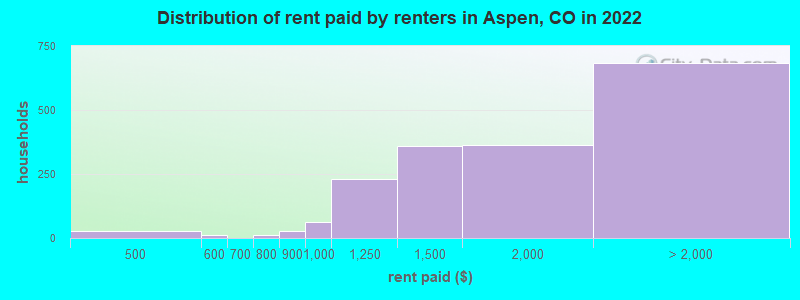
Median contract rent in 2022: $1,559 (lower quartile is $1,277, upper quartile is over $2,000)
Median rent asked for vacant for-rent units in 2022: $2,013
Median gross rent in Aspen, CO in 2022: $1,794
Housing units in Aspen with a mortgage: 1,212 (122 second mortgage, 0 home equity loan, 127 both second mortgage and home equity loan) Houses without a mortgage: 15
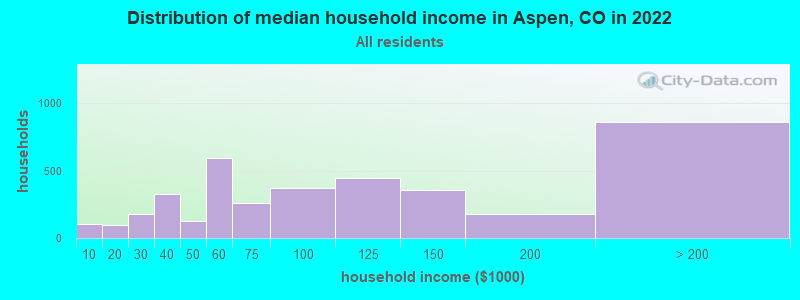
Median household income for houses/condos with a mortgage: $128,011
Median household income for apartments without a mortgage: $103,318
Size of family households: 1,061 2-persons, 275 3-persons, 191 4-persons, 107 5-persons, 13 6-persons.
Size of nonfamily households: 1,806 1-person, 477 2-persons, 36 3-persons.
514 married couples with children.
128 single-parent households (10 men, 118 women).
82.5% of residents of Aspen speak English at home.
9.3% of residents speak Spanish at home (57% speak English very well, 39% speak English well, 4% speak English not well).
7.5% of residents speak other Indo-European language at home (70% speak English very well, 30% speak English well).
1.3% of residents speak Asian or Pacific Island language at home (70% speak English very well, 30% speak English well).
0.5% of residents speak other language at home (100% speak English very well).
Foreign born population: 981 (13.9%)
(69.3% of them are naturalized citizens)
Percentage of workers working in this county: 96.9% Number of people working at home: 803 (17.0% of all workers)
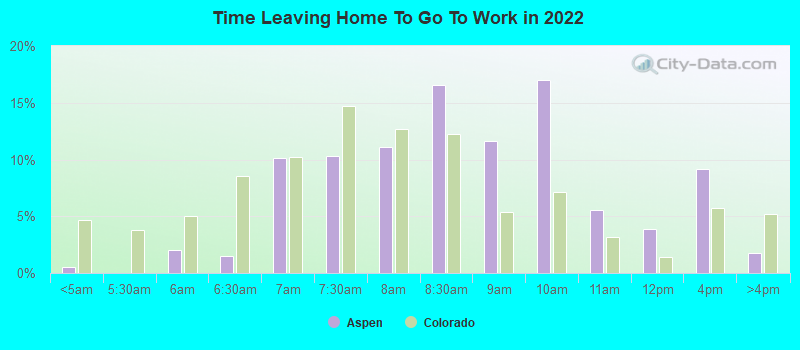
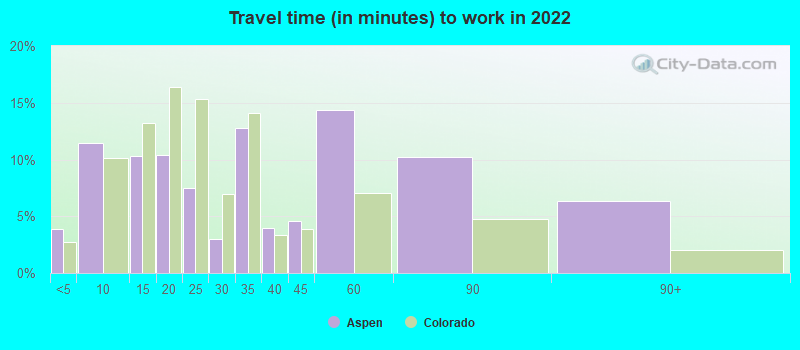
Travel time to work (commute)
Less than 5 minutes: 256
5 to 9 minutes: 896
10 to 14 minutes: 1,078
15 to 19 minutes: 983
20 to 24 minutes: 411
25 to 29 minutes: 42
30 to 34 minutes: 69
35 to 39 minutes: 4
40 to 44 minutes: 21
45 to 59 minutes: 134
60 to 89 minutes: 16
90 or more minutes: 6
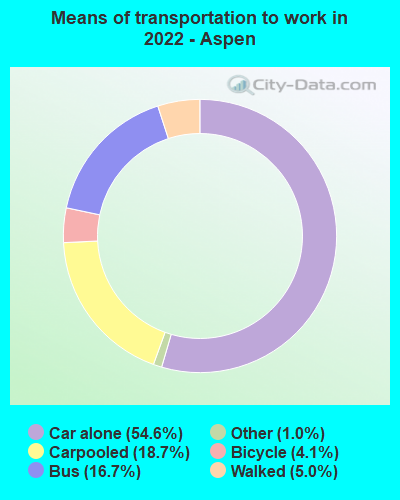
Means of transportation to work:
Drove a car alone: 5,575 (48.7%)
Carpooled: 1,982 (17.3%)
Bus: 1,265 (11.0%)
Taxi: 111 (1.0%)
Bicycle: 427 (3.7%)
Walked: 522 (4.6%)
Worked at home: 803 (7.0%)
Unemployment by race in 2022
Unemployment rate for White non-Hispanic residents
3.6%Males
Unemployment rate for Hispanic or Latino residents
0.4%Males
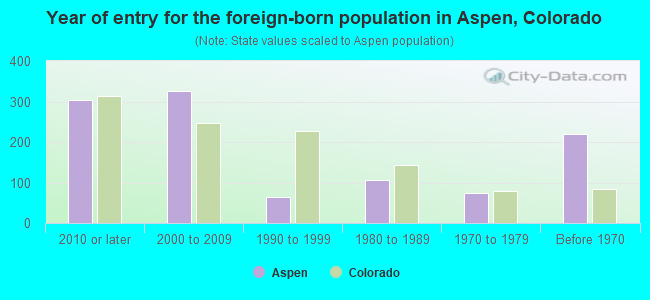
Year of entry for the foreign-born population in Aspen, Colorado
3042010 or later
3272000 to 2009
631990 to 1999
1061980 to 1989
731970 to 1979
219Before 1970
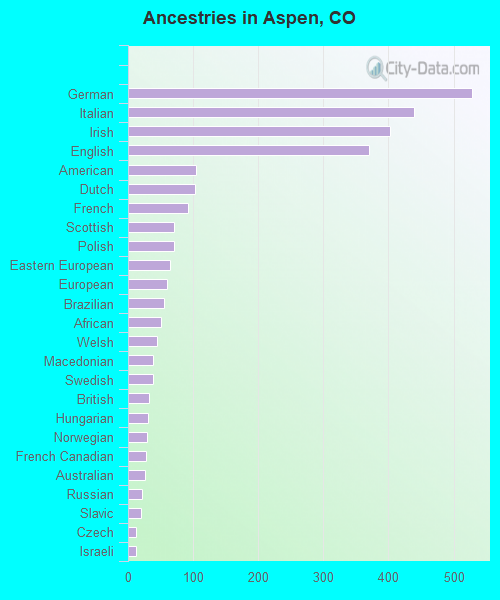
First ancestries reported:
German: 528 (14.2%)
Italian: 439 (11.8%)
Irish: 403 (10.8%)
English: 370 (9.9%)
American: 105 (2.8%)
Dutch: 103 (2.8%)
French: 92 (2.5%)
Scottish: 71 (1.9%)
Polish: 70 (1.9%)
Eastern European: 65 (1.7%)
European: 60 (1.6%)
Brazilian: 56 (1.5%)
African: 51 (1.4%)
Welsh: 44 (1.2%)
Macedonian: 39 (1.0%)
Swedish: 39 (1.0%)
British: 32 (0.9%)
Hungarian: 31 (0.8%)
Norwegian: 29 (0.8%)
French Canadian: 27 (0.7%)
Australian: 26 (0.7%)
Russian: 22 (0.6%)
Slavic: 20 (0.5%)
Czech: 13 (0.3%)
Israeli: 12 (0.3%)
Portuguese: 12 (0.3%)
Austrian: 11 (0.3%)
Swiss: 11 (0.3%)
Croatian: 10 (0.3%)
Celtic: 9 (0.2%)
Belgian: 6 (0.2%)
Canadian: 6 (0.2%)
Czechoslovakian: 6 (0.2%)
Lithuanian: 6 (0.2%)
Ethiopian: 5 (0.1%)
Basque: 4 (0.1%)
Slovene: 3 (0.08%)
Most common places of birth for foreign-born residents (%):
Argentina
Aspen:
24.6% (241)
Colorado:
0.6% (3,016)
England
Aspen:
10.5% (103)
Colorado:
1.2% (6,672)
Other Eastern Europe
Aspen:
7.6% (75)
Colorado:
0.4% (1,985)
Brazil
Aspen:
6.4% (63)
Colorado:
1.0% (5,365)
Mexico
Aspen:
4.7% (46)
Colorado:
38.3% (209,491)
Kazakhstan
Aspen:
4.5% (44)
Colorado:
0.1% (529)
Thailand
Aspen:
4.5% (44)
Colorado:
0.7% (3,563)
India
Aspen:
3.9% (38)
Colorado:
4.0% (21,689)
Australia
Aspen:
3.8% (37)
Colorado:
0.6% (3,144)
Hungary
Aspen:
3.2% (31)
Colorado:
0.2% (1,186)
China, excluding Hong Kong and Taiwan
Aspen:
2.8% (27)
Colorado:
3.3% (17,998)
Ukraine
Aspen:
2.7% (26)
Colorado:
0.8% (4,267)
Peru
Aspen:
2.7% (26)
Colorado:
0.9% (4,810)
Chile
Aspen:
2.5% (25)
Colorado:
0.4% (1,938)
Canada
Aspen:
2.5% (25)
Colorado:
2.7% (15,026)
Austria
Aspen:
1.8% (18)
Colorado:
0.2% (823)
South Africa
Aspen:
1.7% (17)
Colorado:
0.5% (2,472)
Latvia
Aspen:
1.5% (15)
Colorado:
0.1% (514)
Portugal
Aspen:
1.5% (15)
Colorado:
0.1% (302)
Place of birth for U.S.-born residents:
This state: 1,498
Other state: 4,410
Northeast: 1,371
Midwest: 1,327
South: 1,063
West: 666
80.4% of Aspen residents lived in the same house 1 years ago. Out of people who lived in different houses, 26.8% lived in this county. Out of people who lived in different counties, 36.9% lived in Colorado.
Aspen:
80.4%
State average:
83.6%
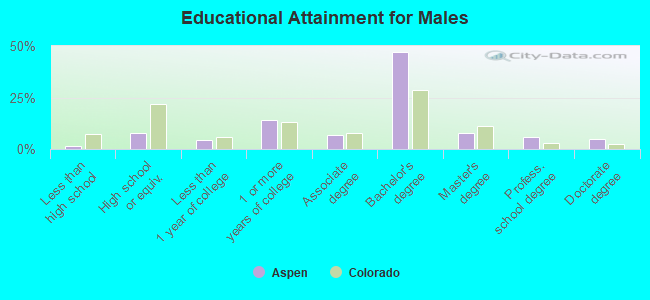
Education attainment for males 25 years and older:
No schooling: 0
Nursery to 4th grade: 0
5th and 6th grade: 0
7th and 8th grade: 0
9th grade: 0
10th grade: 4
11th grade: 0
12th grade, no diploma: 46
High school graduate (or equivalency): 226
Less than 1 year of college: 128
Some college more than 1 year, no degree: 425
Associate degree: 207
Bachelor's degree: 1,406
Master's degree: 232
Professional school degree: 172
Doctorate degree: 141
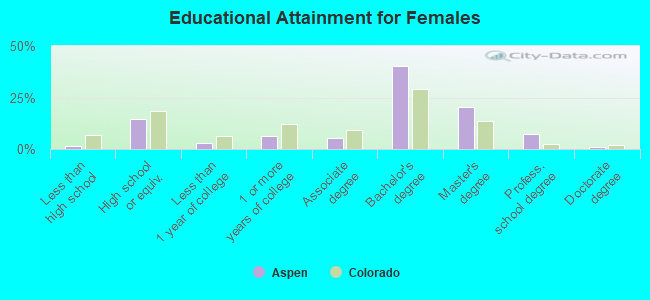
Education attainment for females 25 years and older:
No schooling: 38
Nursery to 4th grade: 0
5th and 6th grade: 0
7th and 8th grade: 0
9th grade: 0
10th grade: 0
11th grade: 0
12th grade, no diploma: 8
High school graduate (or equivalency): 423
Less than 1 year of college: 81
Some college more than 1 year, no degree: 187
Associate degree: 159
Bachelor's degree: 1,158
Master's degree: 589
Professional school degree: 204
Doctorate degree: 26
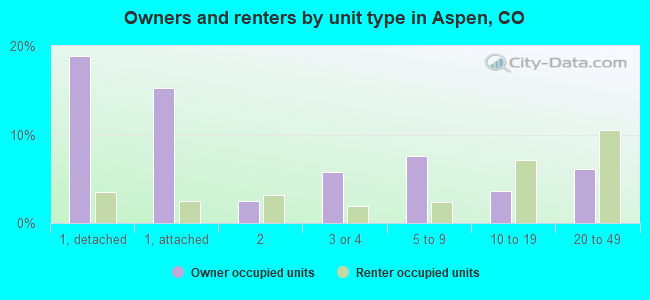
Housing units in structures:
One, detached: 1,342
One, attached: 644
Two: 217
3 or 4: 635
5 to 9: 930
10 to 19: 1,102
20 to 49: 966
50 or more: 335
Mobile homes: 79
Boats, RVs, vans, etc.: 11
Housing units lacking complete kitchen facilities in 2022: 4.1%