Battle Ground, WA (Washington) Houses and Residents
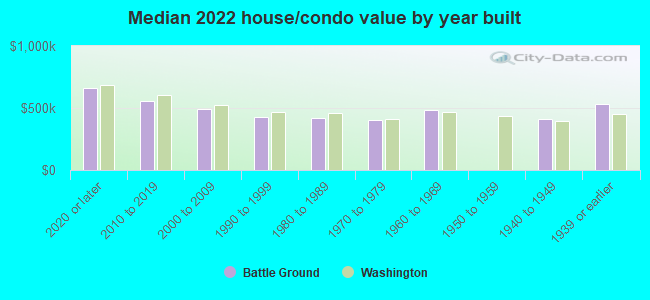
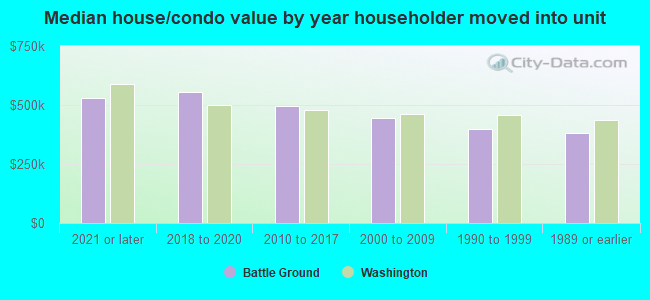
| Battle Ground: | $488,112 |
| Washington: | $569,500 |
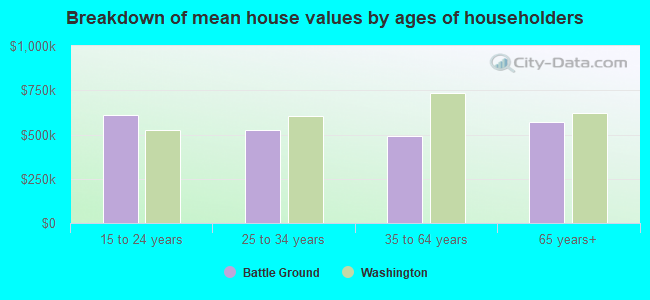
Mean price in 2022:
Detached houses: $539,657
Here: $539,657 State: $734,307 Townhouses or other attached units: $323,475
Here: $323,475 State: $657,697 Mobile homes: $83,392
Here: $83,392 State: $218,362
Total population: 18,930 (Urban population: 9,344, Rural population: 0)
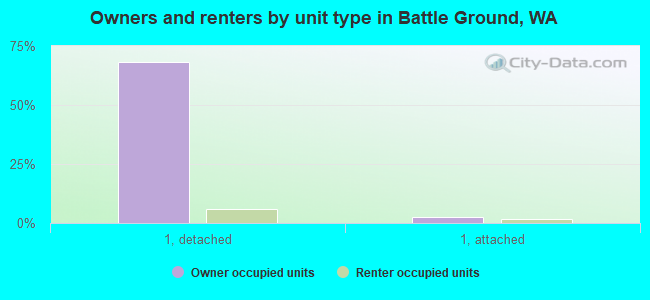
Houses: 7,557 (7,401 occupied: 5,350 owner occupied, 2,046 renter occupied)
| % of renters here: | 28% |
| State: | 36% |
Housing density: 2,075 houses/condos per square mile
Median price asked for vacant for-sale houses and condos in 2022 in this county: $858,483.
Median contract rent in 2022: $1,384 (lower quartile is $1,142, upper quartile is $1,706)
Median rent asked for vacant for-rent units in 2022: $4,311
Median gross rent in Battle Ground, WA in 2022: $1,467
Housing units in Battle Ground with a mortgage: 4,258 (470 second mortgage, 0 home equity loan, 383 both second mortgage and home equity loan)
Houses without a mortgage: 37
Median household income for houses/condos with a mortgage: $108,367
Median household income for apartments without a mortgage: $74,536
Median monthly housing costs: $1,633
Compare current foreclosures near Battle Ground, WA:
| Photo | Address | Area | Beds / Baths | Price | Details |
|---|---|---|---|---|---|

|
#1
NW 8th St
Battle Ground, WA 98604
|
2,466 sq. feet
|
3 baths 4 beds |
show details | |

|
#2
NW 10th St
Battle Ground, WA 98604
|
1,410 sq. feet
|
2 baths 3 beds |
show details | |

|
#3
NW 4th St
Battle Ground, WA 98604
|
1,200 sq. feet
|
2 baths 3 beds |
show details | |

|
#4
NE 139th Ave
Battle Ground, WA 98604
|
2,268 sq. feet
|
2 baths 3 beds |
show details | |

|
#5
NW 7th St
Battle Ground, WA 98604
|
2,073 sq. feet
|
2 baths 3 beds |
show details | |

|
#6
SW 21st Ave
Battle Ground, WA 98604
|
1,480 sq. feet
|
2 baths 3 beds |
show details | |

|
#7
SW 6th St
Battle Ground, WA 98604
|
1,441 sq. feet
|
3 baths 3 beds |
show details | |

|
#8
SW 24th Ave
Battle Ground, WA 98604
|
2,136 sq. feet
|
3 baths 3 beds |
show details | |

|
#9
NE 267th Ct
Battle Ground, WA 98604
|
4,269 sq. feet
|
4 baths 4 beds |
show details | |

|
#10
SW 3rd St
Battle Ground, WA 98604
|
1,032 sq. feet
|
1 baths 3 beds |
show details |
| Photo | Address | Area | Beds / Baths | Price | Details |
|---|---|---|---|---|---|

|
#11
NW 16th St
Battle Ground, WA 98604
|
- sq. feet
|
- baths - beds |
show details | |

|
#12
NE 283rd St
Battle Ground, WA 98604
|
- sq. feet
|
- baths - beds |
show details | |

|
#13
SW 9th St
Battle Ground, WA 98604
|
- sq. feet
|
- baths - beds |
show details | |

|
#14
NE 108th Ave
Battle Ground, WA 98604
|
- sq. feet
|
- baths - beds |
show details | |

|
#15
SE 8th Way
Battle Ground, WA 98604
|
- sq. feet
|
- baths - beds |
show details | |

|
#16
NW 29th Ave
Battle Ground, WA 98604
|
- sq. feet
|
- baths - beds |
show details | |

|
#17
NE 6th St
Battle Ground, WA 98604
|
- sq. feet
|
- baths - beds |
show details | |

|
#18
NW 12th St
Battle Ground, WA 98604
|
- sq. feet
|
- baths - beds |
show details | |

|
#19
NE 50th Ave
Battle Ground, WA 98604
|
- sq. feet
|
- baths - beds |
show details | |

|
#20
NW 18th Ct
Battle Ground, WA 98604
|
- sq. feet
|
- baths - beds |
show details |
| Photo | Address | Area | Beds / Baths | Price | Details |
|---|---|---|---|---|---|

|
#21
SW Eaton Blvd Apt 111
Battle Ground, WA 98604
|
- sq. feet
|
- baths - beds |
show details | |

|
#22
NE Wygant St
Portland, OR 97218
|
1,177 sq. feet
|
2 baths 2 beds |
$218,400
|
show details |

|
#23
North East Brazee St
Portland, OR 97220
|
1,578 sq. feet
|
2 baths 3 beds |
$350,000
|
show details |

|
#24
Rossiter Ln
Vancouver, WA 98661
|
1,519 sq. feet
|
3 baths 2 beds |
show details | |

|
#25
N Rosa Parks Way # 201
Portland, OR 97217
|
561 sq. feet
|
1 baths 2 beds |
show details | |

|
#26
NE 34th Ave Apt 4b
Vancouver, WA 98665
|
1,186 sq. feet
|
3 baths 2 beds |
show details | |

|
#27
W 15th Ave
La Center, WA 98629
|
1,688 sq. feet
|
2 baths 3 beds |
show details | |

|
#28
NE Holman St
Portland, OR 97218
|
1,272 sq. feet
|
2 baths 2 beds |
show details | |

|
#29
NE 96th Ave
Vancouver, WA 98662
|
1,270 sq. feet
|
2 baths 3 beds |
show details | |

|
#30
NE Sitka Dr
Camas, WA 98607
|
2,312 sq. feet
|
2 baths 4 beds |
show details |
| Photo | Address | Area | Beds / Baths | Price | Details |
|---|---|---|---|---|---|

|
#31
NE 27th Ave
Portland, OR 97211
|
1,190 sq. feet
|
1 baths 4 beds |
show details | |

|
#32
NE 85th Cir
Vancouver, WA 98665
|
2,155 sq. feet
|
3 baths 3 beds |
show details | |

|
#33
NE 162nd Pl
Vancouver, WA 98684
|
1,240 sq. feet
|
2 baths 3 beds |
show details | |

|
#34
NE 23rd Ave
Vancouver, WA 98663
|
1,280 sq. feet
|
1 baths 3 beds |
show details | |

|
#35
Cimerron St
Woodland, WA 98674
|
- sq. feet
|
2 baths 3 beds |
show details | |

|
#36
NE 111th St
Vancouver, WA 98686
|
2,015 sq. feet
|
2 baths 4 beds |
show details | |

|
#37
Ave
Washougal, WA 98671
|
2,808 sq. feet
|
3 baths 4 beds |
show details | |

|
#38
NE Liberty Ct
Portland, OR 97211
|
2,257 sq. feet
|
3 baths 3 beds |
show details | |

|
#39
NE 162nd Ave
Portland, OR 97230
|
1,073 sq. feet
|
2 baths 3 beds |
show details | |

|
#40
N Curtis Ave
Portland, OR 97217
|
1,643 sq. feet
|
2 baths 3 beds |
show details |
| Photo | Address | Area | Beds / Baths | Price | Details |
|---|---|---|---|---|---|

|
#41
NE 16th St
Vancouver, WA 98664
|
- sq. feet
|
2 baths 3 beds |
show details | |

|
#42
K St
Washougal, WA 98671
|
1,379 sq. feet
|
1 baths 3 beds |
show details | |

|
#43
NE 85th Cir
Vancouver, WA 98662
|
1,635 sq. feet
|
1 baths 3 beds |
show details | |

|
#44
NE 49th St
Vancouver, WA 98661
|
1,928 sq. feet
|
2 baths 3 beds |
show details | |

|
#45
NE Yacolt Mountain Rd
Yacolt, WA 98675
|
1,620 sq. feet
|
2 baths 2 beds |
show details | |

|
#46
NE 109th St
Vancouver, WA 98686
|
1,432 sq. feet
|
2 baths 3 beds |
show details | |

|
#47
E Wilson St
Yacolt, WA 98675
|
1,520 sq. feet
|
2 baths 3 beds |
show details | |

|
#48
NE Klickitat St
Portland, OR 97230
|
1,693 sq. feet
|
1 baths 3 beds |
show details | |

|
#49
NE Nicholson Loop
Vancouver, WA 98661
|
1,246 sq. feet
|
3 baths 3 beds |
show details | |

|
Check over 1 million property listings on Foreclosure.com!
|
browse all offers | |||


 | Moving from Indiana...Favorite apartments/condos/areas to live? (11 replies) |
| Retiring and buying $450k house possible? (37 replies) |
| Which areas best for renting a house? (11 replies) |
| I got sticker shock by Vancouver housing price (28 replies) |
| Salmon Creek vs. Fishers Landing (222 replies) |
| Vancouvercenter Condos downtown? (7 replies) |
Median year apartment built: 2007
Household type by relationship:
Households: 21,413- Male householders: 3,459 (527 living alone), Female householders: 3,758 (819 living alone)
4,281 spouses (4,270 opposite-sex spouses), 556 unmarried partners, (527 opposite-sex unmarried partners), 7,366 children (6,945 natural, 144 adopted, 276 stepchildren), 328 grandchildren, 181 brothers or sisters, 269 parents, 0 foster children, 349 other relatives, 753 non-relatives
- In group quarters: 108
Size of family households: 2,073 2-persons, 1,071 3-persons, 984 4-persons, 560 5-persons, 285 6-persons, 331 7-or-more-persons.
Size of nonfamily households: 1,474 1-person, 450 2-persons, 38 3-persons, 28 4-persons, 25 5-persons, 18 6-persons.
4,442 married couples with children.
598 single-parent households (124 men, 474 women).
86.0% of residents of Battle Ground speak English at home.
3.1% of residents speak Spanish at home (73% speak English very well, 20% speak English well, 7% speak English not well).
10.1% of residents speak other Indo-European language at home (50% speak English very well, 17% speak English well, 27% speak English not well, 6% don't speak English at all).
0.2% of residents speak Asian or Pacific Island language at home (83% speak English very well, 17% speak English well).
0.1% of residents speak other language at home (100% speak English very well).
Foreign born population: 1,904 (8.9%)
(72.8% of them are naturalized citizens)
| Here: | 6.2 |
| State: | 6.5 |
| Here: | 3.9 |
| State: | 3.9 |
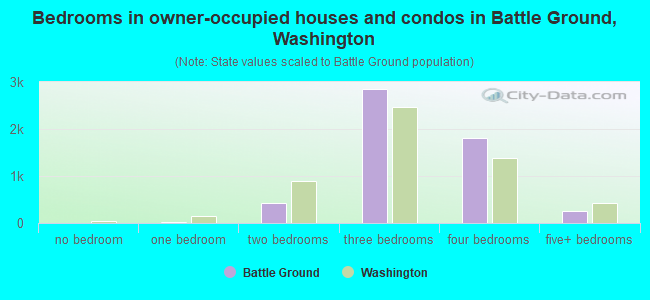
- Bedrooms in owner-occupied houses and condos in Battle Ground, Washington
- 0no bedroom
- 111 bedroom
- 4202 bedrooms
- 2,8493 bedrooms
- 1,8124 bedrooms
- 2585+ bedrooms
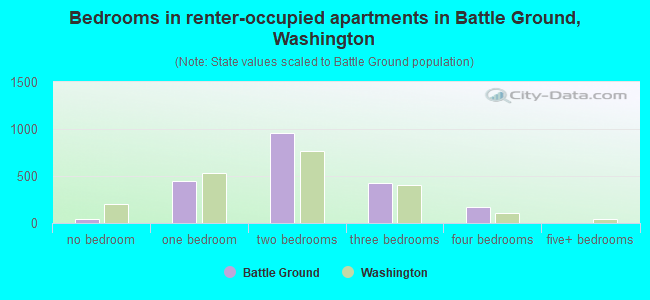
- Bedrooms in renter-occupied apartments in Battle Ground, Washington
- 46no bedroom
- 4461 bedroom
- 9582 bedrooms
- 4293 bedrooms
- 1674 bedrooms
- 05+ bedrooms
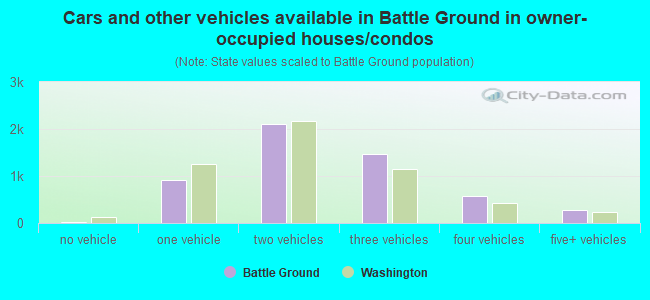
- Cars and other vehicles available in Battle Ground in owner-occupied houses/condos
- 12no vehicle
- 9131 vehicle
- 2,1012 vehicles
- 1,4733 vehicles
- 5764 vehicles
- 2765+ vehicles
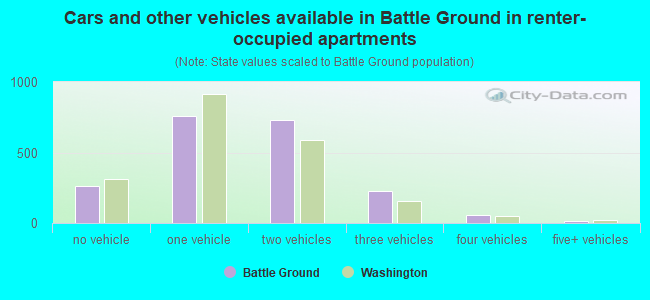
- Cars and other vehicles available in Battle Ground in renter-occupied apartments
- 263no vehicle
- 7621 vehicle
- 7292 vehicles
- 2243 vehicles
- 584 vehicles
- 125+ vehicles
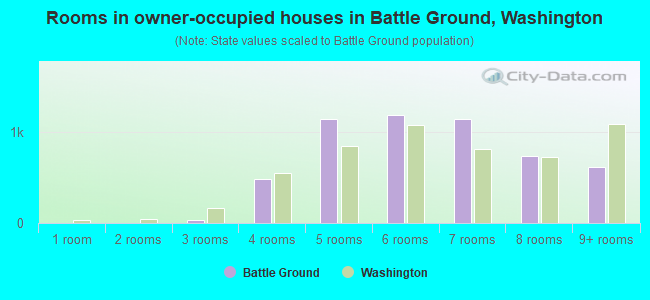
- Rooms in owner-occupied houses in Battle Ground, Washington
- 01 room
- 02 rooms
- 383 rooms
- 4844 rooms
- 1,1475 rooms
- 1,1866 rooms
- 1,1417 rooms
- 7388 rooms
- 6169+ rooms
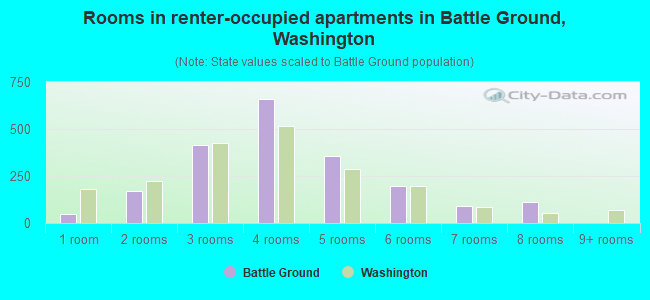
- Rooms in renter-occupied apartments in Battle Ground, Washington
- 461 room
- 1712 rooms
- 4153 rooms
- 6604 rooms
- 3555 rooms
- 1996 rooms
- 887 rooms
- 1128 rooms
- 09+ rooms
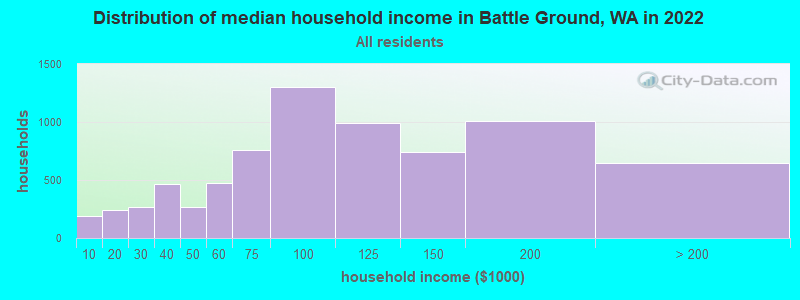
Battle Ground, WA household income distribution

- 187Less than $10,000
- 240$10,000 to $19,999
- 267$20,000 to $29,999
- 464$30,000 to $39,999
- 269$40,000 to $49,999
- 472$50,000 to $59,999
- 759$60,000 to $74,999
- 1,302$75,000 to $99,999
- 990$100,000 to $124,999
- 744$125,000 to $149,999
- 1,005$150,000 to $199,999
- 649$200,000 or more
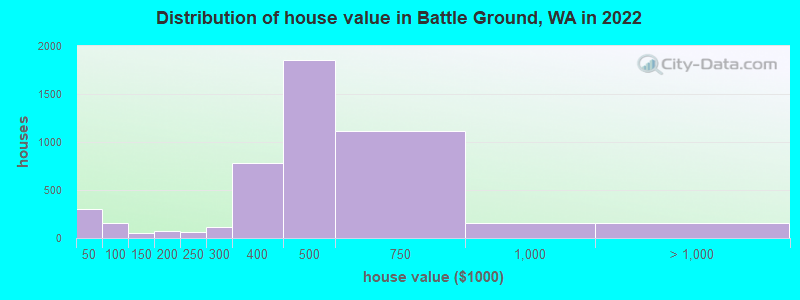
Home value of owner - occupied houses in 2022 in Battle Ground, WA
-
- 88Less than $10,000
- 21$10,000 to $14,999
- 4$15,000 to $19,999
- 88$25,000 to $29,999
- 15$35,000 to $39,999
- 80$40,000 to $49,999
- 16$50,000 to $59,999
- 33$60,000 to $69,999
- 14$80,000 to $89,999
- 13$90,000 to $99,999
- 29$100,000 to $124,999
- 17$125,000 to $149,999
- 57$150,000 to $174,999
- 11$175,000 to $199,999
- 66$200,000 to $249,999
- 111$250,000 to $299,999
- 778$300,000 to $399,999
- 1,857$400,000 to $499,999
- 1,119$500,000 to $749,999
- 156$750,000 to $999,999
- 70$1,000,000 to $1,499,999
- 55$1,500,000 to $1,999,999
- 33$2,000,000 or more
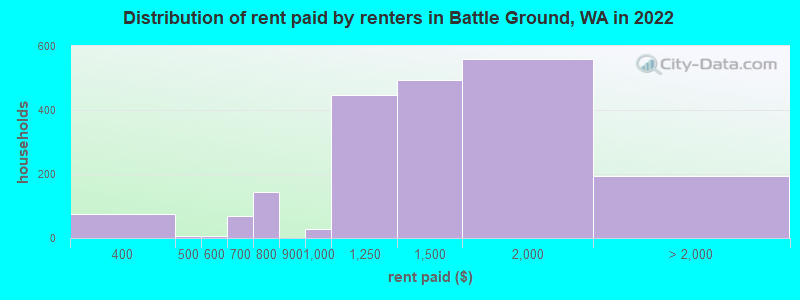
Rent paid by renters in 2022 in Battle Ground, WA
-
- 74$300 to $349
- 7$400 to $449
- 5$550 to $599
- 68$600 to $649
- 19$700 to $749
- 126$750 to $799
- 28$900 to $999
- 445$1,000 to $1,249
- 493$1,250 to $1,499
- 558$1,500 to $1,999
- 128$2,000 to $2,499
- 4$2,500 to $2,999
- 26$3,000 to $3,499
- 18$3,500 or more
- 13No cash rent
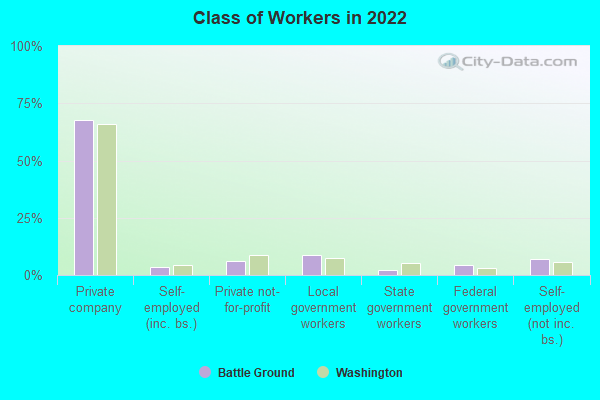
Percentage of workers working in this county: 76.1%
Number of people working at home: 1,291 (12.5% of all workers)
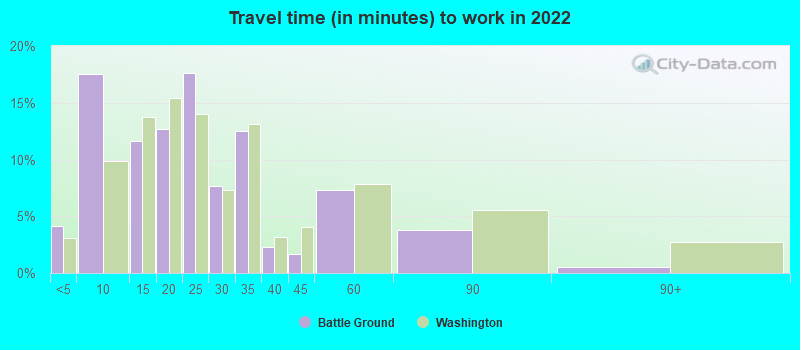
Travel time to work (commute)
- Less than 5 minutes: 390
- 5 to 9 minutes: 1,014
- 10 to 14 minutes: 514
- 15 to 19 minutes: 624
- 20 to 24 minutes: 1,156
- 25 to 29 minutes: 946
- 30 to 34 minutes: 1,501
- 35 to 39 minutes: 405
- 40 to 44 minutes: 475
- 45 to 59 minutes: 903
- 60 to 89 minutes: 315
- 90 or more minutes: 261
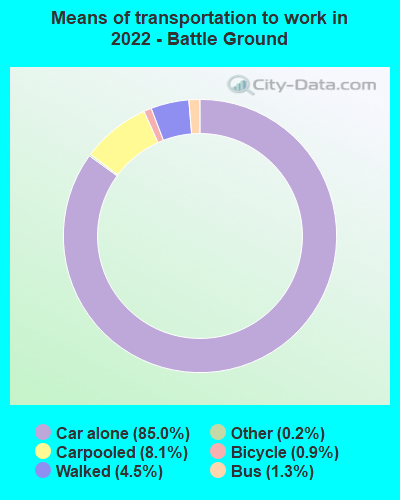
Means of transportation to work:
- Drove a car alone: 5,266 (69.4%)
- Carpooled: 526 (6.9%)
- Bus: 51 (0.7%)
- Taxi: 5 (0.1%)
- Bicycle: 25 (0.3%)
- Walked: 349 (4.6%)
- Worked at home: 1,291 (17.0%)
- Unemployment by race in 2022
- Unemployment rate for White non-Hispanic residents
- 4.1%Males
- 2.1%Females
- Unemployment rate for other race residents
- 27.5%Males
- Unemployment rate for two or more race residents
- 11.9%Males
- 5.3%Females
- Unemployment rate for Hispanic or Latino residents
- 15.6%Males
- 11.2%Females
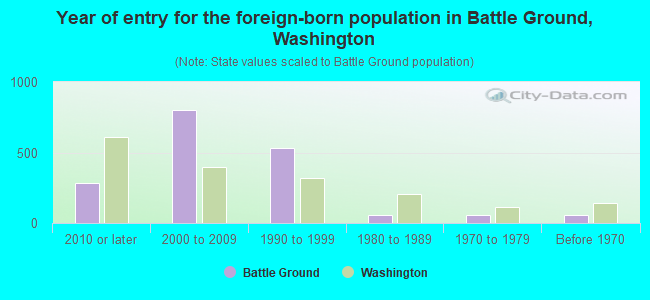
- Year of entry for the foreign-born population in Battle Ground, Washington
- 2822010 or later
- 7982000 to 2009
- 5301990 to 1999
- 601980 to 1989
- 561970 to 1979
- 56Before 1970
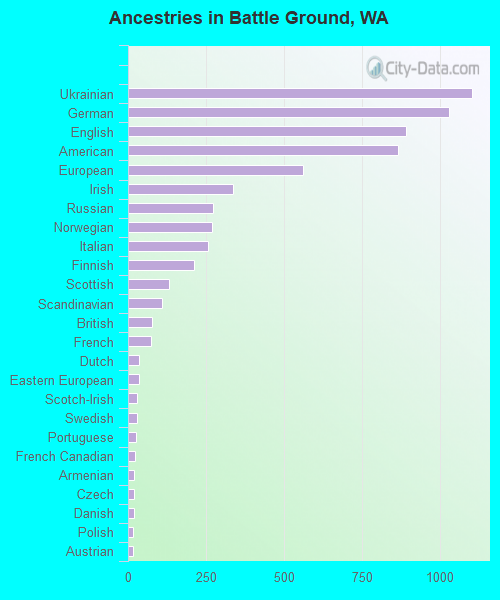
First ancestries reported:
- Ukrainian: 1,102 (13.4%)
- German: 1,030 (12.5%)
- English: 892 (10.9%)
- American: 864 (10.5%)
- European: 560 (6.8%)
- Irish: 337 (4.1%)
- Russian: 272 (3.3%)
- Norwegian: 270 (3.3%)
- Italian: 256 (3.1%)
- Finnish: 213 (2.6%)
- Scottish: 132 (1.6%)
- Scandinavian: 110 (1.3%)
- British: 76 (0.9%)
- French: 73 (0.9%)
- Dutch: 35 (0.4%)
- Eastern European: 34 (0.4%)
- Scotch-Irish: 28 (0.3%)
- Swedish: 28 (0.3%)
- Portuguese: 27 (0.3%)
- French Canadian: 22 (0.3%)
- Armenian: 20 (0.2%)
- Czech: 19 (0.2%)
- Danish: 18 (0.2%)
- Polish: 16 (0.2%)
- Austrian: 15 (0.2%)
- African: 15 (0.2%)
- Swiss: 15 (0.2%)
- Lebanese: 12 (0.1%)
- Croatian: 12 (0.1%)
- Northern European: 9 (0.1%)
- Celtic: 7 (0.09%)
- Lithuanian: 6 (0.07%)
- Hungarian: 4 (0.05%)
Most common places of birth for foreign-born residents (%):
| Battle Ground: | 53.9% (1,105) |
| Washington: | 3.1% (35,872) |
| Battle Ground: | 9.3% (190) |
| Washington: | 0.4% (4,177) |
| Battle Ground: | 8.6% (177) |
| Washington: | 21.1% (241,655) |
| Battle Ground: | 8.6% (176) |
| Washington: | 1.9% (21,540) |
| Battle Ground: | 2.6% (54) |
| Washington: | 0.2% (2,424) |
| Battle Ground: | 2.5% (51) |
| Washington: | 0.0% (396) |
| Battle Ground: | 2.0% (40) |
| Washington: | 0.0% (551) |
| Battle Ground: | 2.0% (40) |
| Washington: | 4.1% (47,238) |
Place of birth for U.S.-born residents:
- This state: 8,041
- Other state: 11,085
- Northeast: 570
- Midwest: 1,617
- South: 738
- West: 8,142
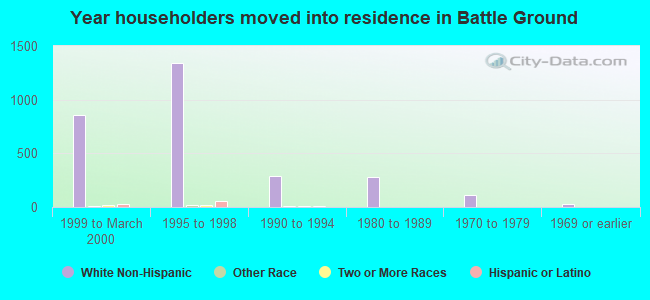
91.7% of Battle Ground residents lived in the same house 1 years ago.
Out of people who lived in different houses, 38.1% lived in this county.
Out of people who lived in different counties, 25.7% lived in Washington.
| Battle Ground: | 91.7% |
| State average: | 85.2% |
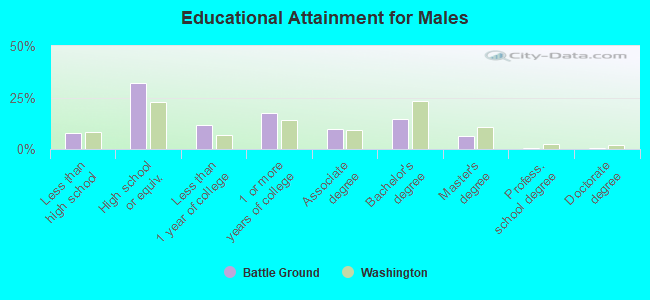
Education attainment for males 25 years and older:
- No schooling: 37
- Nursery to 4th grade: 0
- 5th and 6th grade: 1
- 7th and 8th grade: 120
- 9th grade: 69
- 10th grade: 18
- 11th grade: 45
- 12th grade, no diploma: 221
- High school graduate (or equivalency): 2,123
- Less than 1 year of college: 765
- Some college more than 1 year, no degree: 1,155
- Associate degree: 645
- Bachelor's degree: 957
- Master's degree: 402
- Professional school degree: 27
- Doctorate degree: 17
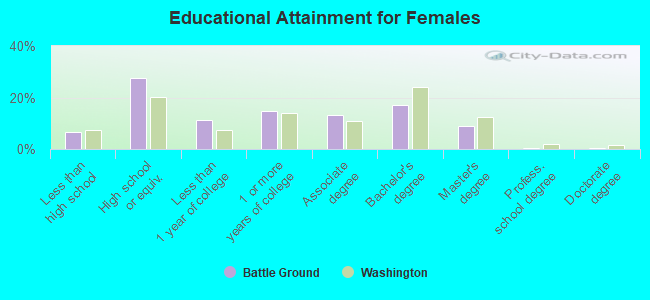
Education attainment for females 25 years and older:
- No schooling: 199
- Nursery to 4th grade: 23
- 5th and 6th grade: 0
- 7th and 8th grade: 85
- 9th grade: 8
- 10th grade: 16
- 11th grade: 22
- 12th grade, no diploma: 112
- High school graduate (or equivalency): 1,926
- Less than 1 year of college: 785
- Some college more than 1 year, no degree: 1,029
- Associate degree: 913
- Bachelor's degree: 1,197
- Master's degree: 621
- Professional school degree: 30
- Doctorate degree: 24
Housing units in structures:
- One, detached: 5,624
- One, attached: 282
- Two: 97
- 3 or 4: 376
- 5 to 9: 125
- 10 to 19: 282
- 20 to 49: 200
- 50 or more: 354
- Mobile homes: 213
Housing units lacking complete kitchen facilities in 2022: 0.7%
House/condo owner moved in on average 7 years ago
Renter moved in on average 4 years ago
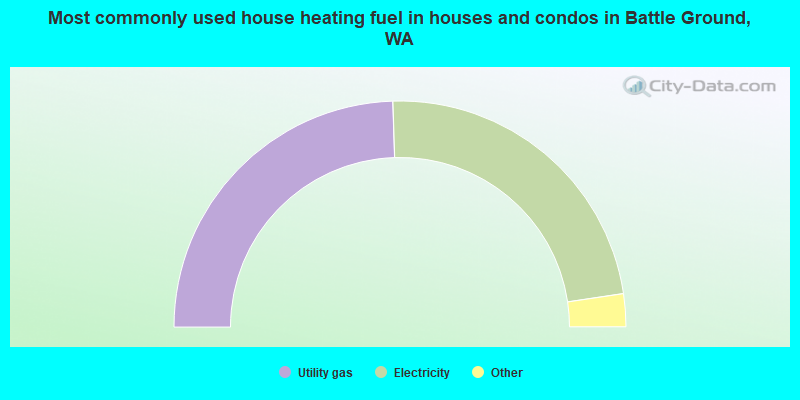
- 49.0%Utility gas
- 46.3%Electricity
- 2.1%Wood
- 1.9%Bottled, tank, or LP gas
- 0.5%Fuel oil, kerosene, etc.
- 0.2%No fuel used
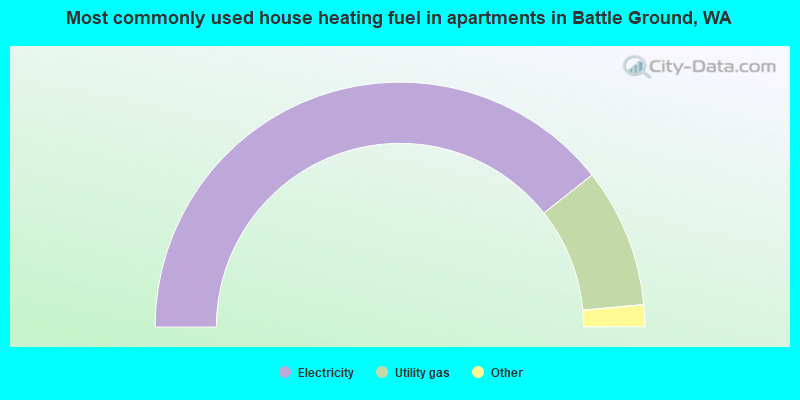
- 78.7%Electricity
- 18.4%Utility gas
- 2.4%No fuel used
- 0.4%Wood
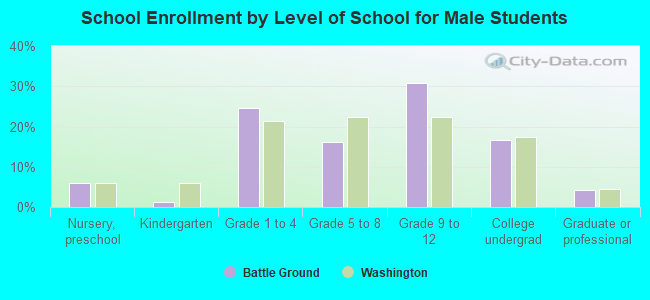
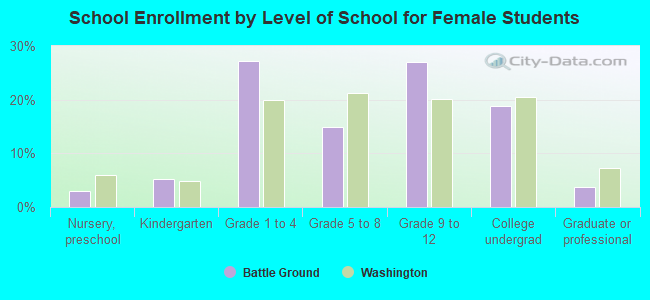
Private vs. public school enrollment:
| Here: | 5.3% |
| Washington: | 12.4% |
| Here: | 5.1% |
| Washington: | 9.2% |
| Here: | 29.0% |
| Washington: | 16.5% |