Bedford, TN (Tennessee) Houses and Residents
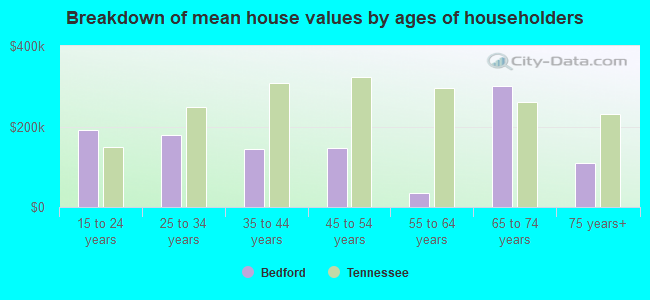
| Bedford: | $269,361 |
| Tennessee: | $284,800 |
Total population: 3,761 (Urban population: 0, Rural population: 3,195 (348 farm, 2,847 nonfarm))
Houses: 1,280 (1,165 occupied: 1,029 owner occupied, 136 renter occupied)
| % of renters here: | 12% |
| State: | 33% |
Housing density: 13 houses/condos per square mile
Median price asked for vacant for-sale houses and condos in 2022 in this county: $238,806.
Median contract rent in 2022: $733 (lower quartile is $529, upper quartile is $936)
Median rent asked for vacant for-rent units in 2022: $639
Median gross rent in Bedford, TN in 2022: $875
Housing units in Bedford with a mortgage: 289 (39 second mortgage, 31 home equity loan, 0 both second mortgage and home equity loan)
Houses without a mortgage: 143


Household type by relationship:
Households: 44,513- In family households: 38,719 (8,383 male householders, 3,518 female householders)
8,681 spouses, 13,350 children (12,055 natural, 312 adopted, 983 stepchildren), 1,269 grandchildren, 575 brothers or sisters, 432 parents, foster children, 814 other relatives, 1,395 non-relatives
- In nonfamily households: 5,794 (2,258 male householders (1,741 living alone)), 2,371 female householders (2,058 living alone)), 1,165 nonrelatives
- In group quarters: 545 (351 institutionalized population)
6,296 married couples with children.
2,145 single-parent households (546 men, 1,599 women).
All residents speak only English at home
Foreign born population: 26 (0.7%)
(57.7% of them are naturalized citizens)
| Here: | 6.3 |
| State: | 6.5 |
| Here: | 6.1 |
| State: | 4.4 |
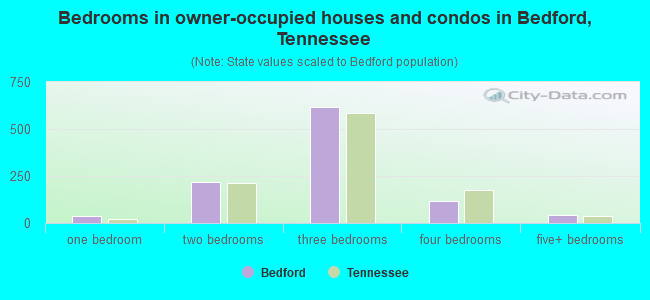
- Bedrooms in owner-occupied houses and condos in Bedford, Tennessee
- 0no bedroom
- 371 bedroom
- 2192 bedrooms
- 6183 bedrooms
- 1154 bedrooms
- 405+ bedrooms
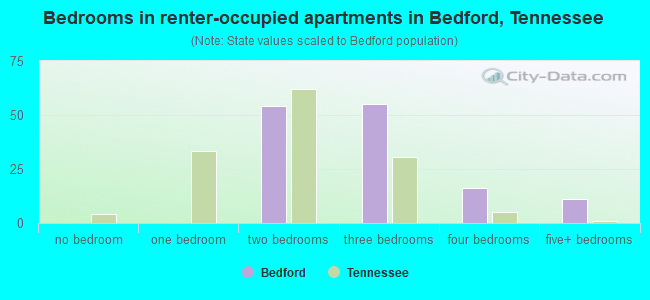
- Bedrooms in renter-occupied apartments in Bedford, Tennessee
- 0no bedroom
- 01 bedroom
- 542 bedrooms
- 553 bedrooms
- 164 bedrooms
- 115+ bedrooms
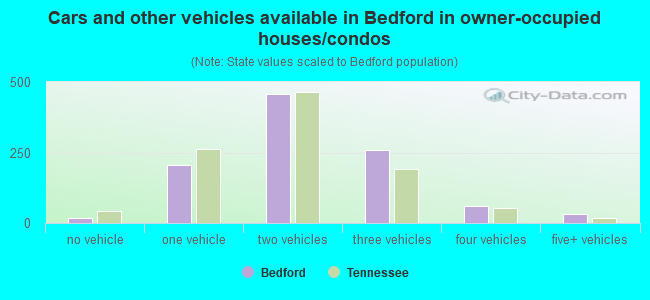
- Cars and other vehicles available in Bedford in owner-occupied houses/condos
- 16no vehicle
- 2041 vehicle
- 4572 vehicles
- 2603 vehicles
- 614 vehicles
- 315+ vehicles
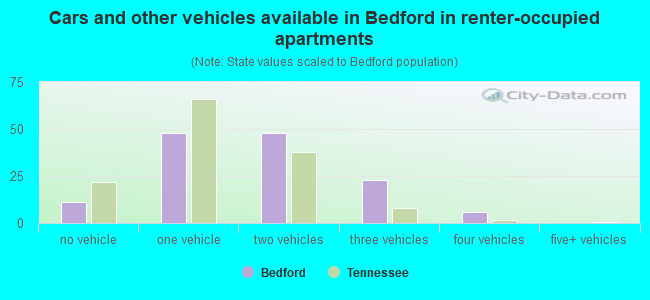
- Cars and other vehicles available in Bedford in renter-occupied apartments
- 11no vehicle
- 481 vehicle
- 482 vehicles
- 233 vehicles
- 64 vehicles
- 05+ vehicles
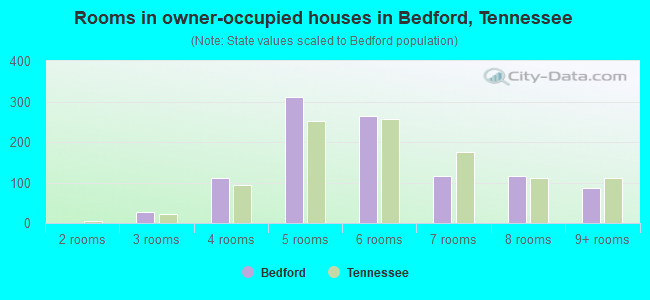
- Rooms in owner-occupied houses in Bedford, Tennessee
- 01 room
- 02 rooms
- 273 rooms
- 1114 rooms
- 3105 rooms
- 2646 rooms
- 1157 rooms
- 1168 rooms
- 869+ rooms
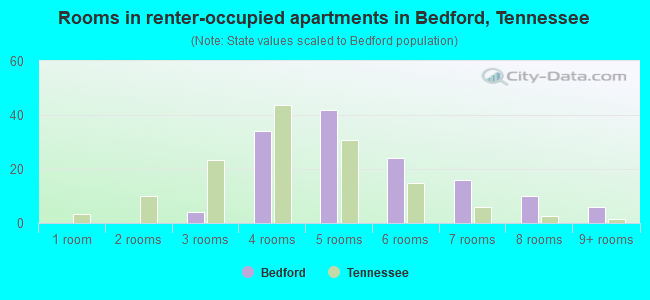
- Rooms in renter-occupied apartments in Bedford, Tennessee
- 01 room
- 02 rooms
- 43 rooms
- 344 rooms
- 425 rooms
- 246 rooms
- 167 rooms
- 108 rooms
- 69+ rooms
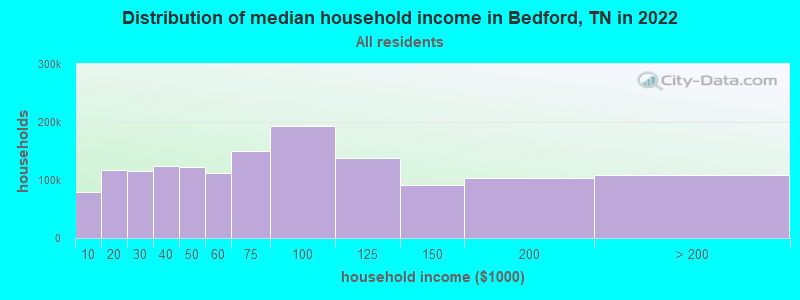
Bedford, TN household income distribution

- 52,347Less than $10,000
- 87,801$10,000 to $19,999
- 83,268$20,000 to $29,999
- 85,138$30,000 to $39,999
- 82,318$40,000 to $49,999
- 76,191$50,000 to $59,999
- 103,879$60,000 to $74,999
- 132,406$75,000 to $99,999
- 99,025$100,000 to $124,999
- 58,984$125,000 to $149,999
- 64,740$150,000 to $199,999
- 54,728$200,000 or more
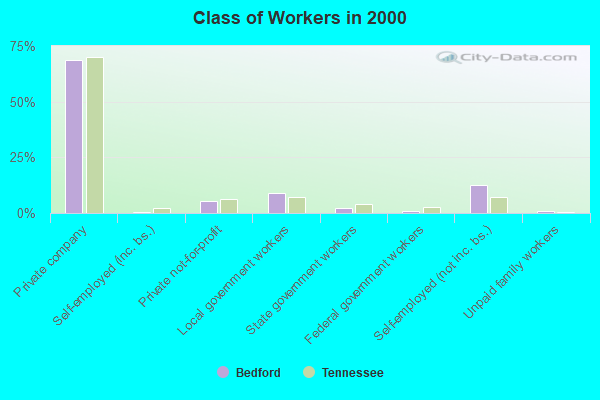
Percentage of workers working in this county: 70.0%
Number of people working at home: 181 (9.8% of all workers)
Travel time to work (commute)
- Less than 5 minutes: 50
- 5 to 9 minutes: 77
- 10 to 14 minutes: 176
- 15 to 19 minutes: 218
- 20 to 24 minutes: 381
- 25 to 29 minutes: 133
- 30 to 34 minutes: 224
- 35 to 39 minutes: 31
- 40 to 44 minutes: 28
- 45 to 59 minutes: 97
- 60 to 89 minutes: 88
- 90 or more minutes: 102
Means of transportation to work:
- Drove a car alone: 1,367 (83.0%)
- Carpooled: 193 (11.7%)
- Bus or trolley bus: 5 (0.3%)
- Walked: 30 (1.8%)
- Other means: 10 (0.6%)
- Worked at home: 42 (2.6%)
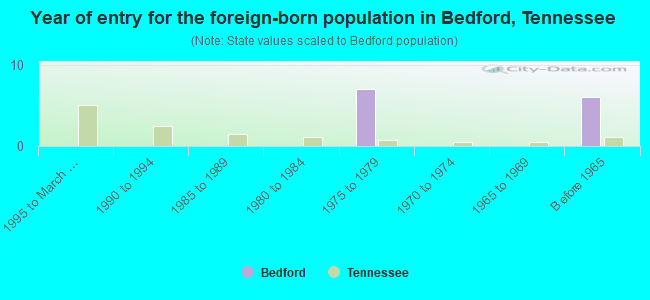
- Year of entry for the foreign-born population in Bedford, Tennessee
- 01995 to March 2000
- 01990 to 1994
- 01985 to 1989
- 01980 to 1984
- 71975 to 1979
- 01970 to 1974
- 01965 to 1969
- 6Before 1965
Most common places of birth for foreign-born residents (%):
| Bedford: | 100.0% (13) |
| Tennessee: | 3.6% (5,726) |
Place of birth for U.S.-born residents:
- This state: 2,218
- Other state: 964
- Northeast: 139
- Midwest: 416
- South: 352
- West: 57
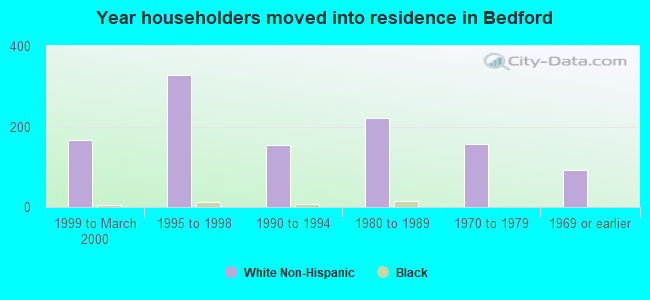
58% of Bedford residents lived in the same house 5 years ago.
Out of people who lived in different houses, 54% lived in this county.
Out of people who lived in different counties, 55% lived in Tennessee.
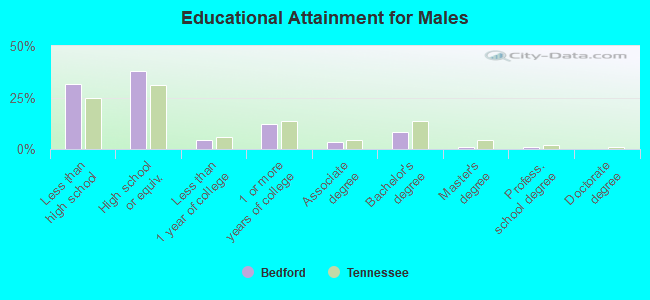
Education attainment for males 25 years and older:
- No schooling: 30
- Nursery to 4th grade: 17
- 5th and 6th grade: 20
- 7th and 8th grade: 83
- 9th grade: 47
- 10th grade: 67
- 11th grade: 48
- 12th grade, no diploma: 28
- High school graduate (or equivalency): 412
- Less than 1 year of college: 46
- Some college more than 1 year, no degree: 131
- Associate degree: 38
- Bachelor's degree: 91
- Master's degree: 11
- Professional school degree: 13
- Doctorate degree: 0
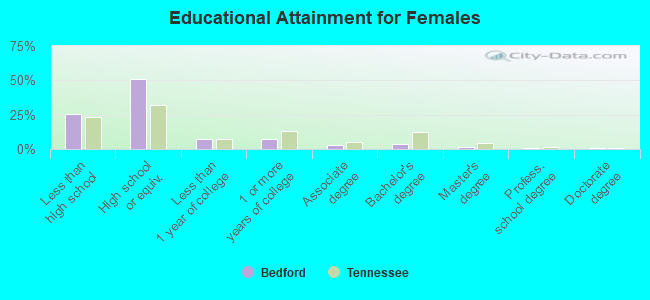
Education attainment for females 25 years and older:
- No schooling: 6
- Nursery to 4th grade: 19
- 5th and 6th grade: 12
- 7th and 8th grade: 97
- 9th grade: 45
- 10th grade: 41
- 11th grade: 40
- 12th grade, no diploma: 7
- High school graduate (or equivalency): 540
- Less than 1 year of college: 78
- Some college more than 1 year, no degree: 76
- Associate degree: 34
- Bachelor's degree: 36
- Master's degree: 19
- Professional school degree: 6
- Doctorate degree: 6


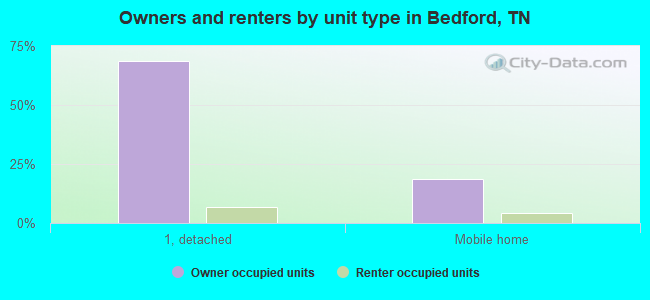
Housing units in structures:
- One, detached: 958
- One, attached: 7
- 5 to 9: 10
- Mobile homes: 305
Median worth of mobile homes: $90,974
Housing units lacking complete kitchen facilities: 2.0%
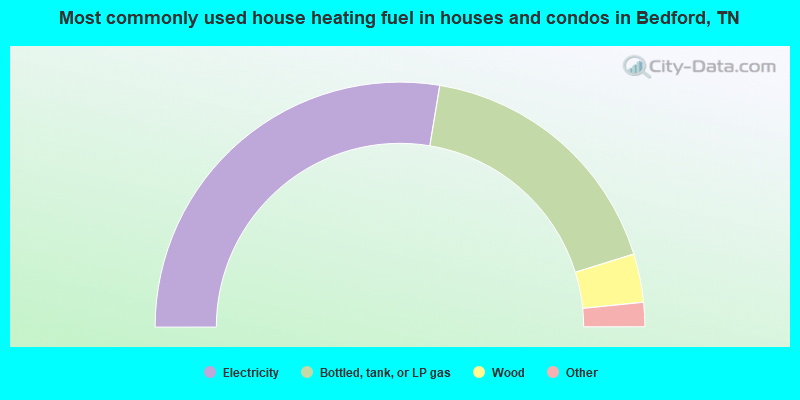
- 55.2%Electricity
- 35.2%Bottled, tank, or LP gas
- 6.4%Wood
- 1.3%Utility gas
- 1.3%Fuel oil, kerosene, etc.
- 0.7%Solar energy
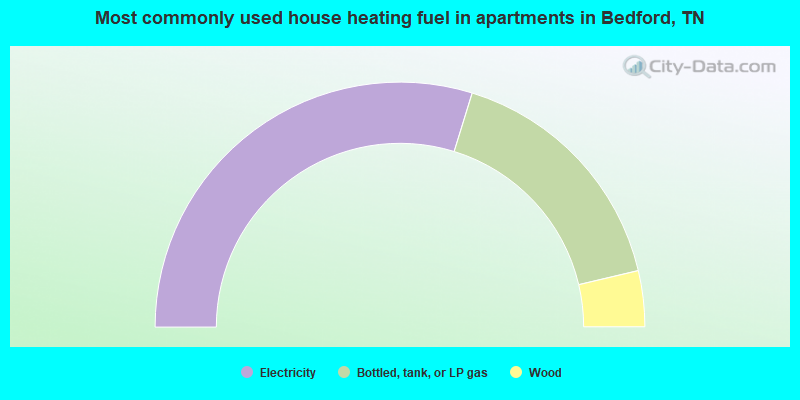
- 59.6%Electricity
- 33.1%Bottled, tank, or LP gas
- 7.4%Wood
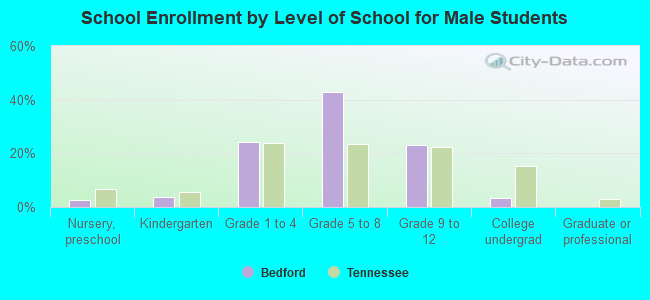
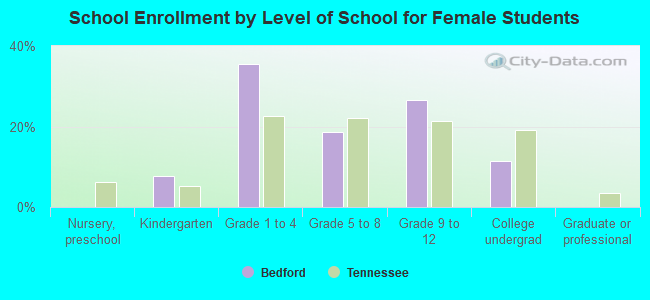
Private vs. public school enrollment:
| Here: | 5.3% |
| Tennessee: | 9.5% |
| Here: | 15.6% |
| Tennessee: | 10.4% |
| Here: | 0.0% |
| Tennessee: | 22.8% |