Bel Air South, MD (Maryland) Houses and Residents
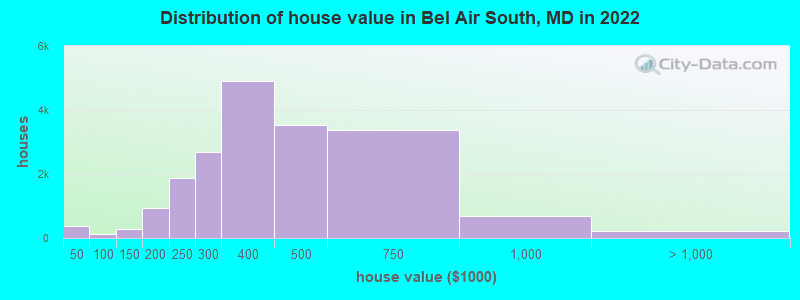
Estimated median house or condo value in 2022: $370,762 (it was $142,400 in 2000 )
Bel Air South:
$370,762Maryland:
$398,100
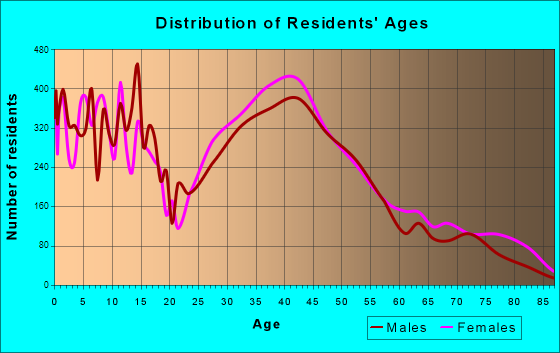
Lower value quartile - upper value quartile: $279,560 - $491,256Total population: 47,709 (Urban population: 40,144, Rural population: 112 (all nonfarm) )
Houses: 23,058 (22,485 occupied: 18,824 owner occupied, 3,893 renter occupied )
% of renters here:
17%State:
32%
Housing density: 1,468 houses/condos per square mile
Median price asked for vacant for-sale houses and condos in 2022: $284,508.
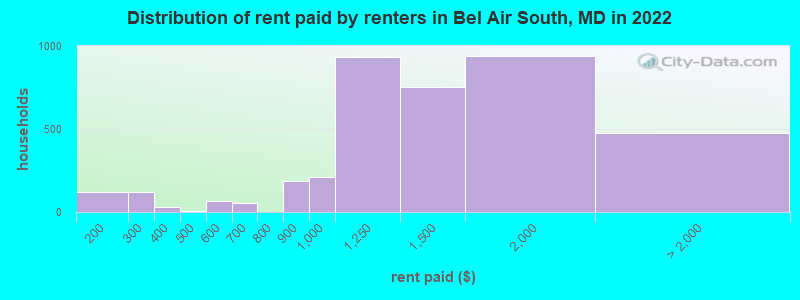
Median contract rent in 2022: $1,352 (lower quartile is $1,009, upper quartile is $1,752)
Median rent asked for vacant for-rent units in 2022: $789
Median gross rent in Bel Air South, MD in 2022: $1,534
Housing units in Bel Air South with a mortgage: 13,957 (1,588 second mortgage, 21 home equity loan, 1,423 both second mortgage and home equity loan )Houses without a mortgage: 226
Median household income for houses/condos with a mortgage: $133,110
Median household income for apartments without a mortgage: $94,049
Median monthly housing costs: $1,617
Data:
Median house or condo value ($)
Median house or condo value ($ change since 2000)
Median house or condo value ($) - White
Median house or condo value ($) - Black or African American
Median house or condo value ($) - Asian
Median house or condo value ($) - Hispanic or Latino
Median house or condo value ($) - American Indian and Alaska Native
Median house or condo value ($) - Multirace
Median house or condo value ($) - Other Race
Median price asked for mobile homes ($)
Household density (households per square mile)
Mean house or condo value by units in structure - 1, detached ($)
Mean house or condo value by units in structure - 1, attached ($)
Mean house or condo value by units in structure - 2 ($)
Mean house or condo value by units in structure by units in structure - 3 or 4 ($)
Mean house or condo value by units in structure - 5 or more ($)
Mean house or condo value by units in structure - Boat, RV, van, etc. ($)
Mean house or condo value by units in structure - Mobile home ($)
Median contract rent ($)
Median contract rent - Lower quartile ($)
Median contract rent - Upper quartile ($)
Median gross rent ($)
Urban houses (%)
Rural houses (%)
Houses occupied (%)
Houses occupied (% change since 2000)
Houses owner occupied (%)
Houses owner occupied (% change since 2000)
Houses renter occupied (%)
Houses renter occupied (% change since 2000)
Vacant housing units - For rent (%)
Vacant housing units - For rent (% change since 2000)
Vacant housing units - For sale only (%)
Vacant housing units - For sale only (% change since 2000)
Vacant housing units - Rented or sold, not occupied (%)
Vacant housing units - Rented or sold, not occupied (% change since 2000)
Vacant housing units - For seasonal, recreational, or occasional use (%)
Vacant housing units - For seasonal, recreational, or occasional use (% change since 2000)
Vacant housing units - For migrant workers (%)
Vacant housing units - For migrant workers (% change since 2000)
Vacant housing units - Other vacant (%)
Vacant housing units - Other vacant (% change since 2000)
Median monthly housing costs ($)
Median household income for houses/condos with a mortgage ($)
Median household income for houses/condos without a mortgage ($)
Median household income ($)
Median household income ($) - White
Median household income ($) - Black or African American
Median household income ($) - Asian
Median household income ($) - Hispanic or Latino
Median household income ($) - American Indian and Alaska Native
Median household income ($) - Multirace
Median household income ($) - Other Race
Mortgage status - with mortgage (%)
Mortgage status - with second mortgage (%)
Mortgage status - with home equity loan (%)
Mortgage status - with both second mortgage and home equity loan (%)
Mortgage status - without a mortgage (%)
Median year house/condo built
Median year apartment built
Household type by relationship - Male householder living alone (%)
Household type by relationship - Male householder not living alone (%)
Household type by relationship - Female householder living alone (%)
Household type by relationship - Female householder not living alone (%)
Household type by relationship - Opposite-Sex spouse (%)
Household type by relationship - Same-Sex spouse (%)
Household type by relationship - Opposite-Sex unmarried partner (%)
Household type by relationship - Same-Sex unmarried partner (%)
Household type by relationship - In group quarters (%)
Size of family households - 2-person household (%)
Size of family households - 3-person household (%)
Size of family households - 4-person household (%)
Size of family households - 5-person household (%)
Size of family households - 6-person household (%)
Size of family households - 7-or-more-person household (%)
Size of nonfamily households - 1-person household (%)
Size of nonfamily households - 2-person household (%)
Size of nonfamily households - 3-person household (%)
Size of nonfamily households - 4-person household (%)
Size of nonfamily households - 5-person household (%)
Size of nonfamily households - 6-person household (%)
Size of nonfamily households - 7-or-moreperson household (%)
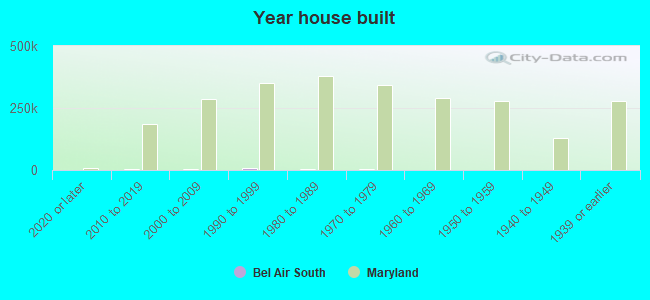
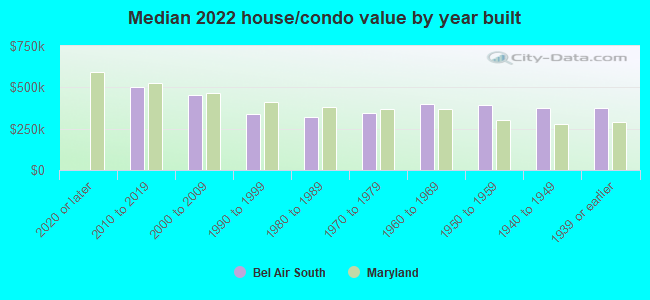
Year house built - Built 2010 or later (%)
Year house built - Built 2000 to 2009 (%)
Year house built - Built 1990 to 1999 (%)
Year house built - Built 1980 to 1989 (%)
Year house built - Built 1970 to 1979 (%)
Year house built - Built 1960 to 1969 (%)
Year house built - Built 1950 to 1959 (%)
Year house built - Built 1940 to 1949 (%)
Year house built - Built 1939 or earlier (%)
Median number of rooms in houses and condos
Median number of rooms in apartments
Median number of bedrooms in owner occupied houses
Mean number of bedrooms in owner occupied houses
Median number of bedrooms in renter occupied houses
Mean number of bedrooms in renter occupied houses
Median number of vehichles in owner occupied houses
Mean number of vehichles in owner occupied houses
Median number of vehichles in renter occupied houses
Mean number of vehichles in renter occupied houses
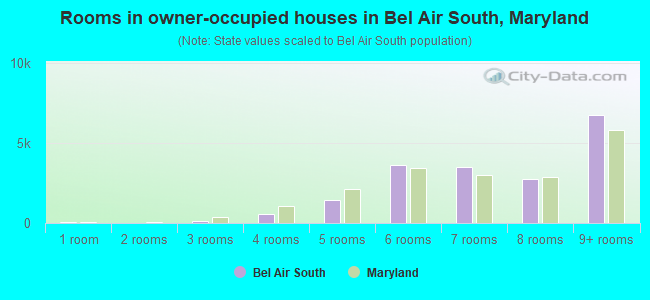
Rooms in owner-occupied houses - 1 room (%)
Rooms in owner-occupied houses - 2 rooms (%)
Rooms in owner-occupied houses - 3 rooms (%)
Rooms in owner-occupied houses - 4 rooms (%)
Rooms in owner-occupied houses - 5 rooms (%)
Rooms in owner-occupied houses - 6 rooms (%)
Rooms in owner-occupied houses - 7 rooms (%)
Rooms in owner-occupied houses - 8 rooms (%)
Rooms in owner-occupied houses - 9+ rooms (%)
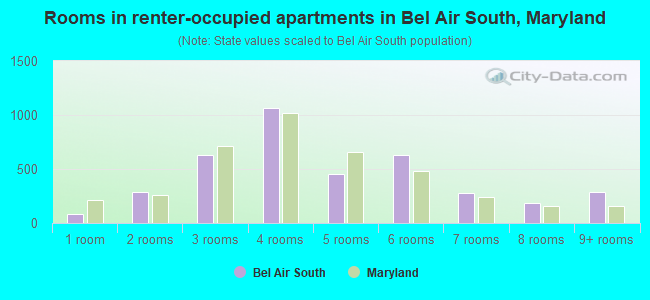
Rooms in renter-occupied houses - 1 room (%)
Rooms in renter-occupied houses - 2 rooms (%)
Rooms in renter-occupied houses - 3 rooms (%)
Rooms in renter-occupied houses - 4 rooms (%)
Rooms in renter-occupied houses - 5 rooms (%)
Rooms in renter-occupied houses - 6 rooms (%)
Rooms in renter-occupied houses - 7 rooms (%)
Rooms in renter-occupied houses - 8 rooms (%)
Rooms in renter-occupied houses - 9+ rooms (%)
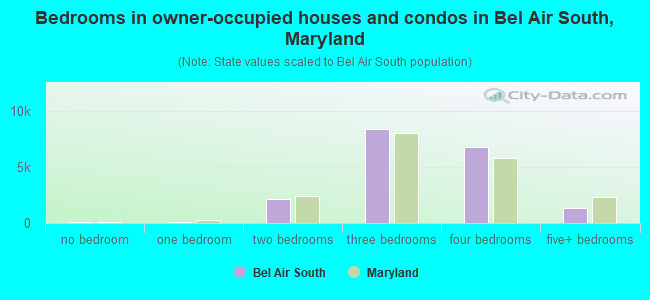
Bedrooms in owner-occupied houses - no bedrooms (%)
Bedrooms in owner-occupied houses - 1 bedroom (%)
Bedrooms in owner-occupied houses - 2 bedrooms (%)
Bedrooms in owner-occupied houses - 3 bedrooms (%)
Bedrooms in owner-occupied houses - 4 bedrooms (%)
Bedrooms in owner-occupied houses - 5+ bedrooms (%)
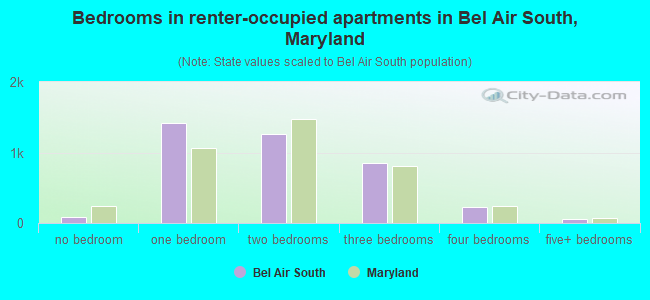
Bedrooms in renter-occupied houses - no bedrooms (%)
Bedrooms in renter-occupied houses - 1 bedroom (%)
Bedrooms in renter-occupied houses - 2 bedrooms (%)
Bedrooms in renter-occupied houses - 3 bedrooms (%)
Bedrooms in renter-occupied houses - 4 bedrooms (%)
Bedrooms in renter-occupied houses - 5+ bedrooms (%)
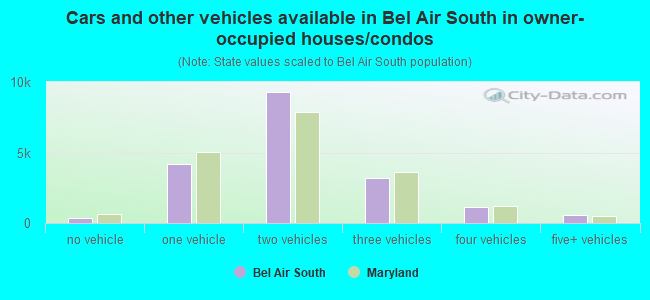
Vehicles available in owner-occupied houses - no vehicle available (%)
Vehicles available in owner-occupied houses - 1 vehicle available(%)
Vehicles available in owner-occupied houses - 2 Vehicles available (%)
Vehicles available in owner-occupied houses - 3 Vehicles available (%)
Vehicles available in owner-occupied houses - 4 Vehicles available (%)
Vehicles available in owner-occupied houses - 5+ Vehicles available (%)
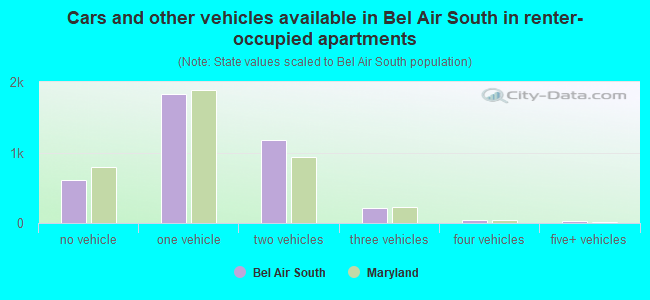
Vehicles available in renter-occupied houses - no vehicle available (%)
Vehicles available in renter-occupied houses - 1 vehicle available (%)
Vehicles available in renter-occupied houses - 2 Vehicles available (%)
Vehicles available in renter-occupied houses - 3 Vehicles available (%)
Vehicles available in renter-occupied houses - 4 Vehicles available (%)
Vehicles available in renter-occupied houses - 5+ Vehicles available (%)
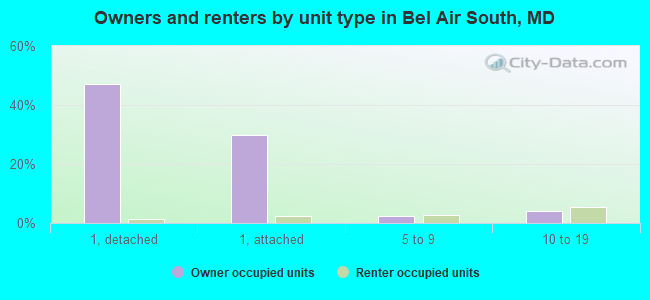
Housing units in structures - 1, detached (%)
Housing units in structures - 1, attached (%)
Housing units in structures - 2 (%)
Housing units in structures - 3 or 4 (%)
Housing units in structures - 5 to 9 (%)
Housing units in structures - 10 to 19 (%)
Housing units in structures - 20 to 49 (%)
Housing units in structures - 50 or more (%)
Housing units in structures - Mobile home (%)
Housing units in structures - Boat, RV, van, etc. (%)
Housing units in structures - Owners - 1, detached (%)
Housing units in structures - Owners - 1, attached (%)
Housing units in structures - Owners - 2 (%)
Housing units in structures - Owners - 3 or 4 (%)
Housing units in structures - Owners - 5 to 9 (%)
Housing units in structures - Owners - 10 to 19 (%)
Housing units in structures - Owners - 20 to 49 (%)
Housing units in structures - Owners - 50 or more (%)
Housing units in structures - Owners - Mobile home (%)
Housing units in structures - Owners - Boat, RV, van, etc. (%)
Housing units in structures - Renters - 1, detached (%)
Housing units in structures - Renters - 1, attached (%)
Housing units in structures - Renters - 2 (%)
Housing units in structures - Renters - 3 or 4 (%)
Housing units in structures - Renters - 5 to 9 (%)
Housing units in structures - Renters - 10 to 19 (%)
Housing units in structures - Renters - 20 to 49 (%)
Housing units in structures - Renters - 50 or more (%)
Housing units in structures - Renters - Mobile home (%)
Housing units in structures - Renters - Boat, RV, van, etc. (%)
House/condo owner moved in on average (years ago)
Renter moved in on average (years ago)
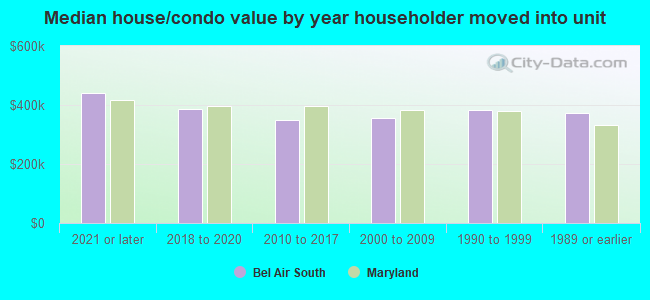
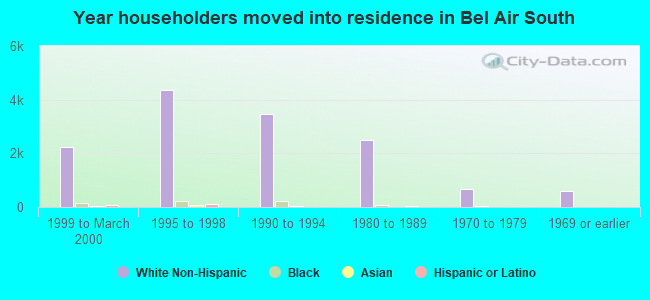
Year householder moved into unit - Moved in 1999 to March 2000 (%)
Year householder moved into unit - Moved in 1999 to March 2000 (%) - White
Year householder moved into unit - Moved in 1999 to March 2000 (%) - Black or African American
Year householder moved into unit - Moved in 1999 to March 2000 (%) - Asian
Year householder moved into unit - Moved in 1999 to March 2000 (%) - Hispanic or Latino
Year householder moved into unit - Moved in 1999 to March 2000 (%) - American Indian and Alaska Native
Year householder moved into unit - Moved in 1999 to March 2000 (%) - Multirace
Year householder moved into unit - Moved in 1999 to March 2000 (%) - Other Race
Year householder moved into unit - Moved in 1995 to 1998 (%)
Year householder moved into unit - Moved in 1995 to 1998 (%) - White
Year householder moved into unit - Moved in 1995 to 1998 (%) - Black or African American
Year householder moved into unit - Moved in 1995 to 1998 (%) - Asian
Year householder moved into unit - Moved in 1995 to 1998 (%) - Hispanic or Latino
Year householder moved into unit - Moved in 1995 to 1998 (%) - American Indian and Alaska Native
Year householder moved into unit - Moved in 1995 to 1998 (%) - Multirace
Year householder moved into unit - Moved in 1995 to 1998 (%) - Other Race
Year householder moved into unit - Moved in 1990 to 1994 (%)
Year householder moved into unit - Moved in 1990 to 1994 (%) - White
Year householder moved into unit - Moved in 1990 to 1994 (%) - Black or African American
Year householder moved into unit - Moved in 1990 to 1994 (%) - Asian
Year householder moved into unit - Moved in 1990 to 1994 (%) - Hispanic or Latino
Year householder moved into unit - Moved in 1990 to 1994 (%) - American Indian and Alaska Native
Year householder moved into unit - Moved in 1990 to 1994 (%) - Multirace
Year householder moved into unit - Moved in 1990 to 1994 (%) - Other Race
Year householder moved into unit - Moved in 1980 to 1989 (%)
Year householder moved into unit - Moved in 1980 to 1989 (%) - White
Year householder moved into unit - Moved in 1980 to 1989 (%) - Black or African American
Year householder moved into unit - Moved in 1980 to 1989 (%) - Asian
Year householder moved into unit - Moved in 1980 to 1989 (%) - Hispanic or Latino
Year householder moved into unit - Moved in 1980 to 1989 (%) - American Indian and Alaska Native
Year householder moved into unit - Moved in 1980 to 1989 (%) - Multirace
Year householder moved into unit - Moved in 1980 to 1989 (%) - Other Race
Year householder moved into unit - Moved in 1970 to 1979 (%)
Year householder moved into unit - Moved in 1970 to 1979 (%) - White
Year householder moved into unit - Moved in 1970 to 1979 (%) - Black or African American
Year householder moved into unit - Moved in 1970 to 1979 (%) - Asian
Year householder moved into unit - Moved in 1970 to 1979 (%) - Hispanic or Latino
Year householder moved into unit - Moved in 1970 to 1979 (%) - American Indian and Alaska Native
Year householder moved into unit - Moved in 1970 to 1979 (%) - Multirace
Year householder moved into unit - Moved in 1970 to 1979 (%) - Other Race
Year householder moved into unit - Moved in 1969 or earlier (%)
Year householder moved into unit - Moved in 1969 or earlier (%) - White
Year householder moved into unit - Moved in 1969 or earlier (%) - Black or African American
Year householder moved into unit - Moved in 1969 or earlier (%) - Asian
Year householder moved into unit - Moved in 1969 or earlier (%) - Hispanic or Latino
Year householder moved into unit - Moved in 1969 or earlier (%) - American Indian and Alaska Native
Year householder moved into unit - Moved in 1969 or earlier (%) - Multirace
Year householder moved into unit - Moved in 1969 or earlier (%) - Other Race
Housing units lacking complete plumbing facilities (%)
Housing units lacking complete kitchen facilities (%)
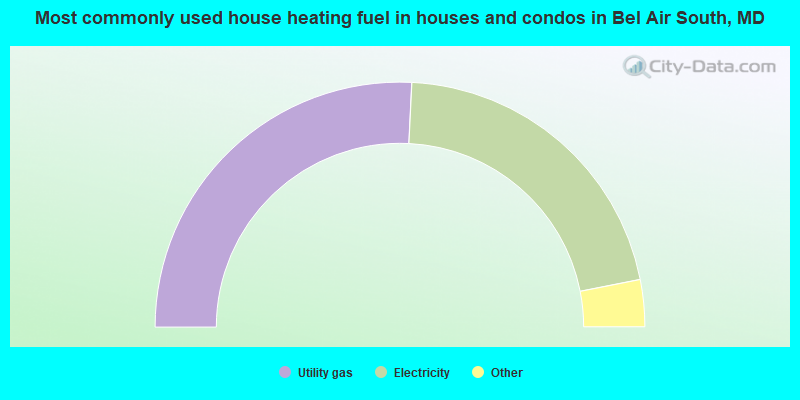
House heating fuel used in houses and condos - Utility gas (%)
House heating fuel used in houses and condos - Bottled, tank, or LP gas (%)
House heating fuel used in houses and condos - Electricity (%)
House heating fuel used in houses and condos - Fuel oil, kerosene, etc. (%)
House heating fuel used in houses and condos - Coal or coke (%)
House heating fuel used in houses and condos - Wood (%)
House heating fuel used in houses and condos - Solar energy (%)
House heating fuel used in houses and condos - Other fuel (%)
House heating fuel used in houses and condos - No fuel used (%)
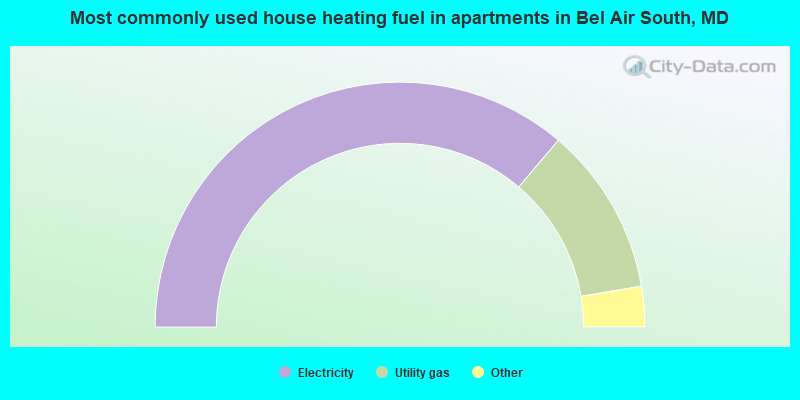
House heating fuel used in apartments - Utility gas (%)
House heating fuel used in apartments - Bottled, tank, or LP gas (%)
House heating fuel used in apartments - Electricity (%)
House heating fuel used in apartments - Fuel oil, kerosene, etc. (%)
House heating fuel used in apartments - Coal or coke (%)
House heating fuel used in apartments - Wood (%)
House heating fuel used in apartments - Solar energy (%)
House heating fuel used in apartments - Other fuel (%)
House heating fuel used in apartments - No fuel used (%)
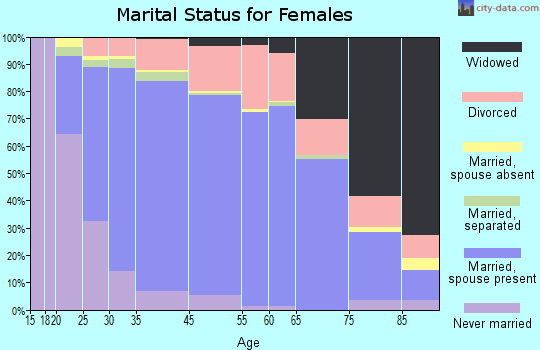
Median year house/condo built: 1994Median year apartment built: 1983Household type by relationship:
Households: 57,723
Male householders: 11,110 (1,919 living alone ), Female householders: 11,259 (3,470 living alone )12,299 spouses (12,182 opposite-sex spouses ), 1,543 unmarried partners , (1,469 opposite-sex unmarried partners ), 17,995 children (16,790 natural , 362 adopted , 841 stepchildren ), 721 grandchildren , 256 brothers or sisters , 1,034 parents , 21 foster children , 551 other relatives , 820 non-relatives In group quarters: 108
Size of family households: 6,129 2-persons , 3,828 3-persons , 3,310 4-persons , 1,411 5-persons , 569 6-persons , 100 7-or-more-persons .
Size of nonfamily households: 5,952 1-person , 1,124 2-persons , 118 3-persons , 17 4-persons , 45 5-persons , 11 6-persons .
9,783 married couples with children. single-parent households (644 men , 1,501 women ).
88.8% of residents of Bel Air South speak English at home. of residents speak Spanish at home (73% speak English very well , 21% speak English well , 6% speak English not well ).of residents speak other Indo-European language at home (76% speak English very well , 19% speak English well , 5% speak English not well ).of residents speak Asian or Pacific Island language at home (55% speak English very well , 39% speak English well , 4% speak English not well , 1% don't speak English at all ).of residents speak other language at home (70% speak English very well , 24% speak English well , 6% speak English not well ).
Foreign born population: 4,425 (7.7%)of them are naturalized citizens )
Median number of rooms in houses and condos:
Median number of rooms in apartments
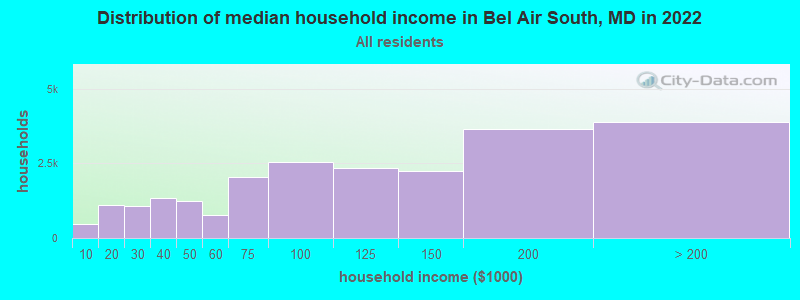
Bel Air South, MD household income distribution 485 Less than $10,0001,110 $10,000 to $19,9991,077 $20,000 to $29,9991,341 $30,000 to $39,9991,230 $40,000 to $49,999766 $50,000 to $59,9992,060 $60,000 to $74,9992,544 $75,000 to $99,9992,345 $100,000 to $124,9992,244 $125,000 to $149,9993,648 $150,000 to $199,9993,890 $200,000 or more
Home value of owner - occupied houses in 2022 in Bel Air South, MD 185 Less than $10,00037 $20,000 to $24,99990 $30,000 to $34,9994 $35,000 to $39,99957 $40,000 to $49,99924 $50,000 to $59,99918 $80,000 to $89,99922 $90,000 to $99,999113 $100,000 to $124,999169 $125,000 to $149,999384 $150,000 to $174,999551 $175,000 to $199,9991,863 $200,000 to $249,9992,675 $250,000 to $299,9994,918 $300,000 to $399,9993,529 $400,000 to $499,9993,364 $500,000 to $749,999697 $750,000 to $999,999108 $1,000,000 to $1,499,999101 $2,000,000 or moreRent paid by renters in 2022 in Bel Air South, MD 122 $150 to $19980 $200 to $24941 $250 to $29925 $300 to $3497 $350 to $3997 $450 to $49941 $500 to $54925 $550 to $59944 $600 to $6498 $650 to $699184 $800 to $899209 $900 to $999932 $1,000 to $1,249755 $1,250 to $1,499938 $1,500 to $1,999282 $2,000 to $2,4996 $2,500 to $2,99910 $3,000 to $3,499104 $3,500 or more72 No cash rent
Percentage of workers working in this county: 62.9%Number of people working at home: 5,736 (18.8% of all workers )
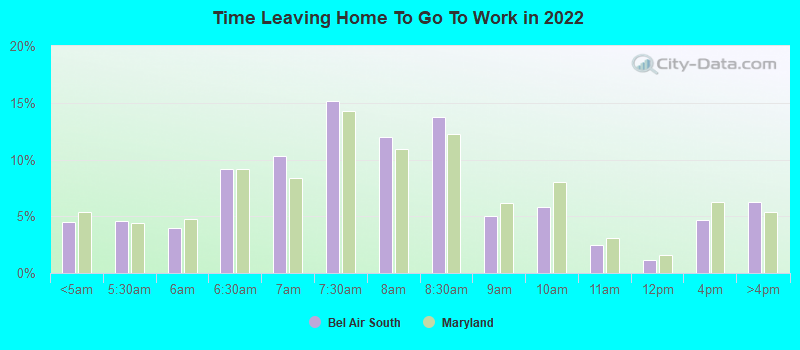
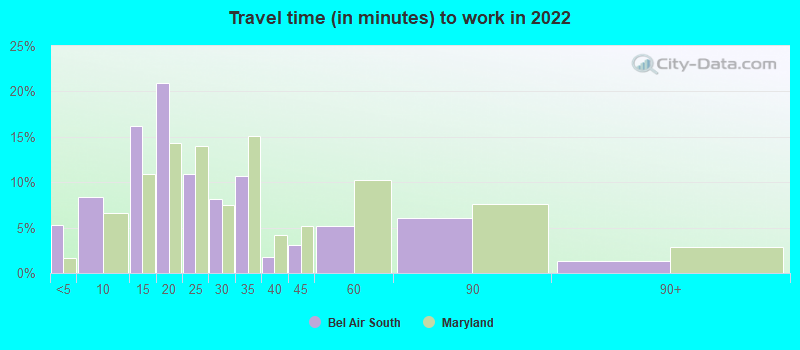
Travel time to work (commute)
Less than 5 minutes: 1,2505 to 9 minutes: 1,16810 to 14 minutes: 2,88615 to 19 minutes: 2,75820 to 24 minutes: 3,20725 to 29 minutes: 1,46830 to 34 minutes: 3,45435 to 39 minutes: 81240 to 44 minutes: 1,73045 to 59 minutes: 4,19260 to 89 minutes: 1,93290 or more minutes: 425
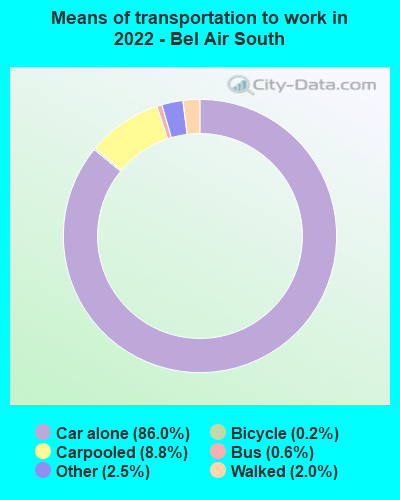
Means of transportation to work:
Drove a car alone: 7,179 (54.2%)Carpooled: 779 (5.9%)Bus : 38 (0.3%)Taxi: 236 (1.8%)Bicycle: 16 (0.1%)Walked: 158 (1.2%)Worked at home: 5,697 (43.0%)
Unemployment by race in 2022
Unemployment rate for White non-Hispanic residents 2.5% Males2.1% FemalesUnemployment rate for Black residents 7.0% Males0.9% FemalesUnemployment rate for Asian residents 6.9% Males1.1% FemalesUnemployment rate for other race residents 9.3% FemalesUnemployment rate for two or more race residents 3.4% FemalesUnemployment rate for Hispanic or Latino residents 2.5% Males3.7% Females
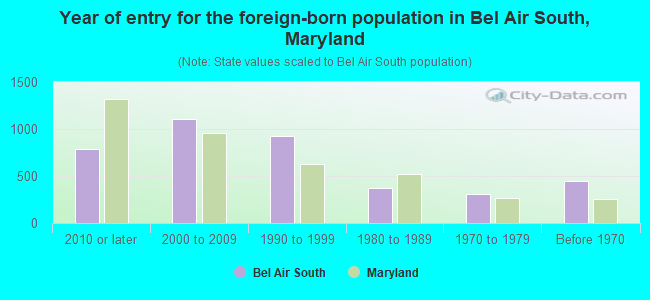
Year of entry for the foreign-born population in Bel Air South, Maryland
791 2010 or later 1,105 2000 to 2009 927 1990 to 1999 368 1980 to 1989 309 1970 to 1979 450 Before 1970
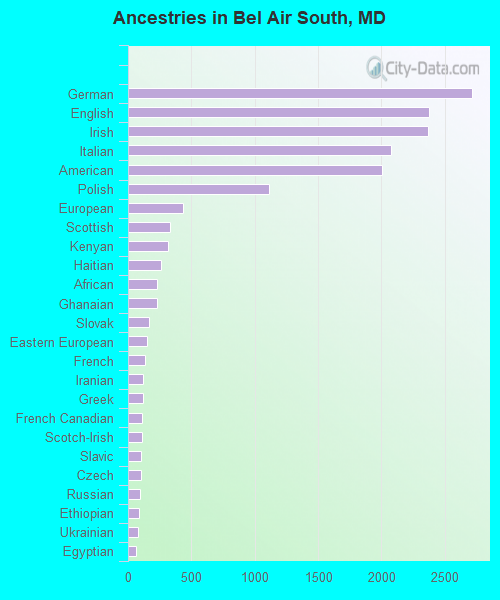
First ancestries reported:
German: 2,714 (10.2%)
English: 2,377 (9.0%)
Irish: 2,367 (8.9%)
Italian: 2,079 (7.8%)
American: 2,002 (7.5%)
Polish: 1,113 (4.2%)
European: 435 (1.6%)
Scottish: 329 (1.2%)
Kenyan: 316 (1.2%)
Haitian: 262 (1.0%)
African: 232 (0.9%)
Ghanaian: 226 (0.9%)
Slovak: 166 (0.6%)
Eastern European: 147 (0.6%)
French: 137 (0.5%)
Iranian: 122 (0.5%)
Greek: 120 (0.5%)
French Canadian: 113 (0.4%)
Scotch-Irish: 107 (0.4%)
Slavic: 104 (0.4%)
Czech: 99 (0.4%)
Russian: 93 (0.4%)
Ethiopian: 85 (0.3%)
Ukrainian: 75 (0.3%)
Egyptian: 67 (0.3%)
British: 61 (0.2%)
Swedish: 54 (0.2%)
Bulgarian: 53 (0.2%)
Welsh: 53 (0.2%)
Dutch: 49 (0.2%)
Finnish: 48 (0.2%)
Danish: 45 (0.2%)
Brazilian: 43 (0.2%)
Portuguese: 42 (0.2%)
Nigerian: 42 (0.2%)
Canadian: 38 (0.1%)
Norwegian: 32 (0.1%)
Scandinavian: 30 (0.1%)
Northern European: 30 (0.1%)
Hungarian: 28 (0.1%)
Czechoslovakian: 21 (0.08%)
South African: 19 (0.07%)
Latvian: 18 (0.07%)
Lithuanian: 18 (0.07%)
Yugoslavian: 16 (0.06%)
Trinidadian and Tobagonian: 13 (0.05%)
Lebanese: 12 (0.05%)
Pennsylvania German: 12 (0.05%)
Romanian: 11 (0.04%)
Croatian: 8 (0.03%)
Most common places of birth for foreign-born residents (%): India Bel Air South:
9.5% (374)Maryland:
6.4% (61,725)
Kenya Bel Air South:
7.7% (304)Maryland:
0.8% (7,497)
Vietnam Bel Air South:
7.5% (295)Maryland:
1.9% (18,716)
Nepal Bel Air South:
6.8% (266)Maryland:
1.1% (10,205)
Philippines Bel Air South:
5.1% (200)Maryland:
3.8% (36,698)
Korea Bel Air South:
4.3% (171)Maryland:
3.4% (32,635)
Egypt Bel Air South:
4.0% (156)Maryland:
0.5% (4,414)
China, excluding Hong Kong and Taiwan Bel Air South:
3.9% (152)Maryland:
4.6% (44,742)
Ghana Bel Air South:
3.1% (123)Maryland:
1.8% (17,774)
Iran Bel Air South:
3.1% (123)Maryland:
1.3% (12,074)
Germany Bel Air South:
2.7% (105)Maryland:
1.2% (11,265)
Bangladesh Bel Air South:
2.3% (89)Maryland:
0.7% (7,124)
Colombia Bel Air South:
2.1% (84)Maryland:
1.3% (12,898)
Canada Bel Air South:
2.1% (83)Maryland:
0.9% (8,603)
Ukraine Bel Air South:
2.1% (82)Maryland:
0.7% (6,326)
Mexico Bel Air South:
2.1% (81)Maryland:
3.5% (34,065)
Ethiopia Bel Air South:
2.0% (79)Maryland:
3.2% (30,870)
Italy Bel Air South:
1.8% (70)Maryland:
0.5% (4,596)
El Salvador Bel Air South:
1.7% (68)Maryland:
12.0% (115,412)
Place of birth for U.S.-born residents:
This state: 37,324Other state: 15,380Northeast: 7,805Midwest: 1,766South: 4,317West: 1,578 90.0% of Bel Air South residents lived in the same house 1 years ago.
Out of people who lived in different houses, 34.0% lived in this county.
Out of people who lived in different counties, 79.4% lived in Maryland.
Bel Air South:
90.0%State average:
88.5%
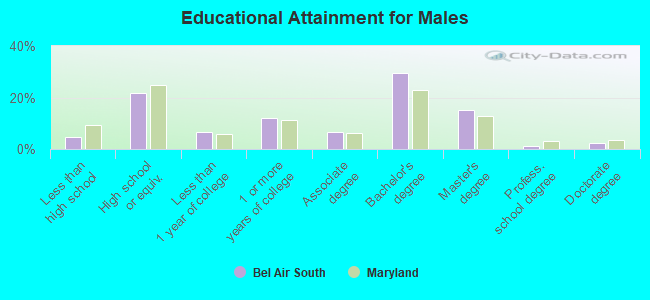
Education attainment for males 25 years and older:
No schooling: 178Nursery to 4th grade: 155th and 6th grade: 277th and 8th grade: 909th grade: 2410th grade: 10511th grade: 9212th grade, no diploma: 362High school graduate (or equivalency): 4,170Less than 1 year of college: 1,237Some college more than 1 year, no degree: 2,318Associate degree: 1,271Bachelor's degree: 5,718Master's degree: 2,954Professional school degree: 238Doctorate degree: 486
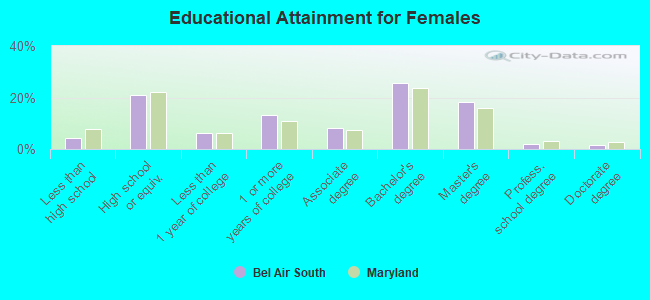
Education attainment for females 25 years and older:
No schooling: 235Nursery to 4th grade: 405th and 6th grade: 557th and 8th grade: 179th grade: 5410th grade: 3111th grade: 24612th grade, no diploma: 233High school graduate (or equivalency): 4,508Less than 1 year of college: 1,350Some college more than 1 year, no degree: 2,816Associate degree: 1,747Bachelor's degree: 5,575Master's degree: 3,979Professional school degree: 399Doctorate degree: 318
Housing units in structures:
One, detached: 11,533One, attached: 6,902Two: 93 or 4: 1045 to 9: 79810 to 19: 2,47620 to 49: 51050 or more: 581Mobile homes: 142Median worth of mobile homes: $13,451
Housing units lacking complete plumbing facilities in 2022: 0.6%Housing units lacking complete kitchen facilities in 2022: 1.3%House/condo owner moved in on average 9 years ago
Renter moved in on average 0 years ago
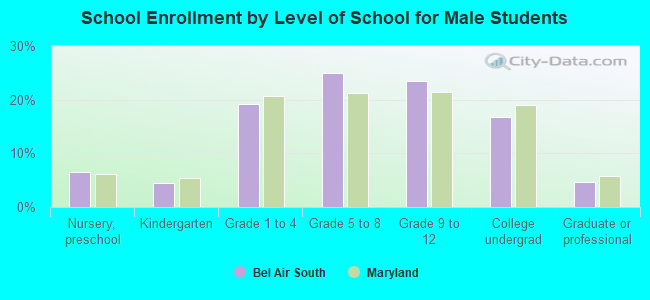
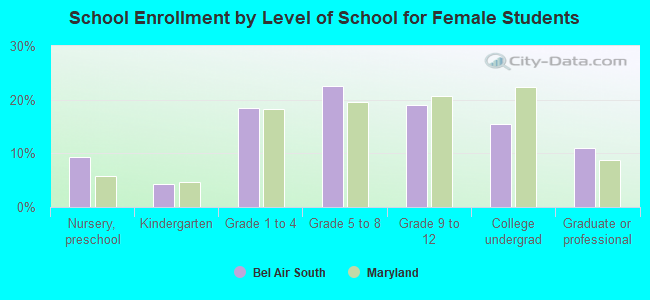
Private vs. public school enrollment:
Students in private schools in grades 1 to 8 (elementary and middle school): 784 Students in private schools in grades 9 to 12 (high school): 273 Students in private undergraduate colleges: 232