Bentonville, AR (Arkansas) Houses and Residents
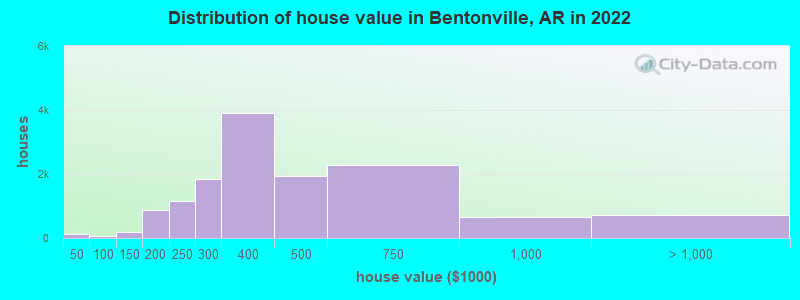
Estimated median house or condo value in 2022: $408,999 (it was $91,200 in 2000 )
Bentonville:
$408,999Arkansas:
$179,800
Lower value quartile - upper value quartile: $298,564 - $555,883Mean price in 2022: Detached houses: $318,788 Here:
$318,788State:
$243,881
Townhouses or other attached units: $168,198 Here:
$168,198State:
$244,376
Mobile homes: $65,317 Here:
$65,317State:
$79,566
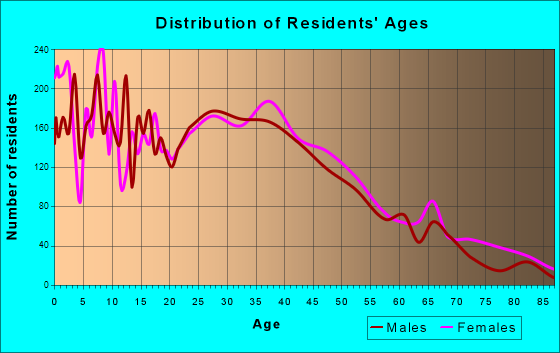
Total population: 41,613 (Urban population: 18,665, Rural population: 1,087 (35 farm, 1,052 nonfarm ))
Houses: 24,473 (22,311 occupied: 11,693 owner occupied, 10,724 renter occupied )
% of renters here:
48%State:
34%
Housing density: 1,152 houses/condos per square mile
Median price asked for vacant for-sale houses and condos in 2022: $289,999.
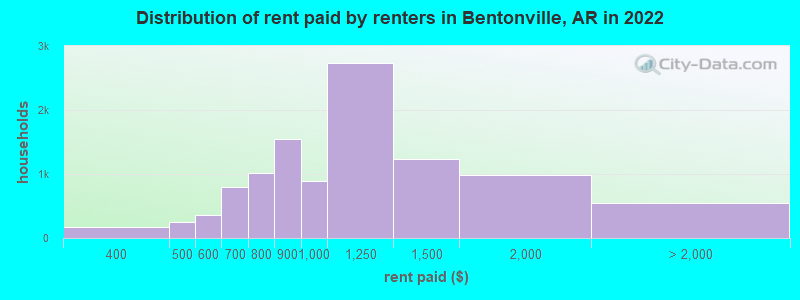
Median contract rent in 2022: $1,009 (lower quartile is $819, upper quartile is $1,247)
Median rent asked for vacant for-rent units in 2022: $1,057
Median gross rent in Bentonville, AR in 2022: $1,197
Housing units in Bentonville with a mortgage: 9,416 (598 second mortgage, 0 home equity loan, 420 both second mortgage and home equity loan )Houses without a mortgage: 16
Median household income for houses/condos with a mortgage: $142,828
Median household income for apartments without a mortgage: $100,536
Median monthly housing costs: $1,374
Data:
Median house or condo value ($)
Median house or condo value ($ change since 2000)
Median house or condo value ($) - White
Median house or condo value ($) - Black or African American
Median house or condo value ($) - Asian
Median house or condo value ($) - Hispanic or Latino
Median house or condo value ($) - American Indian and Alaska Native
Median house or condo value ($) - Multirace
Median house or condo value ($) - Other Race
Median price asked for mobile homes ($)
Household density (households per square mile)
Mean house or condo value by units in structure - 1, detached ($)
Mean house or condo value by units in structure - 1, attached ($)
Mean house or condo value by units in structure - 2 ($)
Mean house or condo value by units in structure by units in structure - 3 or 4 ($)
Mean house or condo value by units in structure - 5 or more ($)
Mean house or condo value by units in structure - Boat, RV, van, etc. ($)
Mean house or condo value by units in structure - Mobile home ($)
Median contract rent ($)
Median contract rent - Lower quartile ($)
Median contract rent - Upper quartile ($)
Median gross rent ($)
Urban houses (%)
Rural houses (%)
Houses occupied (%)
Houses occupied (% change since 2000)
Houses owner occupied (%)
Houses owner occupied (% change since 2000)
Houses renter occupied (%)
Houses renter occupied (% change since 2000)
Vacant housing units - For rent (%)
Vacant housing units - For rent (% change since 2000)
Vacant housing units - For sale only (%)
Vacant housing units - For sale only (% change since 2000)
Vacant housing units - Rented or sold, not occupied (%)
Vacant housing units - Rented or sold, not occupied (% change since 2000)
Vacant housing units - For seasonal, recreational, or occasional use (%)
Vacant housing units - For seasonal, recreational, or occasional use (% change since 2000)
Vacant housing units - For migrant workers (%)
Vacant housing units - For migrant workers (% change since 2000)
Vacant housing units - Other vacant (%)
Vacant housing units - Other vacant (% change since 2000)
Median monthly housing costs ($)
Median household income for houses/condos with a mortgage ($)
Median household income for houses/condos without a mortgage ($)
Median household income ($)
Median household income ($) - White
Median household income ($) - Black or African American
Median household income ($) - Asian
Median household income ($) - Hispanic or Latino
Median household income ($) - American Indian and Alaska Native
Median household income ($) - Multirace
Median household income ($) - Other Race
Mortgage status - with mortgage (%)
Mortgage status - with second mortgage (%)
Mortgage status - with home equity loan (%)
Mortgage status - with both second mortgage and home equity loan (%)
Mortgage status - without a mortgage (%)
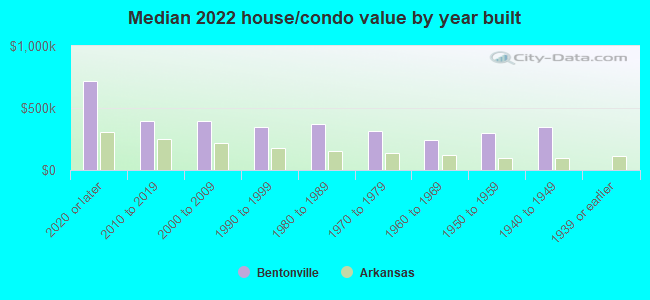
Median year house/condo built
Median year apartment built
Household type by relationship - Male householder living alone (%)
Household type by relationship - Male householder not living alone (%)
Household type by relationship - Female householder living alone (%)
Household type by relationship - Female householder not living alone (%)
Household type by relationship - Opposite-Sex spouse (%)
Household type by relationship - Same-Sex spouse (%)
Household type by relationship - Opposite-Sex unmarried partner (%)
Household type by relationship - Same-Sex unmarried partner (%)
Household type by relationship - In group quarters (%)
Size of family households - 2-person household (%)
Size of family households - 3-person household (%)
Size of family households - 4-person household (%)
Size of family households - 5-person household (%)
Size of family households - 6-person household (%)
Size of family households - 7-or-more-person household (%)
Size of nonfamily households - 1-person household (%)
Size of nonfamily households - 2-person household (%)
Size of nonfamily households - 3-person household (%)
Size of nonfamily households - 4-person household (%)
Size of nonfamily households - 5-person household (%)
Size of nonfamily households - 6-person household (%)
Size of nonfamily households - 7-or-moreperson household (%)
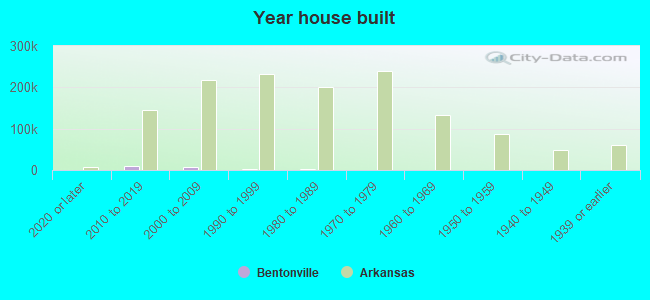
Year house built - Built 2010 or later (%)
Year house built - Built 2000 to 2009 (%)
Year house built - Built 1990 to 1999 (%)
Year house built - Built 1980 to 1989 (%)
Year house built - Built 1970 to 1979 (%)
Year house built - Built 1960 to 1969 (%)
Year house built - Built 1950 to 1959 (%)
Year house built - Built 1940 to 1949 (%)
Year house built - Built 1939 or earlier (%)
Median number of rooms in houses and condos
Median number of rooms in apartments
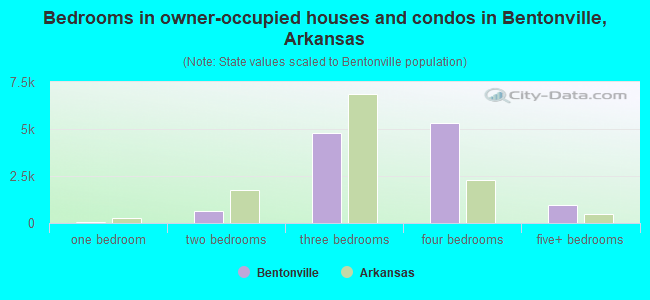
Median number of bedrooms in owner occupied houses
Mean number of bedrooms in owner occupied houses
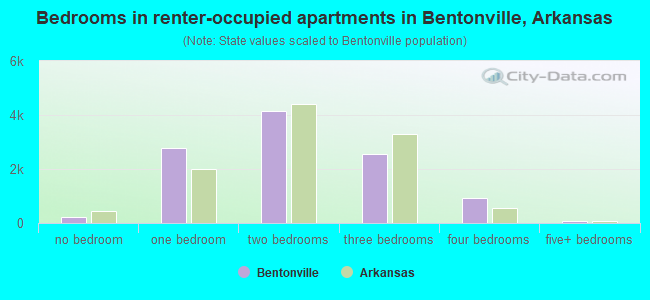
Median number of bedrooms in renter occupied houses
Mean number of bedrooms in renter occupied houses
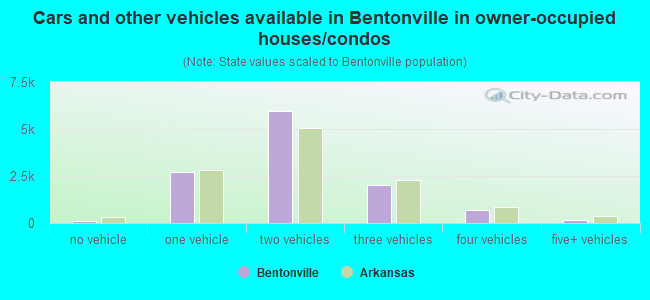
Median number of vehichles in owner occupied houses
Mean number of vehichles in owner occupied houses
Median number of vehichles in renter occupied houses
Mean number of vehichles in renter occupied houses
Rooms in owner-occupied houses - 1 room (%)
Rooms in owner-occupied houses - 2 rooms (%)
Rooms in owner-occupied houses - 3 rooms (%)
Rooms in owner-occupied houses - 4 rooms (%)
Rooms in owner-occupied houses - 5 rooms (%)
Rooms in owner-occupied houses - 6 rooms (%)
Rooms in owner-occupied houses - 7 rooms (%)
Rooms in owner-occupied houses - 8 rooms (%)
Rooms in owner-occupied houses - 9+ rooms (%)
Rooms in renter-occupied houses - 1 room (%)
Rooms in renter-occupied houses - 2 rooms (%)
Rooms in renter-occupied houses - 3 rooms (%)
Rooms in renter-occupied houses - 4 rooms (%)
Rooms in renter-occupied houses - 5 rooms (%)
Rooms in renter-occupied houses - 6 rooms (%)
Rooms in renter-occupied houses - 7 rooms (%)
Rooms in renter-occupied houses - 8 rooms (%)
Rooms in renter-occupied houses - 9+ rooms (%)
Bedrooms in owner-occupied houses - no bedrooms (%)
Bedrooms in owner-occupied houses - 1 bedroom (%)
Bedrooms in owner-occupied houses - 2 bedrooms (%)
Bedrooms in owner-occupied houses - 3 bedrooms (%)
Bedrooms in owner-occupied houses - 4 bedrooms (%)
Bedrooms in owner-occupied houses - 5+ bedrooms (%)
Bedrooms in renter-occupied houses - no bedrooms (%)
Bedrooms in renter-occupied houses - 1 bedroom (%)
Bedrooms in renter-occupied houses - 2 bedrooms (%)
Bedrooms in renter-occupied houses - 3 bedrooms (%)
Bedrooms in renter-occupied houses - 4 bedrooms (%)
Bedrooms in renter-occupied houses - 5+ bedrooms (%)
Vehicles available in owner-occupied houses - no vehicle available (%)
Vehicles available in owner-occupied houses - 1 vehicle available(%)
Vehicles available in owner-occupied houses - 2 Vehicles available (%)
Vehicles available in owner-occupied houses - 3 Vehicles available (%)
Vehicles available in owner-occupied houses - 4 Vehicles available (%)
Vehicles available in owner-occupied houses - 5+ Vehicles available (%)
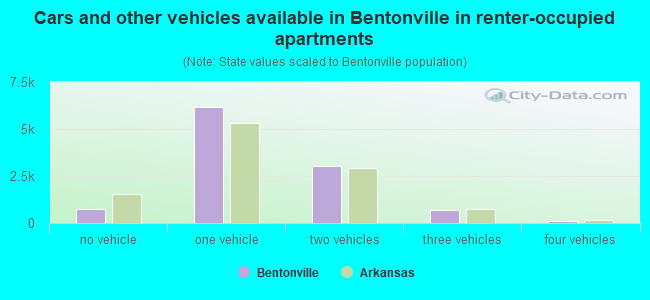
Vehicles available in renter-occupied houses - no vehicle available (%)
Vehicles available in renter-occupied houses - 1 vehicle available (%)
Vehicles available in renter-occupied houses - 2 Vehicles available (%)
Vehicles available in renter-occupied houses - 3 Vehicles available (%)
Vehicles available in renter-occupied houses - 4 Vehicles available (%)
Vehicles available in renter-occupied houses - 5+ Vehicles available (%)
Housing units in structures - 1, detached (%)
Housing units in structures - 1, attached (%)
Housing units in structures - 2 (%)
Housing units in structures - 3 or 4 (%)
Housing units in structures - 5 to 9 (%)
Housing units in structures - 10 to 19 (%)
Housing units in structures - 20 to 49 (%)
Housing units in structures - 50 or more (%)
Housing units in structures - Mobile home (%)
Housing units in structures - Boat, RV, van, etc. (%)
Housing units in structures - Owners - 1, detached (%)
Housing units in structures - Owners - 1, attached (%)
Housing units in structures - Owners - 2 (%)
Housing units in structures - Owners - 3 or 4 (%)
Housing units in structures - Owners - 5 to 9 (%)
Housing units in structures - Owners - 10 to 19 (%)
Housing units in structures - Owners - 20 to 49 (%)
Housing units in structures - Owners - 50 or more (%)
Housing units in structures - Owners - Mobile home (%)
Housing units in structures - Owners - Boat, RV, van, etc. (%)
Housing units in structures - Renters - 1, detached (%)
Housing units in structures - Renters - 1, attached (%)
Housing units in structures - Renters - 2 (%)
Housing units in structures - Renters - 3 or 4 (%)
Housing units in structures - Renters - 5 to 9 (%)
Housing units in structures - Renters - 10 to 19 (%)
Housing units in structures - Renters - 20 to 49 (%)
Housing units in structures - Renters - 50 or more (%)
Housing units in structures - Renters - Mobile home (%)
Housing units in structures - Renters - Boat, RV, van, etc. (%)
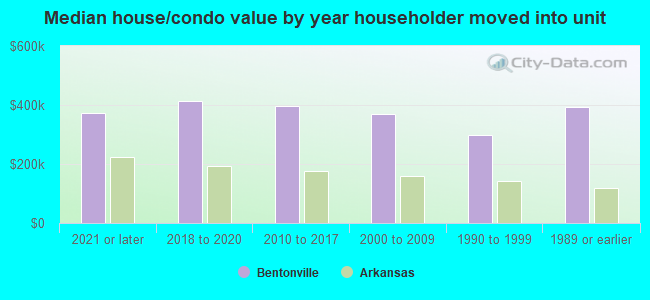
House/condo owner moved in on average (years ago)
Renter moved in on average (years ago)
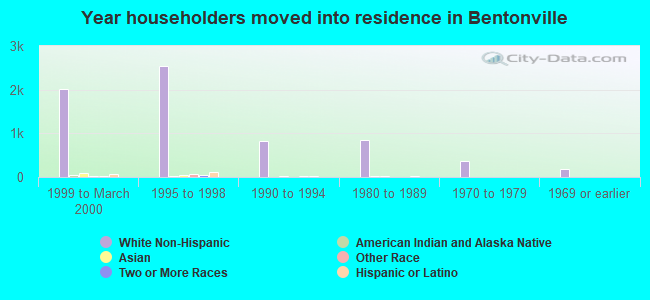
Year householder moved into unit - Moved in 1999 to March 2000 (%)
Year householder moved into unit - Moved in 1999 to March 2000 (%) - White
Year householder moved into unit - Moved in 1999 to March 2000 (%) - Black or African American
Year householder moved into unit - Moved in 1999 to March 2000 (%) - Asian
Year householder moved into unit - Moved in 1999 to March 2000 (%) - Hispanic or Latino
Year householder moved into unit - Moved in 1999 to March 2000 (%) - American Indian and Alaska Native
Year householder moved into unit - Moved in 1999 to March 2000 (%) - Multirace
Year householder moved into unit - Moved in 1999 to March 2000 (%) - Other Race
Year householder moved into unit - Moved in 1995 to 1998 (%)
Year householder moved into unit - Moved in 1995 to 1998 (%) - White
Year householder moved into unit - Moved in 1995 to 1998 (%) - Black or African American
Year householder moved into unit - Moved in 1995 to 1998 (%) - Asian
Year householder moved into unit - Moved in 1995 to 1998 (%) - Hispanic or Latino
Year householder moved into unit - Moved in 1995 to 1998 (%) - American Indian and Alaska Native
Year householder moved into unit - Moved in 1995 to 1998 (%) - Multirace
Year householder moved into unit - Moved in 1995 to 1998 (%) - Other Race
Year householder moved into unit - Moved in 1990 to 1994 (%)
Year householder moved into unit - Moved in 1990 to 1994 (%) - White
Year householder moved into unit - Moved in 1990 to 1994 (%) - Black or African American
Year householder moved into unit - Moved in 1990 to 1994 (%) - Asian
Year householder moved into unit - Moved in 1990 to 1994 (%) - Hispanic or Latino
Year householder moved into unit - Moved in 1990 to 1994 (%) - American Indian and Alaska Native
Year householder moved into unit - Moved in 1990 to 1994 (%) - Multirace
Year householder moved into unit - Moved in 1990 to 1994 (%) - Other Race
Year householder moved into unit - Moved in 1980 to 1989 (%)
Year householder moved into unit - Moved in 1980 to 1989 (%) - White
Year householder moved into unit - Moved in 1980 to 1989 (%) - Black or African American
Year householder moved into unit - Moved in 1980 to 1989 (%) - Asian
Year householder moved into unit - Moved in 1980 to 1989 (%) - Hispanic or Latino
Year householder moved into unit - Moved in 1980 to 1989 (%) - American Indian and Alaska Native
Year householder moved into unit - Moved in 1980 to 1989 (%) - Multirace
Year householder moved into unit - Moved in 1980 to 1989 (%) - Other Race
Year householder moved into unit - Moved in 1970 to 1979 (%)
Year householder moved into unit - Moved in 1970 to 1979 (%) - White
Year householder moved into unit - Moved in 1970 to 1979 (%) - Black or African American
Year householder moved into unit - Moved in 1970 to 1979 (%) - Asian
Year householder moved into unit - Moved in 1970 to 1979 (%) - Hispanic or Latino
Year householder moved into unit - Moved in 1970 to 1979 (%) - American Indian and Alaska Native
Year householder moved into unit - Moved in 1970 to 1979 (%) - Multirace
Year householder moved into unit - Moved in 1970 to 1979 (%) - Other Race
Year householder moved into unit - Moved in 1969 or earlier (%)
Year householder moved into unit - Moved in 1969 or earlier (%) - White
Year householder moved into unit - Moved in 1969 or earlier (%) - Black or African American
Year householder moved into unit - Moved in 1969 or earlier (%) - Asian
Year householder moved into unit - Moved in 1969 or earlier (%) - Hispanic or Latino
Year householder moved into unit - Moved in 1969 or earlier (%) - American Indian and Alaska Native
Year householder moved into unit - Moved in 1969 or earlier (%) - Multirace
Year householder moved into unit - Moved in 1969 or earlier (%) - Other Race
Housing units lacking complete plumbing facilities (%)
Housing units lacking complete kitchen facilities (%)
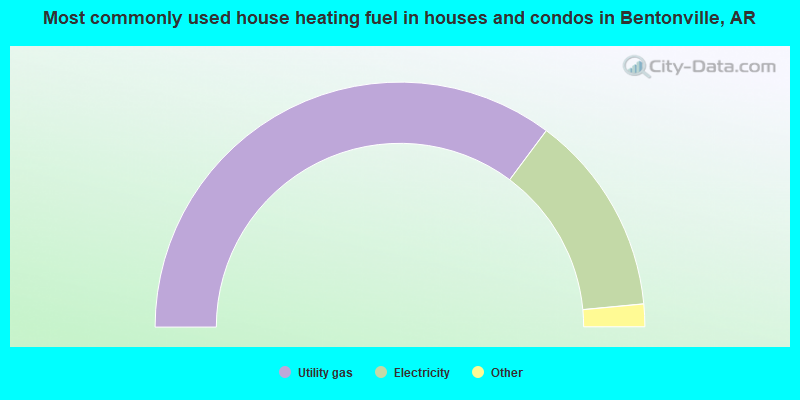
House heating fuel used in houses and condos - Utility gas (%)
House heating fuel used in houses and condos - Bottled, tank, or LP gas (%)
House heating fuel used in houses and condos - Electricity (%)
House heating fuel used in houses and condos - Fuel oil, kerosene, etc. (%)
House heating fuel used in houses and condos - Coal or coke (%)
House heating fuel used in houses and condos - Wood (%)
House heating fuel used in houses and condos - Solar energy (%)
House heating fuel used in houses and condos - Other fuel (%)
House heating fuel used in houses and condos - No fuel used (%)
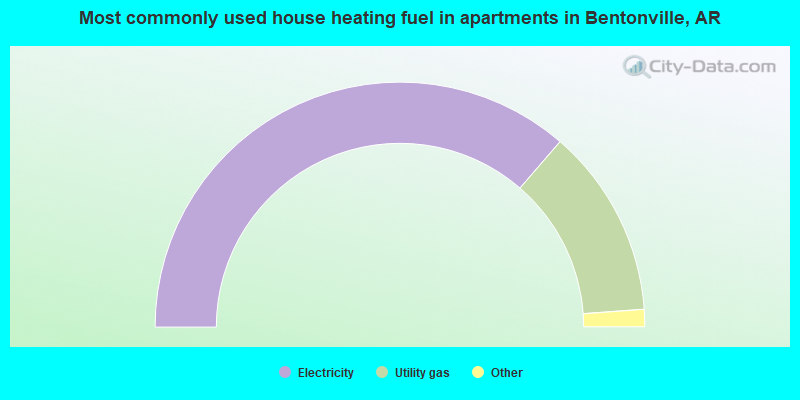
House heating fuel used in apartments - Utility gas (%)
House heating fuel used in apartments - Bottled, tank, or LP gas (%)
House heating fuel used in apartments - Electricity (%)
House heating fuel used in apartments - Fuel oil, kerosene, etc. (%)
House heating fuel used in apartments - Coal or coke (%)
House heating fuel used in apartments - Wood (%)
House heating fuel used in apartments - Solar energy (%)
House heating fuel used in apartments - Other fuel (%)
House heating fuel used in apartments - No fuel used (%)
Latest news about housing in Bentonville, AR collected exclusively by city-data.com from local newspapers, TV, and radio stations
Median year house/condo built: 2008Median year apartment built: 2010Household type by relationship:
Households: 57,620
Male householders: 12,002 (3,144 living alone ), Female householders: 10,026 (2,941 living alone )10,982 spouses (10,949 opposite-sex spouses ), 1,204 unmarried partners , (1,189 opposite-sex unmarried partners ), 18,536 children (17,588 natural , 234 adopted , 713 stepchildren ), 690 grandchildren , 554 brothers or sisters , 831 parents , 54 foster children , 246 other relatives , 1,606 non-relatives In group quarters: 882
Size of family households: 5,275 2-persons , 3,828 3-persons , 3,151 4-persons , 1,590 5-persons , 567 6-persons , 120 7-or-more-persons .
Size of nonfamily households: 6,661 1-person , 1,087 2-persons , 73 3-persons , 10 4-persons , 77 5-persons .
11,102 married couples with children. single-parent households (650 men , 1,836 women ).
84.1% of residents of Bentonville speak English at home. of residents speak Spanish at home (78% speak English very well , 12% speak English well , 8% speak English not well , 2% don't speak English at all ).of residents speak other Indo-European language at home (87% speak English very well , 9% speak English well , 4% speak English not well ).of residents speak Asian or Pacific Island language at home (67% speak English very well , 20% speak English well , 12% speak English not well , 1% don't speak English at all ).of residents speak other language at home (79% speak English very well , 12% speak English well , 9% speak English not well ).
Foreign born population: 9,779 (17.0%)of them are naturalized citizens )
Median number of rooms in houses and condos:
Median number of rooms in apartments
Owner-occupied Renter-occupied
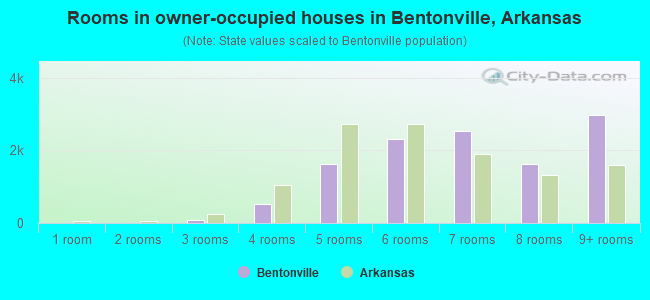
Rooms in owner-occupied houses in Bentonville, Arkansas
0 1 room 0 2 rooms 85 3 rooms 525 4 rooms 1,624 5 rooms 2,321 6 rooms 2,541 7 rooms 1,619 8 rooms 2,979 9+ rooms
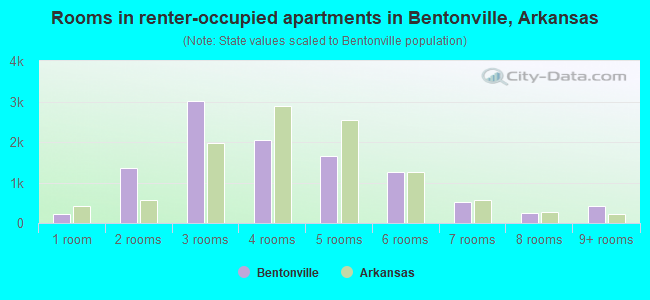
Rooms in renter-occupied apartments in Bentonville, Arkansas
214 1 room 1,363 2 rooms 3,013 3 rooms 2,042 4 rooms 1,647 5 rooms 1,255 6 rooms 517 7 rooms 257 8 rooms 416 9+ rooms
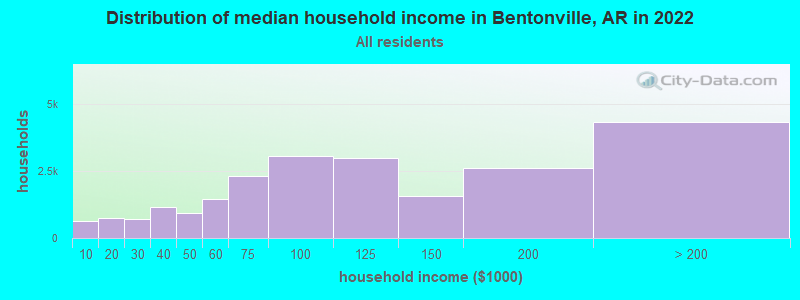
Bentonville, AR household income distribution 629 Less than $10,000735 $10,000 to $19,999693 $20,000 to $29,9991,166 $30,000 to $39,999940 $40,000 to $49,9991,441 $50,000 to $59,9992,310 $60,000 to $74,9993,057 $75,000 to $99,9992,991 $100,000 to $124,9991,575 $125,000 to $149,9992,604 $150,000 to $199,9994,331 $200,000 or more
Home value of owner - occupied houses in 2022 in Bentonville, AR 30 Less than $10,00049 $10,000 to $14,99929 $15,000 to $19,99912 $25,000 to $29,99915 $60,000 to $69,99928 $80,000 to $89,99930 $90,000 to $99,99986 $100,000 to $124,99987 $125,000 to $149,999556 $150,000 to $174,999310 $175,000 to $199,9991,140 $200,000 to $249,9991,832 $250,000 to $299,9993,904 $300,000 to $399,9991,924 $400,000 to $499,9992,289 $500,000 to $749,999650 $750,000 to $999,999560 $1,000,000 to $1,499,999152 $1,500,000 to $1,999,99919 $2,000,000 or moreRent paid by renters in 2022 in Bentonville, AR 23 Less than $10012 $100 to $1499 $150 to $19920 $300 to $349155 $350 to $399163 $400 to $44988 $450 to $499180 $500 to $549180 $550 to $599381 $600 to $649412 $650 to $699625 $700 to $749386 $750 to $7991,546 $800 to $899886 $900 to $9992,738 $1,000 to $1,2491,226 $1,250 to $1,499979 $1,500 to $1,999126 $2,000 to $2,49916 $2,500 to $2,99919 $3,500 or more378 No cash rent
Percentage of workers working in this county: 92.7%Number of people working at home: 6,979 (22.4% of all workers )
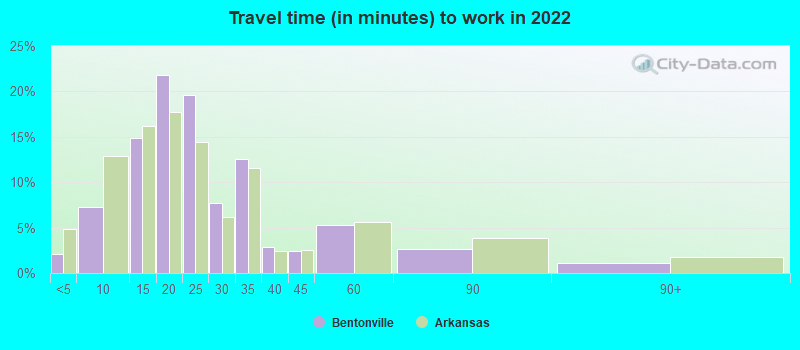
Travel time to work (commute)
Less than 5 minutes: 7825 to 9 minutes: 3,02610 to 14 minutes: 4,46815 to 19 minutes: 5,99220 to 24 minutes: 4,11725 to 29 minutes: 1,26430 to 34 minutes: 2,48535 to 39 minutes: 50540 to 44 minutes: 42945 to 59 minutes: 61960 to 89 minutes: 26590 or more minutes: 384
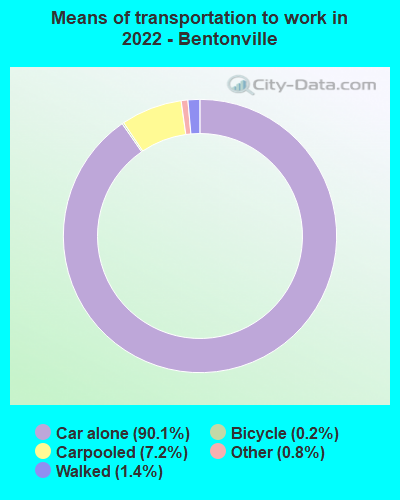
Means of transportation to work:
Drove a car alone: 41,014 (77.4%)Carpooled: 3,152 (5.9%)Bus : 62 (0.1%)Subway or elevated rail : 33 (0.1%)Taxi: 425 (0.8%)Bicycle: 104 (0.2%)Walked: 1,053 (2.0%)Worked at home: 6,979 (13.2%)
Unemployment by race in 2022
Unemployment rate for White non-Hispanic residents 4.5% Males3.2% FemalesUnemployment rate for Black residents 2.1% MalesUnemployment rate for Asian residents 1.3% Males4.3% FemalesUnemployment rate for other race residents 9.0% MalesUnemployment rate for two or more race residents 2.0% Males0.9% FemalesUnemployment rate for Hispanic or Latino residents 5.6% Males0.3% Females
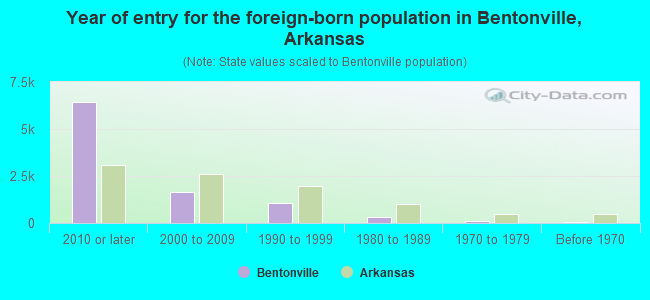
Year of entry for the foreign-born population in Bentonville, Arkansas
6,416 2010 or later 1,642 2000 to 2009 1,070 1990 to 1999 342 1980 to 1989 114 1970 to 1979 43 Before 1970
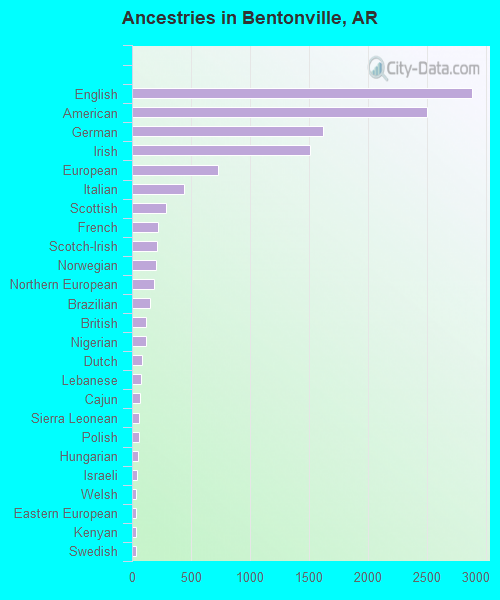
First ancestries reported:
English: 2,885 (11.3%)
American: 2,504 (9.8%)
German: 1,623 (6.3%)
Irish: 1,514 (5.9%)
European: 729 (2.8%)
Italian: 443 (1.7%)
Scottish: 287 (1.1%)
French: 218 (0.9%)
Scotch-Irish: 211 (0.8%)
Norwegian: 207 (0.8%)
Northern European: 186 (0.7%)
Brazilian: 155 (0.6%)
British: 122 (0.5%)
Nigerian: 121 (0.5%)
Dutch: 89 (0.3%)
Lebanese: 77 (0.3%)
Cajun: 67 (0.3%)
Sierra Leonean: 63 (0.2%)
Polish: 61 (0.2%)
Hungarian: 55 (0.2%)
Israeli: 46 (0.2%)
Welsh: 36 (0.1%)
Eastern European: 31 (0.1%)
Kenyan: 31 (0.1%)
Swedish: 30 (0.1%)
French Canadian: 26 (0.1%)
Ethiopian: 26 (0.1%)
Russian: 23 (0.09%)
African: 22 (0.09%)
Portuguese: 20 (0.08%)
Liberian: 19 (0.07%)
Czech: 15 (0.06%)
Scandinavian: 15 (0.06%)
Danish: 13 (0.05%)
Ukrainian: 12 (0.05%)
Greek: 11 (0.04%)
Swiss: 11 (0.04%) Most common places of birth for foreign-born residents (%): India Bentonville:
52.5% (4,802)Arkansas:
6.1% (9,278)
Mexico Bentonville:
12.6% (1,154)Arkansas:
40.2% (61,075)
Brazil Bentonville:
7.6% (699)Arkansas:
1.0% (1,447)
Vietnam Bentonville:
3.1% (280)Arkansas:
2.7% (4,028)
Korea Bentonville:
2.1% (191)Arkansas:
1.2% (1,813)
Australia Bentonville:
1.6% (150)Arkansas:
0.2% (371)
Dominican Republic Bentonville:
1.6% (147)Arkansas:
0.3% (403)
Cuba Bentonville:
1.5% (141)Arkansas:
0.3% (455)
Place of birth for U.S.-born residents:
This state: 20,621Other state: 26,654Northeast: 2,261Midwest: 8,803South: 9,278West: 6,386 84.0% of Bentonville residents lived in the same house 1 years ago.
Out of people who lived in different houses, 33.5% lived in this county.
Out of people who lived in different counties, 36.3% lived in Arkansas.
Bentonville:
84.0%State average:
87.0%
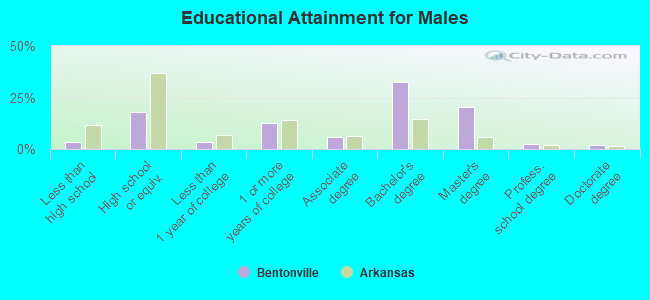
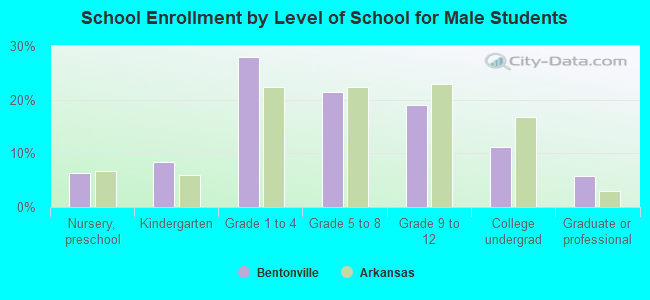
Education attainment for males 25 years and older:
No schooling: 77Nursery to 4th grade: 645th and 6th grade: 207th and 8th grade: 569th grade: 3110th grade: 9911th grade: 16712th grade, no diploma: 138High school graduate (or equivalency): 3,448Less than 1 year of college: 702Some college more than 1 year, no degree: 2,409Associate degree: 1,078Bachelor's degree: 6,305Master's degree: 3,889Professional school degree: 462Doctorate degree: 330
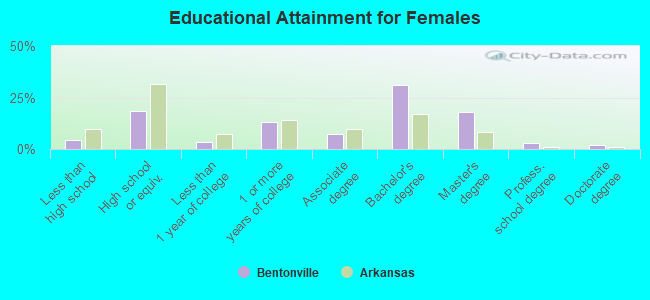
Education attainment for females 25 years and older:
No schooling: 56Nursery to 4th grade: 425th and 6th grade: 207th and 8th grade: 1189th grade: 5810th grade: 21711th grade: 18912th grade, no diploma: 98High school graduate (or equivalency): 3,458Less than 1 year of college: 639Some college more than 1 year, no degree: 2,433Associate degree: 1,394Bachelor's degree: 5,831Master's degree: 3,337Professional school degree: 512Doctorate degree: 327
Housing units in structures:
One, detached: 15,205One, attached: 1,237Two: 7843 or 4: 1,1975 to 9: 96010 to 19: 3,33620 to 49: 97050 or more: 590Mobile homes: 189Median worth of mobile homes: $10,200
Housing units lacking complete plumbing facilities in 2022: 1.7%Housing units lacking complete kitchen facilities in 2022: 3.1%House/condo owner moved in on average 6 years ago
Renter moved in on average 1 years ago
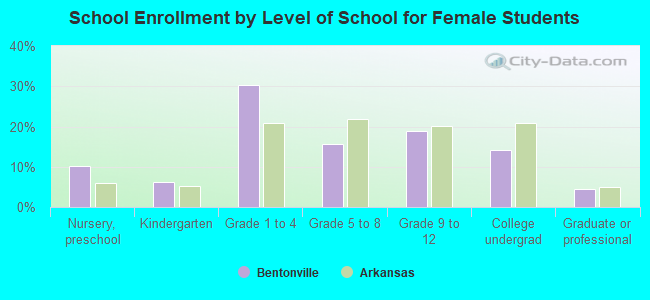
Private vs. public school enrollment:
Students in private schools in grades 1 to 8 (elementary and middle school): 1,077 Students in private schools in grades 9 to 12 (high school): 140 Students in private undergraduate colleges: 230