Blackwell-Nolan, TX (Texas) Houses and Residents
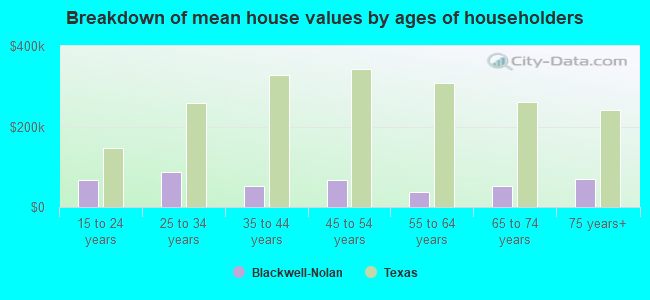
| Blackwell-Nolan: | $101,516 |
| Texas: | $275,400 |
Total population: 684 (Urban population: 0, Rural population: 741 (56 farm, 685 nonfarm))
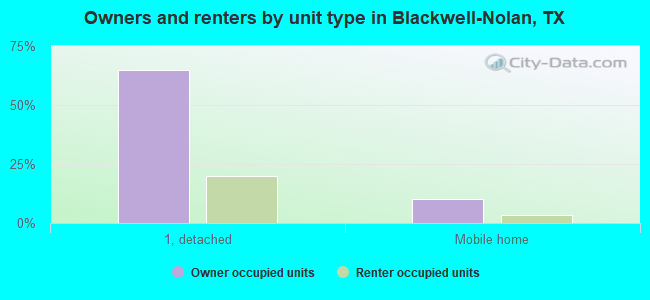
Houses: 394 (314 occupied: 240 owner occupied, 74 renter occupied)
| % of renters here: | 24% |
| State: | 38% |
Housing density: 1 houses/condos per square mile
Median price asked for vacant for-sale houses and condos in 2022 in this county: $141,742.
Median contract rent in 2022: $464 (lower quartile is $325, upper quartile is $651)
Median rent asked for vacant for-rent units in 2022: $633
Median gross rent in Blackwell-Nolan, TX in 2022: $719
Housing units in Blackwell-Nolan with a mortgage: 14 (0 second mortgage, 0 home equity loan, 0 both second mortgage and home equity loan)
Houses without a mortgage: 123


Household type by relationship:
Households: 14,806- In family households: 12,532 (2,785 male householders, 1,236 female householders)
2,875 spouses, 4,311 children (3,894 natural, 106 adopted, 311 stepchildren), 472 grandchildren, 119 brothers or sisters, 110 parents, foster children, 196 other relatives, 336 non-relatives
- In nonfamily households: 2,274 (962 male householders (814 living alone)), 1,016 female householders (916 living alone)), 296 nonrelatives
- In group quarters: 410 (177 institutionalized population)
2,583 married couples with children.
1,153 single-parent households (218 men, 935 women).
87.8% of residents of Blackwell-Nolan speak English at home.
11.1% of residents speak Spanish at home (55% speak English very well, 39% speak English well, 5% speak English not well).
0.9% of residents speak other Indo-European language at home (50% speak English very well, 50% speak English well).
0.3% of residents speak Asian or Pacific Island language at home (100% speak English very well).
Foreign born population: 47 (4.7%)
(93.6% of them are naturalized citizens)
| Here: | 6.0 |
| State: | 6.3 |
| Here: | 4.8 |
| State: | 4.0 |
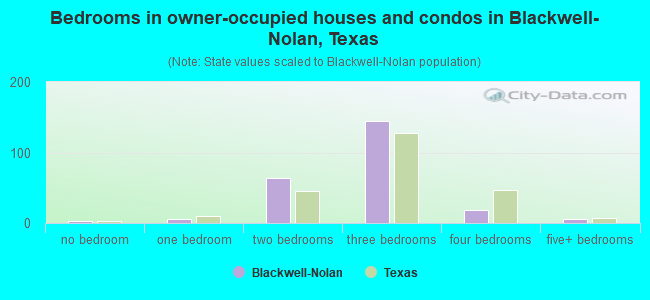
- Bedrooms in owner-occupied houses and condos in Blackwell-Nolan, Texas
- 3no bedroom
- 51 bedroom
- 642 bedrooms
- 1443 bedrooms
- 194 bedrooms
- 55+ bedrooms
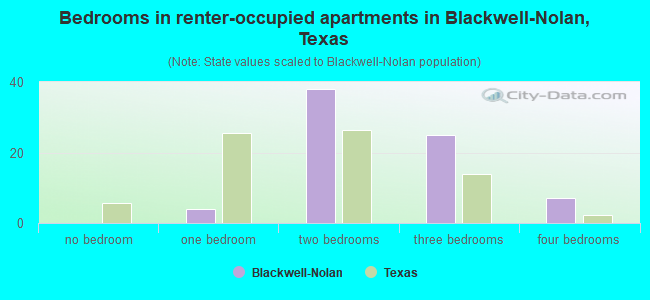
- Bedrooms in renter-occupied apartments in Blackwell-Nolan, Texas
- 0no bedroom
- 41 bedroom
- 382 bedrooms
- 253 bedrooms
- 74 bedrooms
- 05+ bedrooms
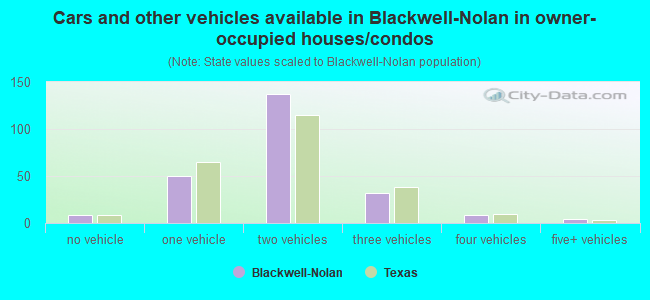
- Cars and other vehicles available in Blackwell-Nolan in owner-occupied houses/condos
- 9no vehicle
- 501 vehicle
- 1372 vehicles
- 323 vehicles
- 84 vehicles
- 45+ vehicles
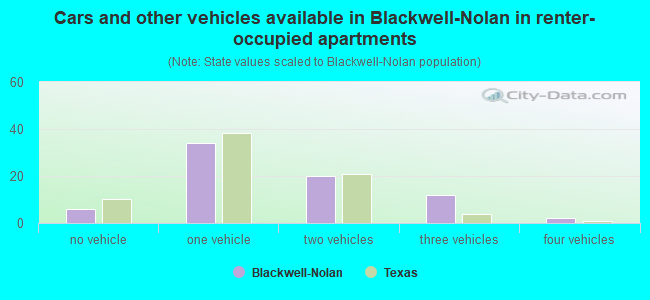
- Cars and other vehicles available in Blackwell-Nolan in renter-occupied apartments
- 6no vehicle
- 341 vehicle
- 202 vehicles
- 123 vehicles
- 24 vehicles
- 05+ vehicles
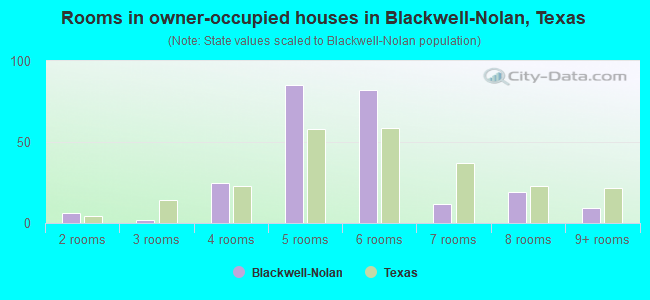
- Rooms in owner-occupied houses in Blackwell-Nolan, Texas
- 01 room
- 62 rooms
- 23 rooms
- 254 rooms
- 855 rooms
- 826 rooms
- 127 rooms
- 198 rooms
- 99+ rooms
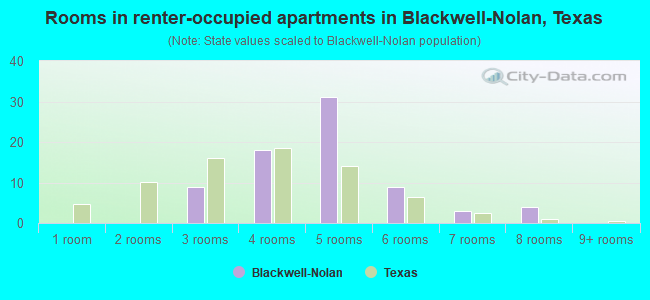
- Rooms in renter-occupied apartments in Blackwell-Nolan, Texas
- 01 room
- 02 rooms
- 93 rooms
- 184 rooms
- 315 rooms
- 96 rooms
- 37 rooms
- 48 rooms
- 09+ rooms
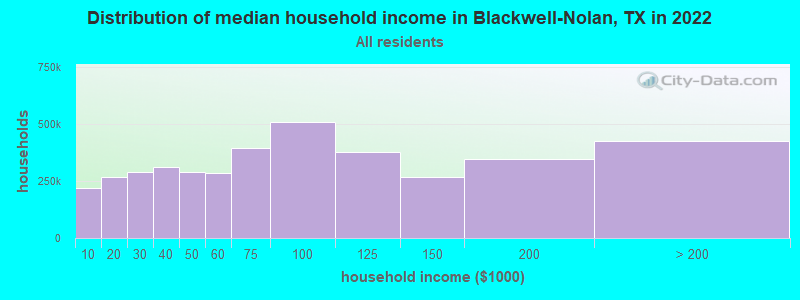
Blackwell-Nolan, TX household income distribution

- 64,493Less than $10,000
- 87,679$10,000 to $19,999
- 95,385$20,000 to $29,999
- 100,465$30,000 to $39,999
- 94,785$40,000 to $49,999
- 90,968$50,000 to $59,999
- 125,927$60,000 to $74,999
- 172,423$75,000 to $99,999
- 130,706$100,000 to $124,999
- 96,362$125,000 to $149,999
- 112,059$150,000 to $199,999
- 125,958$200,000 or more
Percentage of workers working in this county: 67.8%
Number of people working at home: 42 (10.9% of all workers)
Travel time to work (commute)
- Less than 5 minutes: 27
- 5 to 9 minutes: 15
- 10 to 14 minutes: 18
- 15 to 19 minutes: 20
- 20 to 24 minutes: 37
- 25 to 29 minutes: 10
- 30 to 34 minutes: 59
- 35 to 39 minutes: 10
- 40 to 44 minutes: 2
- 45 to 59 minutes: 38
- 60 to 89 minutes: 20
- 90 or more minutes: 6
Means of transportation to work:
- Drove a car alone: 209 (74.1%)
- Carpooled: 40 (14.2%)
- Walked: 13 (4.6%)
- Worked at home: 20 (7.1%)
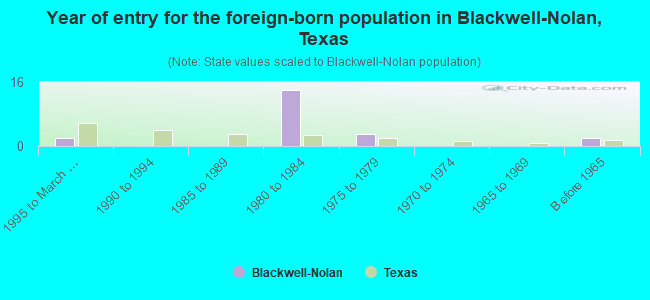
- Year of entry for the foreign-born population in Blackwell-Nolan, Texas
- 21995 to March 2000
- 01990 to 1994
- 01985 to 1989
- 141980 to 1984
- 31975 to 1979
- 01970 to 1974
- 01965 to 1969
- 2Before 1965
Most common places of birth for foreign-born residents (%):
| Blackwell-Nolan: | 76.2% (16) |
| Texas: | 64.8% (1,879,369) |
| Blackwell-Nolan: | 14.3% (3) |
| Texas: | 1.2% (36,176) |
| Blackwell-Nolan: | 9.5% (2) |
| Texas: | 0.3% (7,514) |
Place of birth for U.S.-born residents:
- This state: 623
- Other state: 92
- Northeast: 21
- Midwest: 19
- South: 30
- West: 22
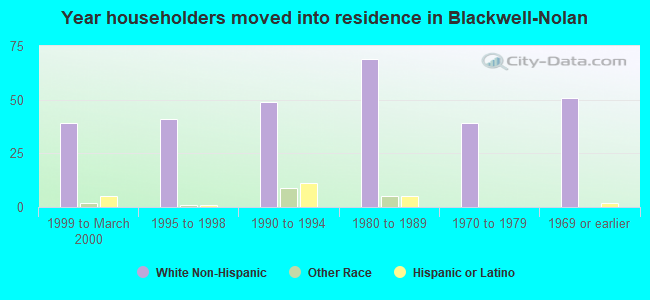
71% of Blackwell-Nolan residents lived in the same house 5 years ago.
Out of people who lived in different houses, 32% lived in this county.
Out of people who lived in different counties, 75% lived in Texas.
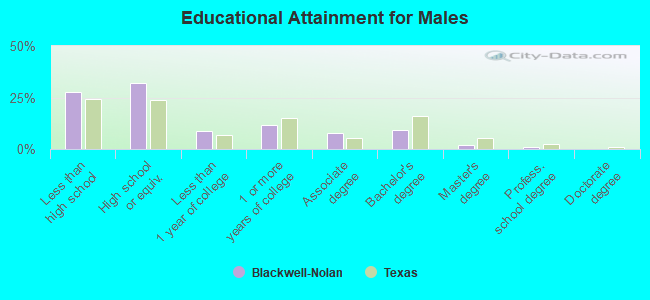
Education attainment for males 25 years and older:
- No schooling: 3
- Nursery to 4th grade: 4
- 5th and 6th grade: 7
- 7th and 8th grade: 8
- 9th grade: 13
- 10th grade: 10
- 11th grade: 15
- 12th grade, no diploma: 8
- High school graduate (or equivalency): 79
- Less than 1 year of college: 21
- Some college more than 1 year, no degree: 29
- Associate degree: 19
- Bachelor's degree: 23
- Master's degree: 5
- Professional school degree: 2
- Doctorate degree: 0
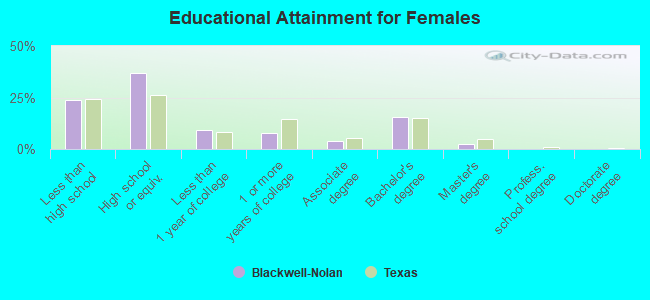
Education attainment for females 25 years and older:
- No schooling: 0
- Nursery to 4th grade: 1
- 5th and 6th grade: 3
- 7th and 8th grade: 15
- 9th grade: 16
- 10th grade: 6
- 11th grade: 12
- 12th grade, no diploma: 11
- High school graduate (or equivalency): 99
- Less than 1 year of college: 24
- Some college more than 1 year, no degree: 21
- Associate degree: 11
- Bachelor's degree: 41
- Master's degree: 7
- Professional school degree: 0
- Doctorate degree: 0
Housing units in structures:
- One, detached: 329
- One, attached: 6
- Two: 2
- 3 or 4: 2
- Mobile homes: 54
- Boats, RVs, vans, etc.: 1
Median worth of mobile homes: $44,006
Housing units lacking complete kitchen facilities: 1.3%
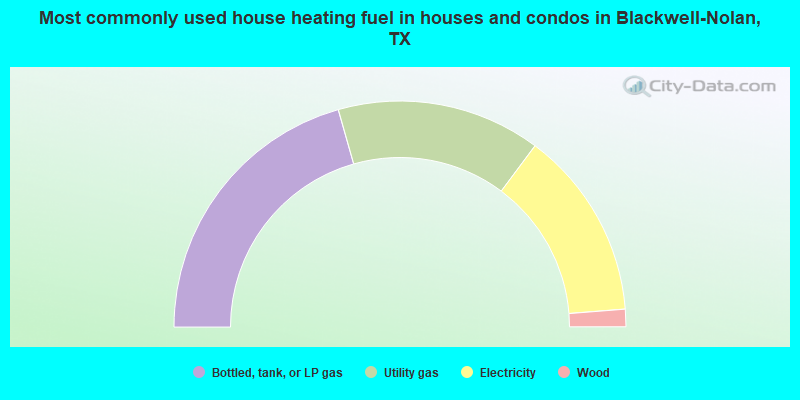
- 41.2%Bottled, tank, or LP gas
- 29.2%Utility gas
- 27.1%Electricity
- 2.5%Wood
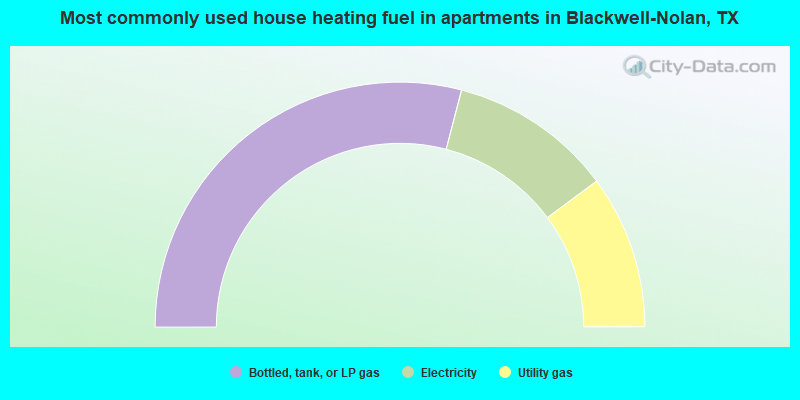
- 58.1%Bottled, tank, or LP gas
- 21.6%Electricity
- 20.3%Utility gas
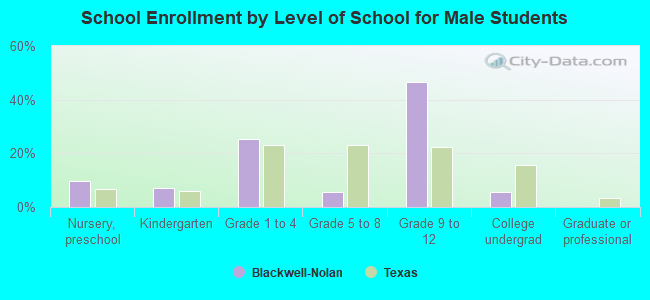
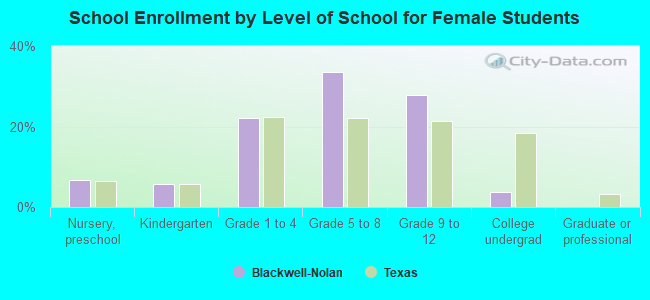
Private vs. public school enrollment:
| Here: | 0.0% |
| Texas: | 6.8% |
| Here: | 0.0% |
| Texas: | 6.2% |
| Here: | 0.0% |
| Texas: | 15.4% |