Blanco, TX (Texas) Houses and Residents
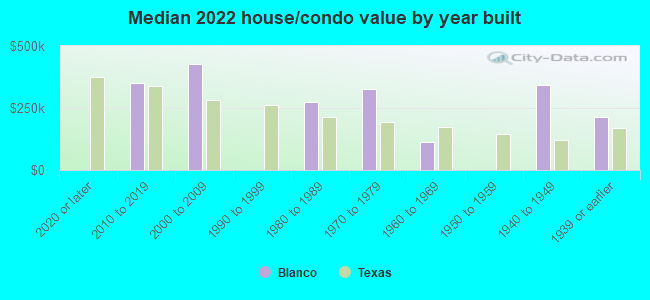
| Blanco: | $246,934 |
| Texas: | $275,400 |
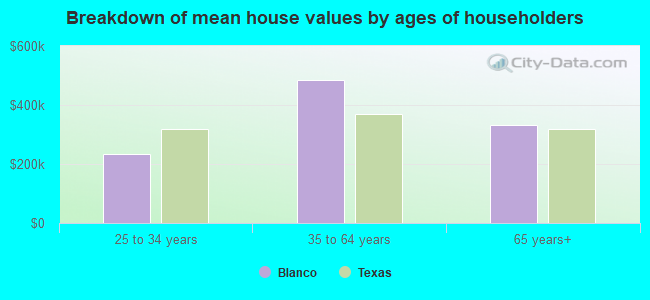
Mean price in 2022:
Detached houses: $317,998
Here: $317,998 State: $369,058 Mobile homes: $165,970
Here: $165,970 State: $124,413
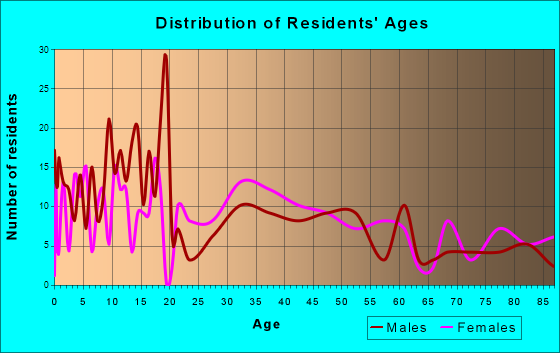
Total population: 1,876 (Urban population: 0, Rural population: 1,513 (all nonfarm))
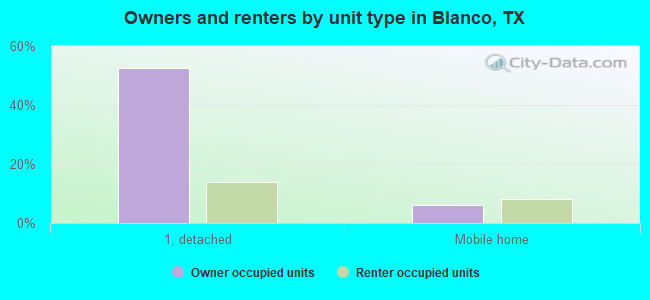
Houses: 1,050 (896 occupied: 486 owner occupied, 423 renter occupied)
| % of renters here: | 47% |
| State: | 38% |
Housing density: 628 houses/condos per square mile
Median price asked for vacant for-sale houses and condos in 2022 in this county: $295,646.
Median contract rent in 2022: $658
Median rent asked for vacant for-rent units in 2022: $5,298
Median gross rent in Blanco, TX in 2022: $877
Housing units in Blanco with a mortgage: 214 (11 second mortgage, 0 home equity loan, 8 both second mortgage and home equity loan)
Houses without a mortgage: 0
Median household income for houses/condos with a mortgage: $103,614
Median household income for apartments without a mortgage: $57,146
Median monthly housing costs: $842
Compare current foreclosures near Blanco, TX:
| Photo | Address | Area | Beds / Baths | Price | Details |
|---|---|---|---|---|---|

|
#1
Deer Haven Ln
Blanco, TX 78606
|
- sq. feet
|
- baths - beds |
show details | |

|
#2
Persimmon Pass
Fischer, TX 78623
|
- sq. feet
|
2 baths 3 beds |
show details | |

|
#3
Lamplight
Spring Branch, TX 78070
|
1,684 sq. feet
|
2 baths 3 beds |
show details | |

|
#4
Misty Ln
Spring Branch, TX 78070
|
2,005 sq. feet
|
2 baths - beds |
show details | |

|
#5
Fm 306
Nb-Canyon Lake, TX 78133
|
728 sq. feet
|
1 baths - beds |
show details | |

|
#6
Mystic Pkwy
Spring Branch, TX 78070
|
3,941 sq. feet
|
4 baths - beds |
show details | |

|
#7
Cedar Shrs
Nb-Canyon Lake, TX 78133
|
896 sq. feet
|
- baths - beds |
show details | |

|
#8
Fm 306
Nb-Canyon Lake, TX 78133
|
- sq. feet
|
- baths - beds |
show details | |

|
#9
W Highway 290
Dripping Springs, TX 78620
|
2,010 sq. feet
|
- baths - beds |
show details | |

|
#10
Aguayo Dr
Nb-Canyon Lake, TX 78133
|
- sq. feet
|
- baths - beds |
show details |
| Photo | Address | Area | Beds / Baths | Price | Details |
|---|---|---|---|---|---|

|
#11
Pursley Rd
Dripping Springs, TX 78620
|
- sq. feet
|
- baths - beds |
show details | |

|
#12
Serenity Pass
Spring Branch, TX 78070
|
- sq. feet
|
- baths - beds |
show details | |

|
#13
Restless Wind
Spring Branch, TX 78070
|
- sq. feet
|
- baths - beds |
show details | |

|
#14
Log Cabin Ln
Fischer, TX 78623
|
- sq. feet
|
- baths - beds |
show details | |

|
#15
Alpine Trl
Kendalia, TX 78027
|
512 sq. feet
|
- baths - beds |
show details | |

|
#16
Cedar Spgs
Spring Branch, TX 78070
|
- sq. feet
|
- baths - beds |
show details | |

|
#17
Brianna Cir
Johnson City, TX 78636
|
- sq. feet
|
- baths - beds |
show details | |

|
#18
Havasu Pt
Spring Branch, TX 78070
|
- sq. feet
|
- baths - beds |
show details | |

|
#19
Sabella
Spring Branch, TX 78070
|
- sq. feet
|
- baths - beds |
show details | |

|
#20
Gladiola St
Spring Branch, TX 78070
|
- sq. feet
|
- baths - beds |
show details |
| Photo | Address | Area | Beds / Baths | Price | Details |
|---|---|---|---|---|---|

|
#21
Elk Dr
Spring Branch, TX 78070
|
1,440 sq. feet
|
- baths - beds |
show details | |

|
#22
E Clark Dr
Nb-Canyon Lake, TX 78133
|
- sq. feet
|
- baths - beds |
show details | |

|
#23
Compass Rose
Nb-Canyon Lake, TX 78133
|
- sq. feet
|
- baths - beds |
show details | |

|
#24
S Contour Dr
Spring Branch, TX 78070
|
- sq. feet
|
- baths - beds |
show details | |

|
Check over 1 million property listings on Foreclosure.com!
|
browse all offers | |||

Latest news about housing in Blanco, TX collected exclusively by city-data.com from local newspapers, TV, and radio stations

 | Blanco Valley Homes (0 replies) |
| Cheapest Apartments in San Antonio pet friendly? (10 replies) |
| Section 8 Apartments off FM 1560?? (99 replies) |
| Apartment in San Antonio near downtown (6 replies) |
| Moving to SA in 90 days 😱 North Central/Castle Hills apartments? (1 reply) |
| Metal Buildings into homes? (43 replies) |
Median year apartment built: 1985
Household type by relationship:
Households: 2,204- Male householders: 474 (79 living alone), Female householders: 409 (158 living alone)
341 spouses (330 opposite-sex spouses), 167 unmarried partners, (139 opposite-sex unmarried partners), 606 children (531 natural, 15 adopted, 59 stepchildren), 17 grandchildren, 0 brothers or sisters, 16 parents, 19 foster children, 72 other relatives, 44 non-relatives
- In group quarters: 33
Size of family households: 185 2-persons, 123 3-persons, 65 4-persons, 64 5-persons, 18 6-persons.
Size of nonfamily households: 249 1-person, 215 2-persons.
302 married couples with children.
132 single-parent households (34 men, 98 women).
92.3% of residents of Blanco speak English at home.
7.5% of residents speak Spanish at home (31% speak English very well, 21% speak English well, 2% speak English not well, 46% don't speak English at all).
0.3% of residents speak Asian or Pacific Island language at home (100% speak English well).
Foreign born population: 128 (5.8%)
(30.5% of them are naturalized citizens)
| Here: | 6.0 |
| State: | 6.3 |
| Here: | 3.5 |
| State: | 4.0 |
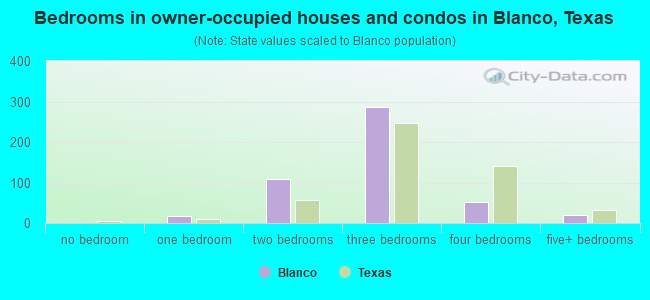
- Bedrooms in owner-occupied houses and condos in Blanco, Texas
- 0no bedroom
- 171 bedroom
- 1092 bedrooms
- 2873 bedrooms
- 534 bedrooms
- 205+ bedrooms
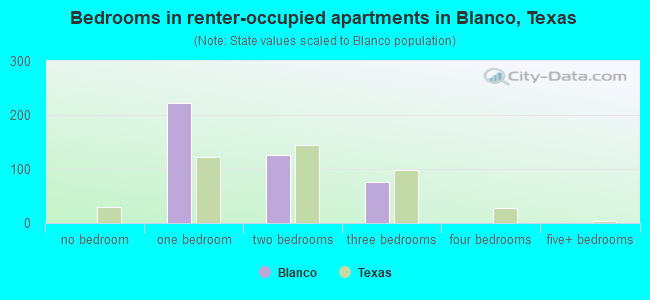
- Bedrooms in renter-occupied apartments in Blanco, Texas
- 0no bedroom
- 2221 bedroom
- 1262 bedrooms
- 763 bedrooms
- 04 bedrooms
- 05+ bedrooms
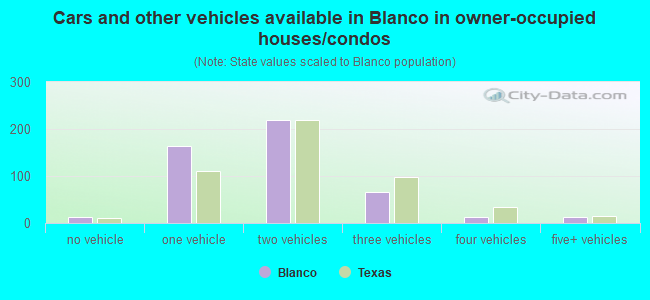
- Cars and other vehicles available in Blanco in owner-occupied houses/condos
- 12no vehicle
- 1641 vehicle
- 2202 vehicles
- 663 vehicles
- 134 vehicles
- 135+ vehicles
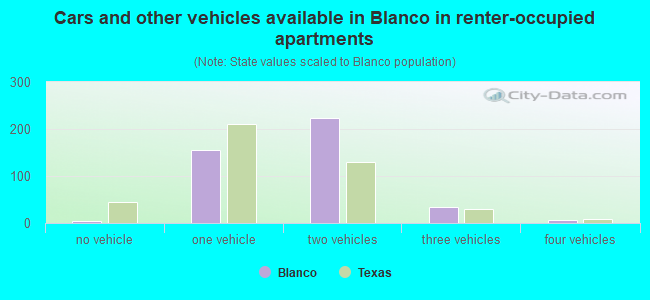
- Cars and other vehicles available in Blanco in renter-occupied apartments
- 5no vehicle
- 1551 vehicle
- 2232 vehicles
- 333 vehicles
- 74 vehicles
- 05+ vehicles
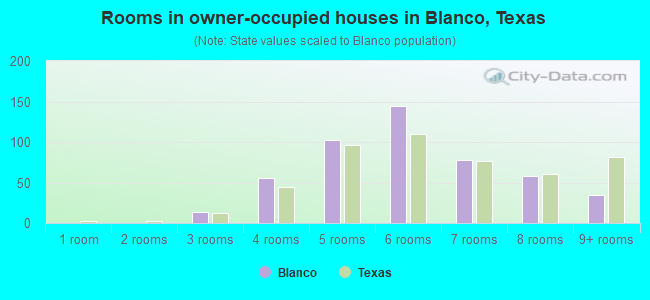
- Rooms in owner-occupied houses in Blanco, Texas
- 01 room
- 02 rooms
- 143 rooms
- 554 rooms
- 1035 rooms
- 1446 rooms
- 787 rooms
- 588 rooms
- 359+ rooms
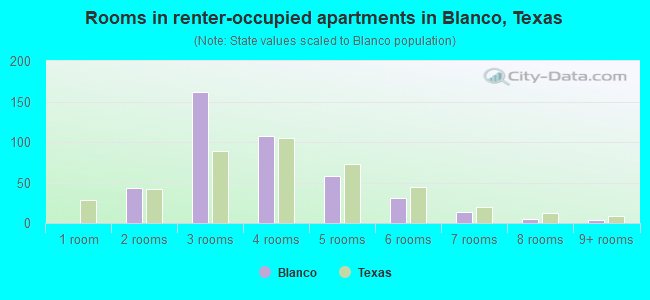
- Rooms in renter-occupied apartments in Blanco, Texas
- 01 room
- 432 rooms
- 1623 rooms
- 1074 rooms
- 585 rooms
- 316 rooms
- 147 rooms
- 58 rooms
- 49+ rooms
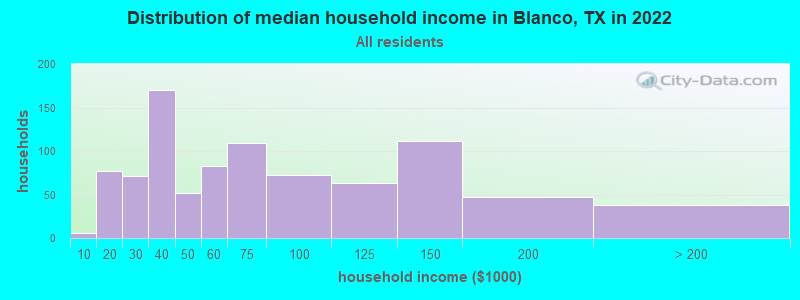
Blanco, TX household income distribution

- 6Less than $10,000
- 77$10,000 to $19,999
- 71$20,000 to $29,999
- 170$30,000 to $39,999
- 52$40,000 to $49,999
- 83$50,000 to $59,999
- 109$60,000 to $74,999
- 72$75,000 to $99,999
- 63$100,000 to $124,999
- 112$125,000 to $149,999
- 47$150,000 to $199,999
- 38$200,000 or more
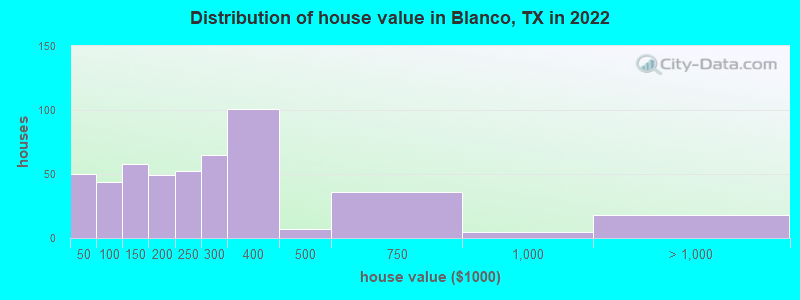
Home value of owner - occupied houses in 2022 in Blanco, TX
-
- 21Less than $10,000
- 4$20,000 to $24,999
- 11$25,000 to $29,999
- 12$40,000 to $49,999
- 10$60,000 to $69,999
- 6$70,000 to $79,999
- 13$90,000 to $99,999
- 41$100,000 to $124,999
- 16$125,000 to $149,999
- 29$150,000 to $174,999
- 20$175,000 to $199,999
- 51$200,000 to $249,999
- 65$250,000 to $299,999
- 101$300,000 to $399,999
- 7$400,000 to $499,999
- 35$500,000 to $749,999
- 4$750,000 to $999,999
- 18$1,000,000 to $1,499,999
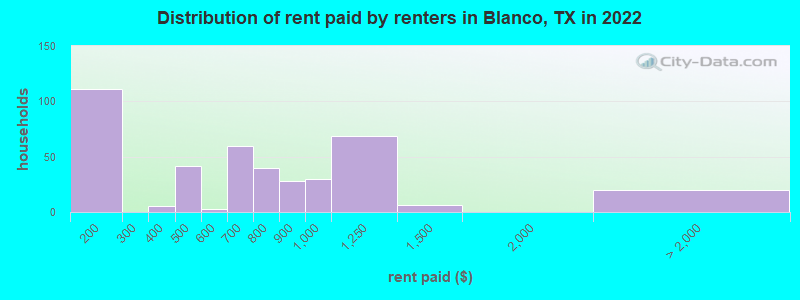
Rent paid by renters in 2022 in Blanco, TX
-
- 110$100 to $149
- 4$300 to $349
- 42$400 to $449
- 2$550 to $599
- 50$600 to $649
- 8$650 to $699
- 10$700 to $749
- 29$750 to $799
- 27$800 to $899
- 29$900 to $999
- 68$1,000 to $1,249
- 6$1,250 to $1,499
- 20No cash rent
Percentage of workers working in this county: 62.4%
Number of people working at home: 128 (12.0% of all workers)
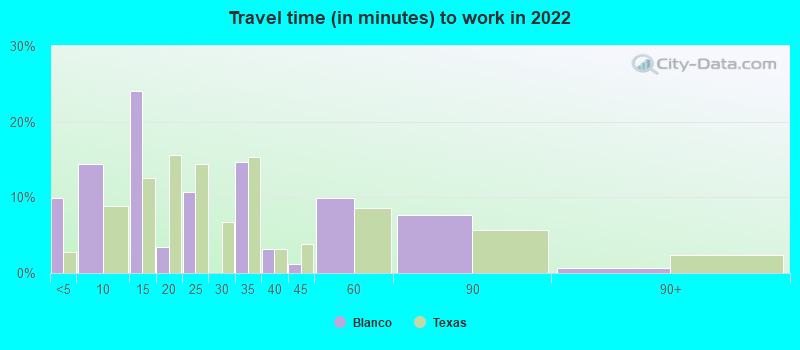
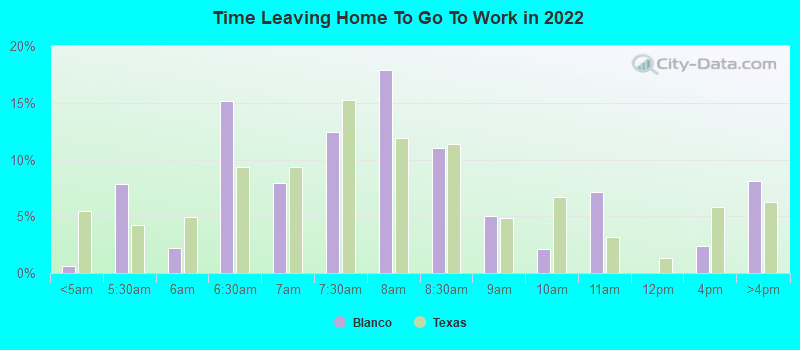
Travel time to work (commute)
- Less than 5 minutes: 137
- 5 to 9 minutes: 148
- 10 to 14 minutes: 32
- 15 to 19 minutes: 85
- 20 to 24 minutes: 30
- 25 to 29 minutes: 3
- 30 to 34 minutes: 192
- 35 to 39 minutes: 68
- 40 to 44 minutes: 15
- 45 to 59 minutes: 127
- 60 to 89 minutes: 78
- 90 or more minutes: 20
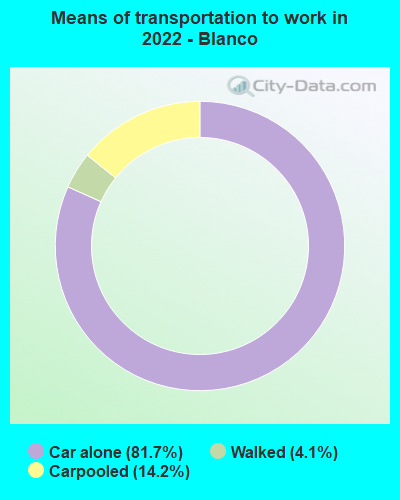
Means of transportation to work:
- Drove a car alone: 1,118 (72.6%)
- Carpooled: 211 (13.7%)
- Walked: 59 (3.8%)
- Worked at home: 128 (8.3%)
- Unemployment by race in 2022
- Unemployment rate for White non-Hispanic residents
- 6.4%Females
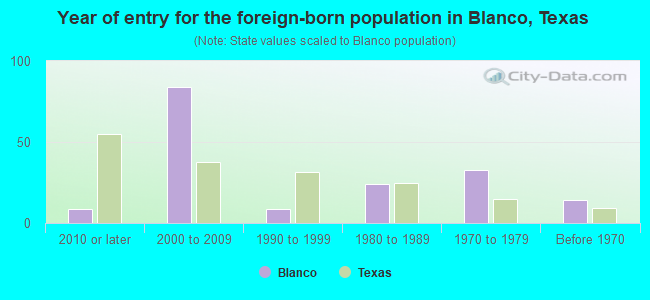
- Year of entry for the foreign-born population in Blanco, Texas
- 92010 or later
- 842000 to 2009
- 91990 to 1999
- 241980 to 1989
- 331970 to 1979
- 14Before 1970
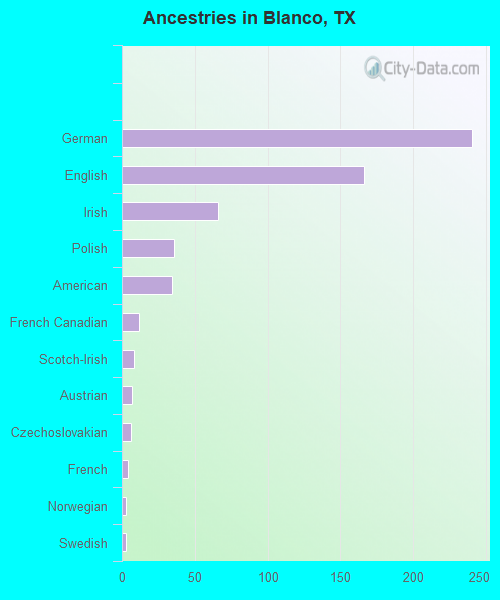
First ancestries reported:
- German: 240 (25.9%)
- English: 166 (17.9%)
- Irish: 66 (7.1%)
- Polish: 36 (3.9%)
- American: 34 (3.7%)
- French Canadian: 12 (1.3%)
- Scotch-Irish: 8 (0.9%)
- Austrian: 7 (0.8%)
- Czechoslovakian: 6 (0.6%)
- French: 4 (0.4%)
- Norwegian: 3 (0.3%)
- Swedish: 3 (0.3%)
- Czech: 2 (0.2%)
- European: 1 (0.1%)
Most common places of birth for foreign-born residents (%):
| Blanco: | 71.9% (92) |
| Texas: | 48.4% (2,411,723) |
| Blanco: | 10.2% (13) |
| Texas: | 3.0% (147,182) |
| Blanco: | 9.4% (12) |
| Texas: | 2.3% (115,558) |
| Blanco: | 5.5% (7) |
| Texas: | 0.8% (37,989) |
Place of birth for U.S.-born residents:
- This state: 1,624
- Other state: 408
- Northeast: 27
- Midwest: 143
- South: 187
- West: 47
85.6% of Blanco residents lived in the same house 1 years ago.
Out of people who lived in different houses, 27.1% lived in this county.
Out of people who lived in different counties, 83.8% lived in Texas.
| Blanco: | 85.6% |
| State average: | 85.7% |
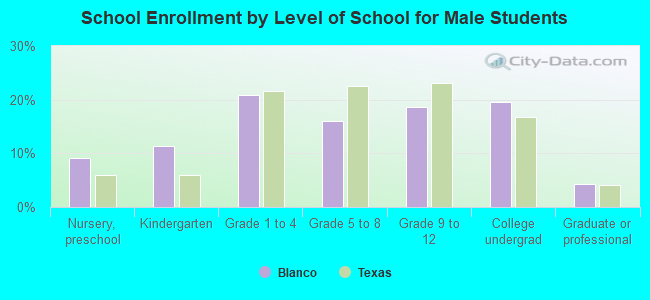
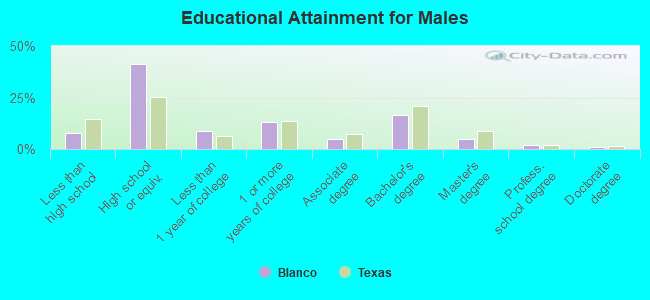
Education attainment for males 25 years and older:
- No schooling: 0
- Nursery to 4th grade: 0
- 5th and 6th grade: 25
- 7th and 8th grade: 0
- 9th grade: 9
- 10th grade: 8
- 11th grade: 8
- 12th grade, no diploma: 1
- High school graduate (or equivalency): 275
- Less than 1 year of college: 59
- Some college more than 1 year, no degree: 87
- Associate degree: 32
- Bachelor's degree: 110
- Master's degree: 32
- Professional school degree: 14
- Doctorate degree: 8
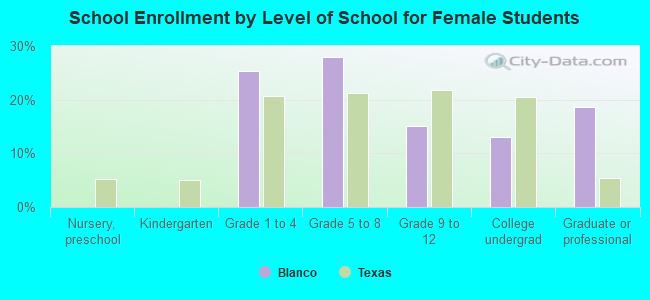
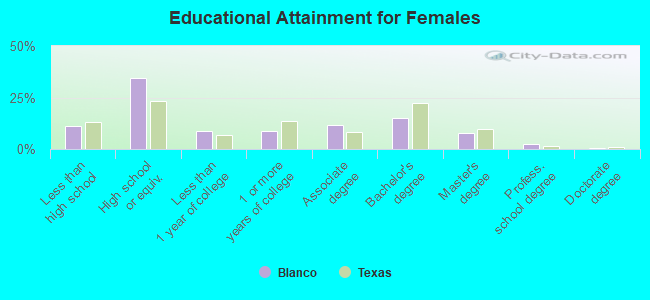
Education attainment for females 25 years and older:
- No schooling: 0
- Nursery to 4th grade: 11
- 5th and 6th grade: 48
- 7th and 8th grade: 4
- 9th grade: 0
- 10th grade: 0
- 11th grade: 13
- 12th grade, no diploma: 13
- High school graduate (or equivalency): 276
- Less than 1 year of college: 70
- Some college more than 1 year, no degree: 71
- Associate degree: 94
- Bachelor's degree: 119
- Master's degree: 61
- Professional school degree: 19
- Doctorate degree: 3
Housing units in structures:
- One, detached: 738
- One, attached: 2
- Two: 15
- 3 or 4: 71
- 5 to 9: 112
- 10 to 19: 8
- 20 to 49: 9
- Mobile homes: 85
- Boats, RVs, vans, etc.: 7
Housing units lacking complete kitchen facilities in 2022: 2.8%
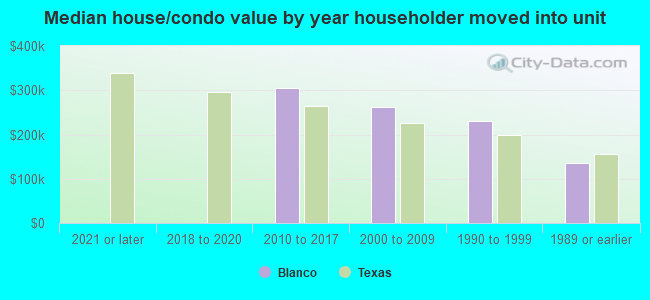
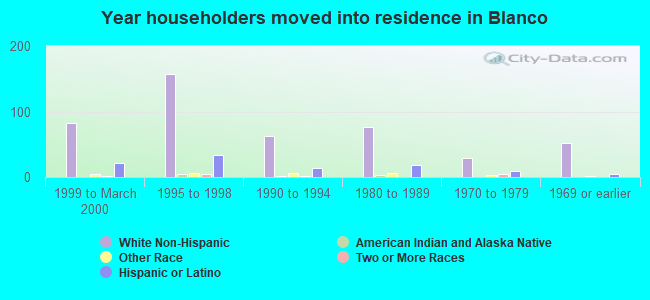
House/condo owner moved in on average 15 years ago
Renter moved in on average 5 years ago
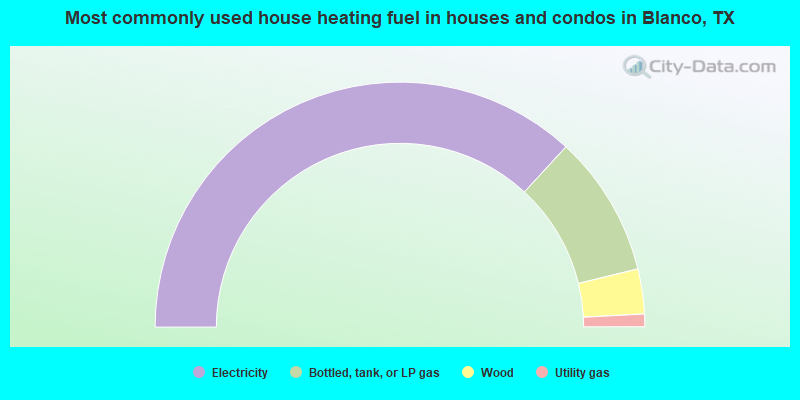
- 73.7%Electricity
- 18.7%Bottled, tank, or LP gas
- 5.9%Wood
- 1.7%Utility gas
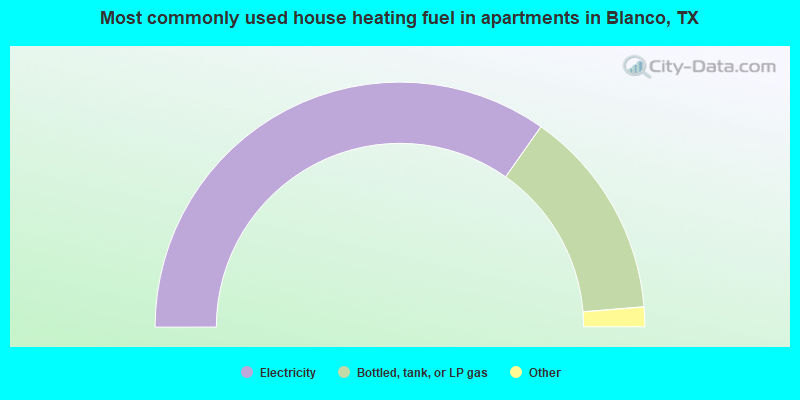
- 69.6%Electricity
- 27.9%Bottled, tank, or LP gas
- 1.5%Utility gas
- 1.0%No fuel used
Private vs. public school enrollment:
| Here: | 8.1% |
| Texas: | 8.8% |
| Here: | 8.4% |
| Texas: | 8.0% |
| Here: | 11.7% |
| Texas: | 16.2% |