Blue Springs, MO (Missouri) Houses and Residents
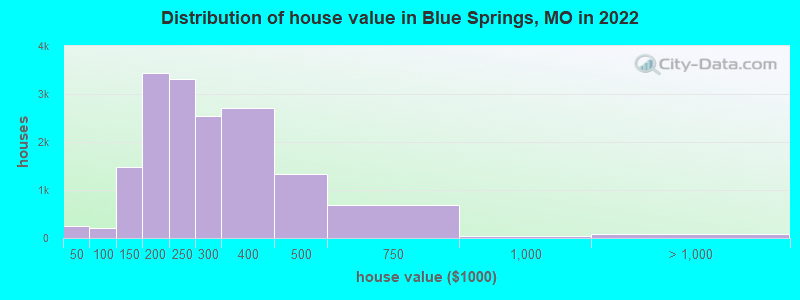
Estimated median house or condo value in 2022: $253,003 (it was $108,200 in 2000 )
Blue Springs:
$253,003Missouri:
$221,200
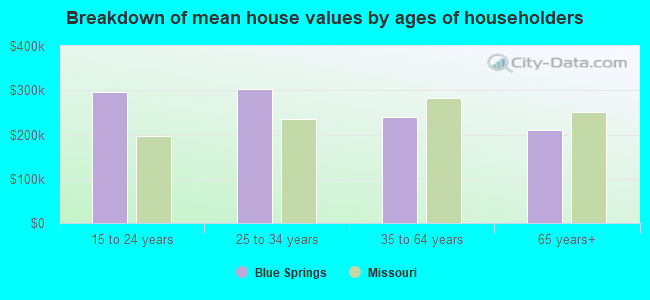
Lower value quartile - upper value quartile: $191,817 - $340,613Mean price in 2022: Detached houses: $261,731 Here:
$261,731State:
$278,068
Townhouses or other attached units: $168,973 Here:
$168,973State:
$260,773
In 2-unit structures: $348,181 Here:
$348,181State:
$172,667
In 3-to-4-unit structures: $109,209 Here:
$109,209State:
$181,162
In 5-or-more-unit structures: $142,694 Here:
$142,694State:
$263,082
Mobile homes: $147,181 Here:
$147,181State:
$95,912
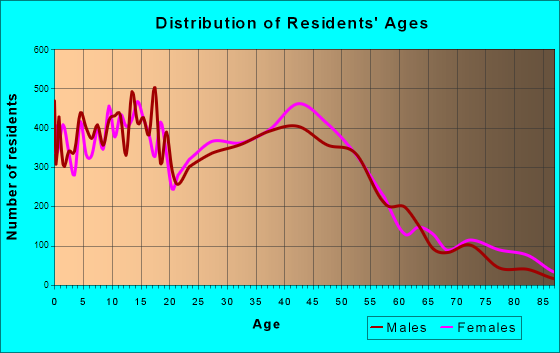
Total population: 53,573 (Urban population: 47,710, Rural population: 280 (all nonfarm) )
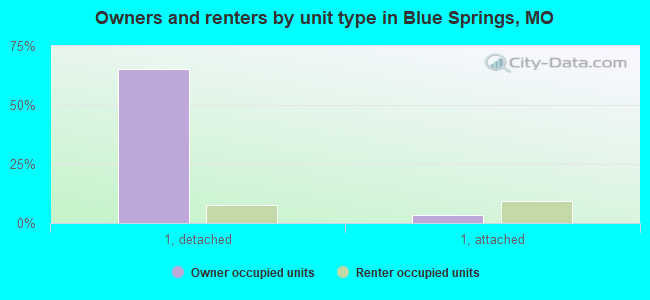
Houses: 22,823 (22,243 occupied: 15,590 owner occupied, 7,025 renter occupied )
% of renters here:
31%State:
32%
Housing density: 1,254 houses/condos per square mile
Median price asked for vacant for-sale houses and condos in 2022: $184,374.
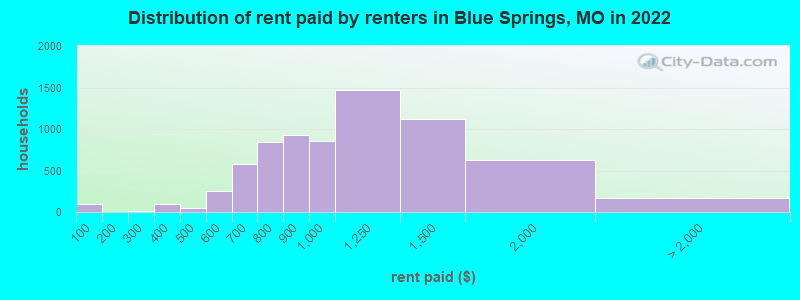
Median contract rent in 2022: $963 (lower quartile is $765, upper quartile is $1,265)
Median rent asked for vacant for-rent units in 2022: $1,308
Median gross rent in Blue Springs, MO in 2022: $1,182
Housing units in Blue Springs with a mortgage: 11,258 (899 second mortgage, 0 home equity loan, 620 both second mortgage and home equity loan )Houses without a mortgage: 203
Median household income for houses/condos with a mortgage: $100,594
Median household income for apartments without a mortgage: $79,955
Median monthly housing costs: $1,272
Data:
Median house or condo value ($)
Median house or condo value ($ change since 2000)
Median house or condo value ($) - White
Median house or condo value ($) - Black or African American
Median house or condo value ($) - Asian
Median house or condo value ($) - Hispanic or Latino
Median house or condo value ($) - American Indian and Alaska Native
Median house or condo value ($) - Multirace
Median house or condo value ($) - Other Race
Median price asked for mobile homes ($)
Household density (households per square mile)
Mean house or condo value by units in structure - 1, detached ($)
Mean house or condo value by units in structure - 1, attached ($)
Mean house or condo value by units in structure - 2 ($)
Mean house or condo value by units in structure by units in structure - 3 or 4 ($)
Mean house or condo value by units in structure - 5 or more ($)
Mean house or condo value by units in structure - Boat, RV, van, etc. ($)
Mean house or condo value by units in structure - Mobile home ($)
Median contract rent ($)
Median contract rent - Lower quartile ($)
Median contract rent - Upper quartile ($)
Median gross rent ($)
Urban houses (%)
Rural houses (%)
Houses occupied (%)
Houses occupied (% change since 2000)
Houses owner occupied (%)
Houses owner occupied (% change since 2000)
Houses renter occupied (%)
Houses renter occupied (% change since 2000)
Vacant housing units - For rent (%)
Vacant housing units - For rent (% change since 2000)
Vacant housing units - For sale only (%)
Vacant housing units - For sale only (% change since 2000)
Vacant housing units - Rented or sold, not occupied (%)
Vacant housing units - Rented or sold, not occupied (% change since 2000)
Vacant housing units - For seasonal, recreational, or occasional use (%)
Vacant housing units - For seasonal, recreational, or occasional use (% change since 2000)
Vacant housing units - For migrant workers (%)
Vacant housing units - For migrant workers (% change since 2000)
Vacant housing units - Other vacant (%)
Vacant housing units - Other vacant (% change since 2000)
Median monthly housing costs ($)
Median household income for houses/condos with a mortgage ($)
Median household income for houses/condos without a mortgage ($)
Median household income ($)
Median household income ($) - White
Median household income ($) - Black or African American
Median household income ($) - Asian
Median household income ($) - Hispanic or Latino
Median household income ($) - American Indian and Alaska Native
Median household income ($) - Multirace
Median household income ($) - Other Race
Mortgage status - with mortgage (%)
Mortgage status - with second mortgage (%)
Mortgage status - with home equity loan (%)
Mortgage status - with both second mortgage and home equity loan (%)
Mortgage status - without a mortgage (%)
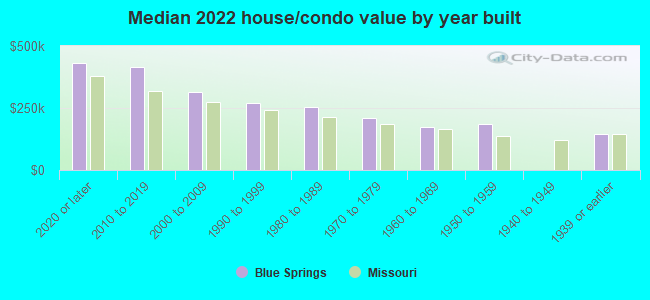
Median year house/condo built
Median year apartment built
Household type by relationship - Male householder living alone (%)
Household type by relationship - Male householder not living alone (%)
Household type by relationship - Female householder living alone (%)
Household type by relationship - Female householder not living alone (%)
Household type by relationship - Opposite-Sex spouse (%)
Household type by relationship - Same-Sex spouse (%)
Household type by relationship - Opposite-Sex unmarried partner (%)
Household type by relationship - Same-Sex unmarried partner (%)
Household type by relationship - In group quarters (%)
Size of family households - 2-person household (%)
Size of family households - 3-person household (%)
Size of family households - 4-person household (%)
Size of family households - 5-person household (%)
Size of family households - 6-person household (%)
Size of family households - 7-or-more-person household (%)
Size of nonfamily households - 1-person household (%)
Size of nonfamily households - 2-person household (%)
Size of nonfamily households - 3-person household (%)
Size of nonfamily households - 4-person household (%)
Size of nonfamily households - 5-person household (%)
Size of nonfamily households - 6-person household (%)
Size of nonfamily households - 7-or-moreperson household (%)
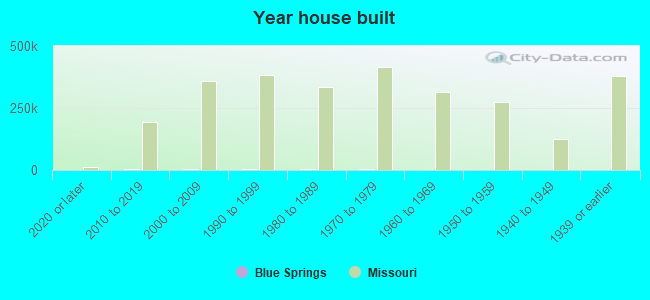
Year house built - Built 2010 or later (%)
Year house built - Built 2000 to 2009 (%)
Year house built - Built 1990 to 1999 (%)
Year house built - Built 1980 to 1989 (%)
Year house built - Built 1970 to 1979 (%)
Year house built - Built 1960 to 1969 (%)
Year house built - Built 1950 to 1959 (%)
Year house built - Built 1940 to 1949 (%)
Year house built - Built 1939 or earlier (%)
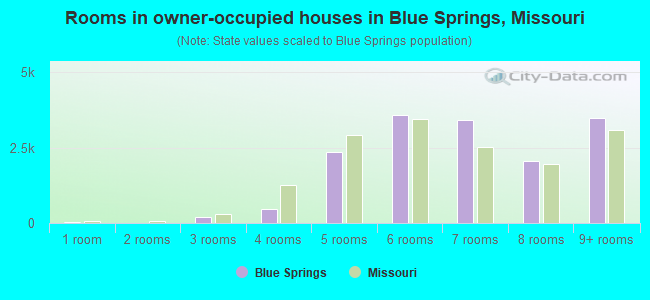
Median number of rooms in houses and condos
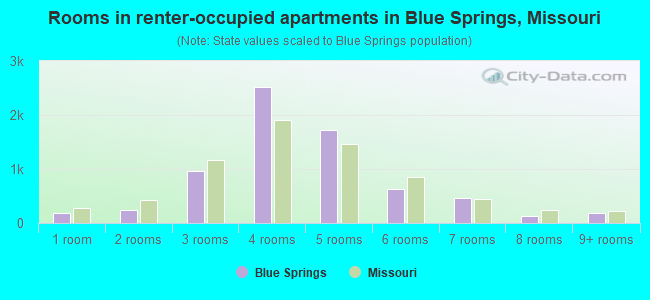
Median number of rooms in apartments
Median number of bedrooms in owner occupied houses
Mean number of bedrooms in owner occupied houses
Median number of bedrooms in renter occupied houses
Mean number of bedrooms in renter occupied houses
Median number of vehichles in owner occupied houses
Mean number of vehichles in owner occupied houses
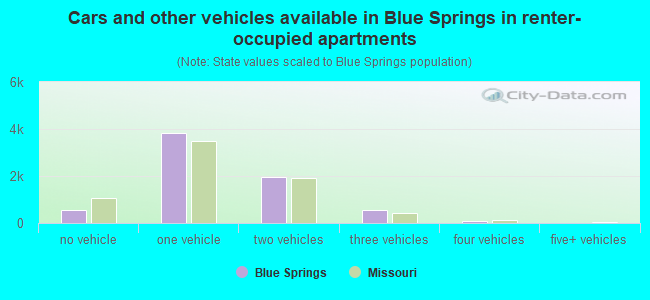
Median number of vehichles in renter occupied houses
Mean number of vehichles in renter occupied houses
Rooms in owner-occupied houses - 1 room (%)
Rooms in owner-occupied houses - 2 rooms (%)
Rooms in owner-occupied houses - 3 rooms (%)
Rooms in owner-occupied houses - 4 rooms (%)
Rooms in owner-occupied houses - 5 rooms (%)
Rooms in owner-occupied houses - 6 rooms (%)
Rooms in owner-occupied houses - 7 rooms (%)
Rooms in owner-occupied houses - 8 rooms (%)
Rooms in owner-occupied houses - 9+ rooms (%)
Rooms in renter-occupied houses - 1 room (%)
Rooms in renter-occupied houses - 2 rooms (%)
Rooms in renter-occupied houses - 3 rooms (%)
Rooms in renter-occupied houses - 4 rooms (%)
Rooms in renter-occupied houses - 5 rooms (%)
Rooms in renter-occupied houses - 6 rooms (%)
Rooms in renter-occupied houses - 7 rooms (%)
Rooms in renter-occupied houses - 8 rooms (%)
Rooms in renter-occupied houses - 9+ rooms (%)
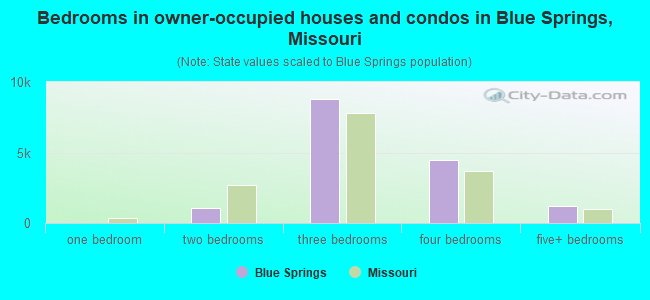
Bedrooms in owner-occupied houses - no bedrooms (%)
Bedrooms in owner-occupied houses - 1 bedroom (%)
Bedrooms in owner-occupied houses - 2 bedrooms (%)
Bedrooms in owner-occupied houses - 3 bedrooms (%)
Bedrooms in owner-occupied houses - 4 bedrooms (%)
Bedrooms in owner-occupied houses - 5+ bedrooms (%)
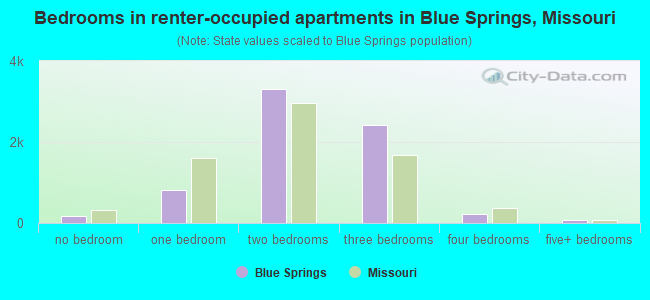
Bedrooms in renter-occupied houses - no bedrooms (%)
Bedrooms in renter-occupied houses - 1 bedroom (%)
Bedrooms in renter-occupied houses - 2 bedrooms (%)
Bedrooms in renter-occupied houses - 3 bedrooms (%)
Bedrooms in renter-occupied houses - 4 bedrooms (%)
Bedrooms in renter-occupied houses - 5+ bedrooms (%)
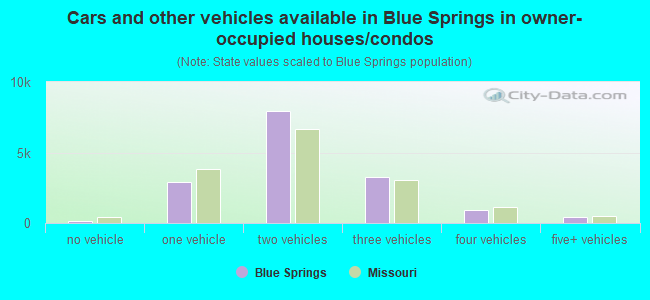
Vehicles available in owner-occupied houses - no vehicle available (%)
Vehicles available in owner-occupied houses - 1 vehicle available(%)
Vehicles available in owner-occupied houses - 2 Vehicles available (%)
Vehicles available in owner-occupied houses - 3 Vehicles available (%)
Vehicles available in owner-occupied houses - 4 Vehicles available (%)
Vehicles available in owner-occupied houses - 5+ Vehicles available (%)
Vehicles available in renter-occupied houses - no vehicle available (%)
Vehicles available in renter-occupied houses - 1 vehicle available (%)
Vehicles available in renter-occupied houses - 2 Vehicles available (%)
Vehicles available in renter-occupied houses - 3 Vehicles available (%)
Vehicles available in renter-occupied houses - 4 Vehicles available (%)
Vehicles available in renter-occupied houses - 5+ Vehicles available (%)
Housing units in structures - 1, detached (%)
Housing units in structures - 1, attached (%)
Housing units in structures - 2 (%)
Housing units in structures - 3 or 4 (%)
Housing units in structures - 5 to 9 (%)
Housing units in structures - 10 to 19 (%)
Housing units in structures - 20 to 49 (%)
Housing units in structures - 50 or more (%)
Housing units in structures - Mobile home (%)
Housing units in structures - Boat, RV, van, etc. (%)
Housing units in structures - Owners - 1, detached (%)
Housing units in structures - Owners - 1, attached (%)
Housing units in structures - Owners - 2 (%)
Housing units in structures - Owners - 3 or 4 (%)
Housing units in structures - Owners - 5 to 9 (%)
Housing units in structures - Owners - 10 to 19 (%)
Housing units in structures - Owners - 20 to 49 (%)
Housing units in structures - Owners - 50 or more (%)
Housing units in structures - Owners - Mobile home (%)
Housing units in structures - Owners - Boat, RV, van, etc. (%)
Housing units in structures - Renters - 1, detached (%)
Housing units in structures - Renters - 1, attached (%)
Housing units in structures - Renters - 2 (%)
Housing units in structures - Renters - 3 or 4 (%)
Housing units in structures - Renters - 5 to 9 (%)
Housing units in structures - Renters - 10 to 19 (%)
Housing units in structures - Renters - 20 to 49 (%)
Housing units in structures - Renters - 50 or more (%)
Housing units in structures - Renters - Mobile home (%)
Housing units in structures - Renters - Boat, RV, van, etc. (%)
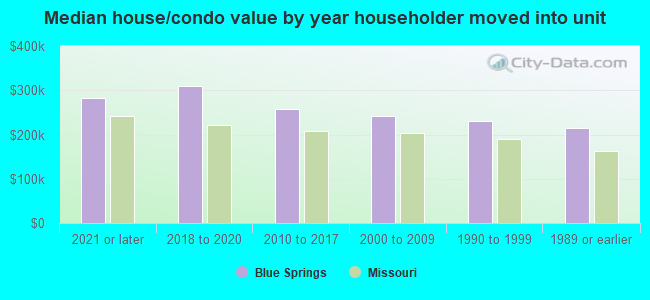
House/condo owner moved in on average (years ago)
Renter moved in on average (years ago)
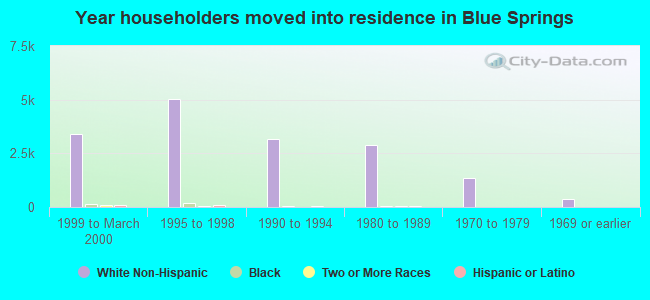
Year householder moved into unit - Moved in 1999 to March 2000 (%)
Year householder moved into unit - Moved in 1999 to March 2000 (%) - White
Year householder moved into unit - Moved in 1999 to March 2000 (%) - Black or African American
Year householder moved into unit - Moved in 1999 to March 2000 (%) - Asian
Year householder moved into unit - Moved in 1999 to March 2000 (%) - Hispanic or Latino
Year householder moved into unit - Moved in 1999 to March 2000 (%) - American Indian and Alaska Native
Year householder moved into unit - Moved in 1999 to March 2000 (%) - Multirace
Year householder moved into unit - Moved in 1999 to March 2000 (%) - Other Race
Year householder moved into unit - Moved in 1995 to 1998 (%)
Year householder moved into unit - Moved in 1995 to 1998 (%) - White
Year householder moved into unit - Moved in 1995 to 1998 (%) - Black or African American
Year householder moved into unit - Moved in 1995 to 1998 (%) - Asian
Year householder moved into unit - Moved in 1995 to 1998 (%) - Hispanic or Latino
Year householder moved into unit - Moved in 1995 to 1998 (%) - American Indian and Alaska Native
Year householder moved into unit - Moved in 1995 to 1998 (%) - Multirace
Year householder moved into unit - Moved in 1995 to 1998 (%) - Other Race
Year householder moved into unit - Moved in 1990 to 1994 (%)
Year householder moved into unit - Moved in 1990 to 1994 (%) - White
Year householder moved into unit - Moved in 1990 to 1994 (%) - Black or African American
Year householder moved into unit - Moved in 1990 to 1994 (%) - Asian
Year householder moved into unit - Moved in 1990 to 1994 (%) - Hispanic or Latino
Year householder moved into unit - Moved in 1990 to 1994 (%) - American Indian and Alaska Native
Year householder moved into unit - Moved in 1990 to 1994 (%) - Multirace
Year householder moved into unit - Moved in 1990 to 1994 (%) - Other Race
Year householder moved into unit - Moved in 1980 to 1989 (%)
Year householder moved into unit - Moved in 1980 to 1989 (%) - White
Year householder moved into unit - Moved in 1980 to 1989 (%) - Black or African American
Year householder moved into unit - Moved in 1980 to 1989 (%) - Asian
Year householder moved into unit - Moved in 1980 to 1989 (%) - Hispanic or Latino
Year householder moved into unit - Moved in 1980 to 1989 (%) - American Indian and Alaska Native
Year householder moved into unit - Moved in 1980 to 1989 (%) - Multirace
Year householder moved into unit - Moved in 1980 to 1989 (%) - Other Race
Year householder moved into unit - Moved in 1970 to 1979 (%)
Year householder moved into unit - Moved in 1970 to 1979 (%) - White
Year householder moved into unit - Moved in 1970 to 1979 (%) - Black or African American
Year householder moved into unit - Moved in 1970 to 1979 (%) - Asian
Year householder moved into unit - Moved in 1970 to 1979 (%) - Hispanic or Latino
Year householder moved into unit - Moved in 1970 to 1979 (%) - American Indian and Alaska Native
Year householder moved into unit - Moved in 1970 to 1979 (%) - Multirace
Year householder moved into unit - Moved in 1970 to 1979 (%) - Other Race
Year householder moved into unit - Moved in 1969 or earlier (%)
Year householder moved into unit - Moved in 1969 or earlier (%) - White
Year householder moved into unit - Moved in 1969 or earlier (%) - Black or African American
Year householder moved into unit - Moved in 1969 or earlier (%) - Asian
Year householder moved into unit - Moved in 1969 or earlier (%) - Hispanic or Latino
Year householder moved into unit - Moved in 1969 or earlier (%) - American Indian and Alaska Native
Year householder moved into unit - Moved in 1969 or earlier (%) - Multirace
Year householder moved into unit - Moved in 1969 or earlier (%) - Other Race
Housing units lacking complete plumbing facilities (%)
Housing units lacking complete kitchen facilities (%)
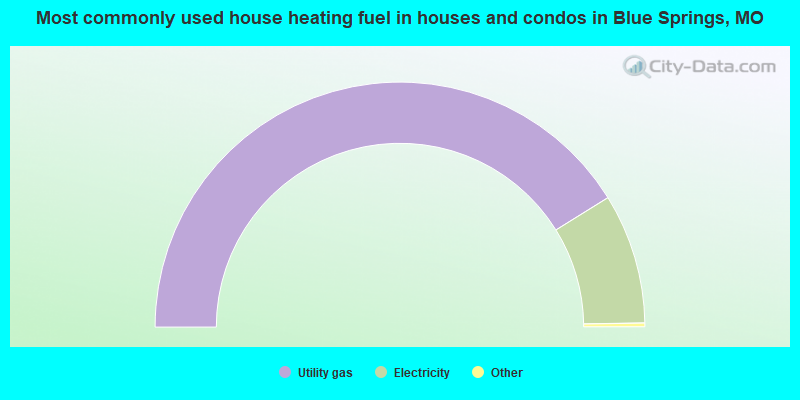
House heating fuel used in houses and condos - Utility gas (%)
House heating fuel used in houses and condos - Bottled, tank, or LP gas (%)
House heating fuel used in houses and condos - Electricity (%)
House heating fuel used in houses and condos - Fuel oil, kerosene, etc. (%)
House heating fuel used in houses and condos - Coal or coke (%)
House heating fuel used in houses and condos - Wood (%)
House heating fuel used in houses and condos - Solar energy (%)
House heating fuel used in houses and condos - Other fuel (%)
House heating fuel used in houses and condos - No fuel used (%)
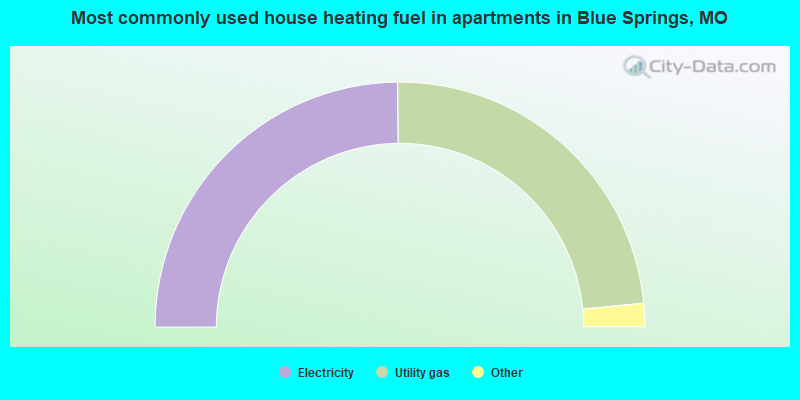
House heating fuel used in apartments - Utility gas (%)
House heating fuel used in apartments - Bottled, tank, or LP gas (%)
House heating fuel used in apartments - Electricity (%)
House heating fuel used in apartments - Fuel oil, kerosene, etc. (%)
House heating fuel used in apartments - Coal or coke (%)
House heating fuel used in apartments - Wood (%)
House heating fuel used in apartments - Solar energy (%)
House heating fuel used in apartments - Other fuel (%)
House heating fuel used in apartments - No fuel used (%)
Median year house/condo built: 1984Median year apartment built: 1990Household type by relationship:
Households: 58,802
Male householders: 9,983 (2,300 living alone ), Female householders: 11,911 (2,392 living alone )12,038 spouses (11,836 opposite-sex spouses ), 1,277 unmarried partners , (1,157 opposite-sex unmarried partners ), 19,541 children (18,188 natural , 571 adopted , 781 stepchildren ), 1,104 grandchildren , 224 brothers or sisters , 675 parents , 39 foster children , 545 other relatives , 1,243 non-relatives In group quarters: 216
Size of family households: 6,867 2-persons , 3,832 3-persons , 3,328 4-persons , 1,393 5-persons , 530 6-persons , 232 7-or-more-persons .
Size of nonfamily households: 5,015 1-person , 887 2-persons , 20 3-persons , 170 4-persons , 129 5-persons .
9,338 married couples with children. single-parent households (1,907 men , 3,338 women ).
96.3% of residents of Blue Springs speak English at home. of residents speak Spanish at home (75% speak English very well , 23% speak English well , 2% speak English not well ).of residents speak other Indo-European language at home (86% speak English very well , 11% speak English well , 1% speak English not well , 2% don't speak English at all ).of residents speak Asian or Pacific Island language at home (62% speak English very well , 28% speak English well , 10% speak English not well ).of residents speak other language at home (100% speak English very well ).
Foreign born population: 1,194 (2.0%)of them are naturalized citizens )
Median number of rooms in houses and condos:
Median number of rooms in apartments
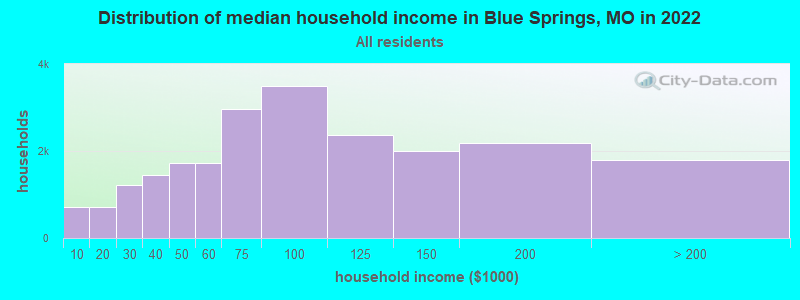
Blue Springs, MO household income distribution 719 Less than $10,000714 $10,000 to $19,9991,209 $20,000 to $29,9991,439 $30,000 to $39,9991,721 $40,000 to $49,9991,727 $50,000 to $59,9992,968 $60,000 to $74,9993,496 $75,000 to $99,9992,372 $100,000 to $124,9992,003 $125,000 to $149,9992,187 $150,000 to $199,9991,800 $200,000 or more
Home value of owner - occupied houses in 2022 in Blue Springs, MO 96 Less than $10,00023 $10,000 to $14,99910 $15,000 to $19,99944 $20,000 to $24,9996 $25,000 to $29,99930 $30,000 to $34,99917 $35,000 to $39,99910 $40,000 to $49,99955 $50,000 to $59,9995 $60,000 to $69,99960 $70,000 to $79,99926 $80,000 to $89,99956 $90,000 to $99,999612 $100,000 to $124,999859 $125,000 to $149,9991,754 $150,000 to $174,9991,679 $175,000 to $199,9993,306 $200,000 to $249,9992,533 $250,000 to $299,9992,708 $300,000 to $399,9991,337 $400,000 to $499,999696 $500,000 to $749,99940 $750,000 to $999,9995 $1,000,000 to $1,499,9998 $1,500,000 to $1,999,99970 $2,000,000 or moreRent paid by renters in 2022 in Blue Springs, MO 98 Less than $1008 $200 to $2495 $250 to $29945 $300 to $34951 $350 to $3998 $400 to $44941 $450 to $49994 $500 to $549157 $550 to $599172 $600 to $649408 $650 to $699494 $700 to $749345 $750 to $799930 $800 to $899859 $900 to $9991,467 $1,000 to $1,2491,120 $1,250 to $1,499624 $1,500 to $1,99970 $2,000 to $2,49942 $3,500 or more55 No cash rent
Percentage of workers working in this county: 83.5%Number of people working at home: 4,681 (16.2% of all workers )
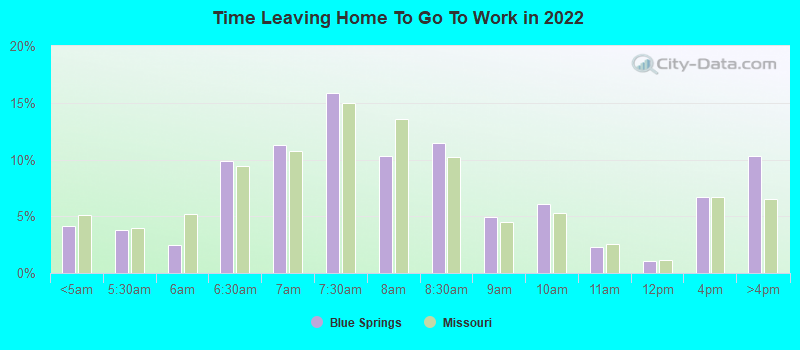
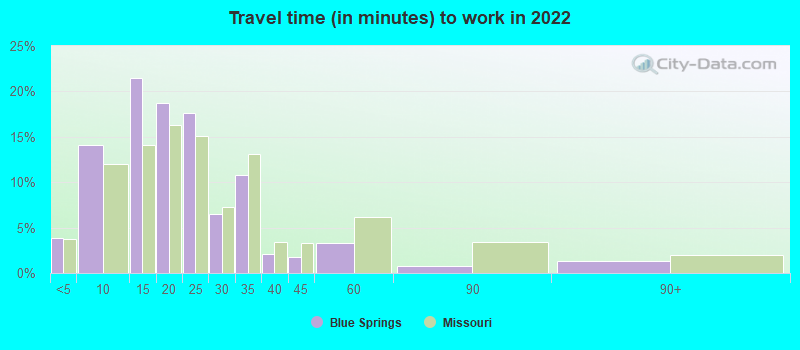
Travel time to work (commute)
Less than 5 minutes: 7465 to 9 minutes: 2,44710 to 14 minutes: 3,21315 to 19 minutes: 3,40920 to 24 minutes: 2,90825 to 29 minutes: 1,61530 to 34 minutes: 3,67135 to 39 minutes: 86940 to 44 minutes: 1,41445 to 59 minutes: 2,69360 to 89 minutes: 50590 or more minutes: 446
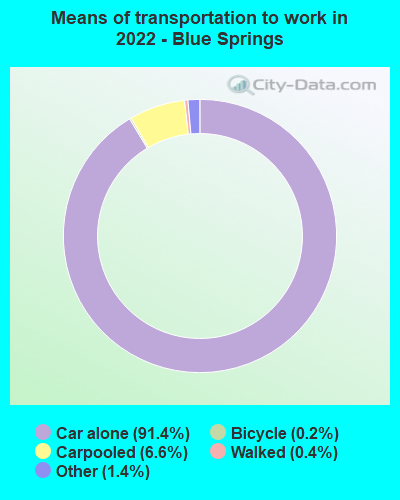
Means of transportation to work:
Drove a car alone: 15,105 (73.5%)Carpooled: 1,086 (5.3%)Bus : 2 (0.0%)Taxi: 226 (1.1%)Bicycle: 29 (0.1%)Walked: 57 (0.3%)Worked at home: 4,681 (22.8%)
Unemployment by race in 2022
Unemployment rate for White non-Hispanic residents 3.0% Males2.2% FemalesUnemployment rate for Black residents 2.4% Males0.8% FemalesUnemployment rate for Asian residents 30.0% MalesUnemployment rate for other race residents 7.0% MalesUnemployment rate for Hispanic or Latino residents 2.4% Males10.6% Females
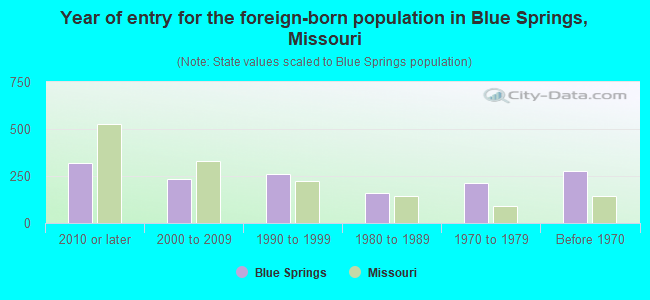
Year of entry for the foreign-born population in Blue Springs, Missouri
318 2010 or later 234 2000 to 2009 258 1990 to 1999 161 1980 to 1989 215 1970 to 1979 277 Before 1970
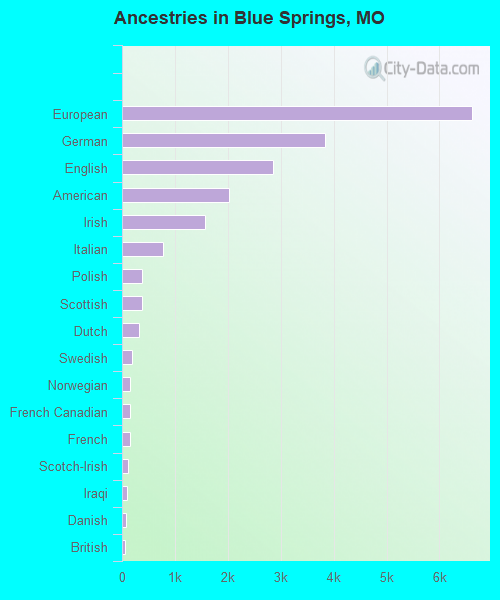
First ancestries reported:
European: 6,607 (24.5%)
German: 3,845 (14.3%)
English: 2,863 (10.6%)
American: 2,031 (7.5%)
Irish: 1,561 (5.8%)
Italian: 771 (2.9%)
Polish: 377 (1.4%)
Scottish: 371 (1.4%)
Dutch: 330 (1.2%)
Swedish: 183 (0.7%)
Norwegian: 154 (0.6%)
French Canadian: 151 (0.6%)
French: 144 (0.5%)
Scotch-Irish: 116 (0.4%)
Iraqi: 98 (0.4%)
Danish: 83 (0.3%)
British: 65 (0.2%)
Eastern European: 46 (0.2%)
Belgian: 45 (0.2%)
African: 42 (0.2%)
Welsh: 41 (0.2%)
Finnish: 35 (0.1%)
Ukrainian: 31 (0.1%)
Croatian: 28 (0.1%)
Russian: 26 (0.10%)
Nigerian: 26 (0.10%)
Greek: 23 (0.09%)
Sierra Leonean: 23 (0.09%)
Trinidadian and Tobagonian: 21 (0.08%)
Romanian: 18 (0.07%)
Austrian: 15 (0.06%)
Scandinavian: 14 (0.05%)
Jamaican: 12 (0.04%)
Czech: 10 (0.04%)
Iranian: 10 (0.04%)
Moroccan: 9 (0.03%)
Lithuanian: 8 (0.03%)
Canadian: 8 (0.03%)
Northern European: 7 (0.03%)
Yugoslavian: 5 (0.02%) Most common places of birth for foreign-born residents (%): Mexico Blue Springs:
25.1% (287)Missouri:
14.9% (38,568)
Honduras Blue Springs:
12.8% (147)Missouri:
2.1% (5,346)
Korea Blue Springs:
11.7% (134)Missouri:
2.9% (7,525)
Philippines Blue Springs:
10.1% (116)Missouri:
4.2% (10,873)
Iran Blue Springs:
7.1% (81)Missouri:
0.6% (1,625)
El Salvador Blue Springs:
5.9% (67)Missouri:
1.5% (3,926)
England Blue Springs:
3.1% (35)Missouri:
1.1% (2,796)
Germany Blue Springs:
3.1% (35)Missouri:
3.0% (7,803)
India Blue Springs:
2.6% (30)Missouri:
8.9% (22,932)
Vietnam Blue Springs:
2.6% (30)Missouri:
4.1% (10,700)
Japan Blue Springs:
2.5% (29)Missouri:
0.7% (1,818)
Ukraine Blue Springs:
2.4% (27)Missouri:
1.1% (2,895)
Romania Blue Springs:
2.4% (27)Missouri:
0.6% (1,481)
Nigeria Blue Springs:
2.1% (24)Missouri:
1.4% (3,640)
Bolivia Blue Springs:
1.8% (21)Missouri:
0.2% (397)
Cuba Blue Springs:
1.7% (20)Missouri:
1.1% (2,867)
China, excluding Hong Kong and Taiwan Blue Springs:
1.6% (18)Missouri:
6.6% (17,002)
Canada Blue Springs:
1.6% (18)Missouri:
1.9% (4,806)
Place of birth for U.S.-born residents:
This state: 36,959Other state: 20,068Northeast: 1,558Midwest: 10,206South: 3,858West: 4,585 86.3% of Blue Springs residents lived in the same house 1 years ago.
Out of people who lived in different houses, 42.4% lived in this county.
Out of people who lived in different counties, 44.2% lived in Missouri.
Blue Springs:
86.3%State average:
87.1%
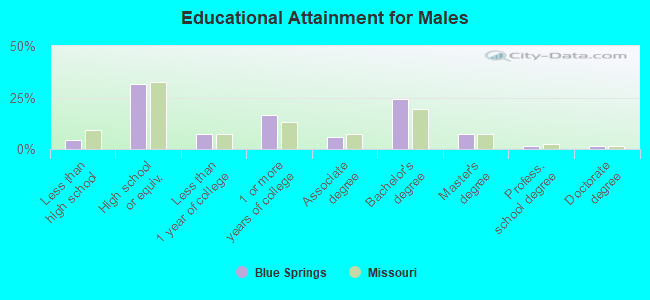
Education attainment for males 25 years and older:
No schooling: 254Nursery to 4th grade: 15th and 6th grade: 17th and 8th grade: 349th grade: 3410th grade: 12311th grade: 11412th grade, no diploma: 238High school graduate (or equivalency): 5,790Less than 1 year of college: 1,341Some college more than 1 year, no degree: 3,046Associate degree: 1,076Bachelor's degree: 4,407Master's degree: 1,293Professional school degree: 268Doctorate degree: 229
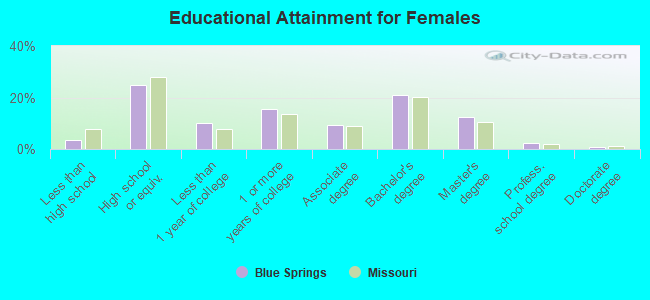
Education attainment for females 25 years and older:
No schooling: 38Nursery to 4th grade: 105th and 6th grade: 07th and 8th grade: 189th grade: 6910th grade: 15811th grade: 18412th grade, no diploma: 222High school graduate (or equivalency): 5,083Less than 1 year of college: 2,093Some college more than 1 year, no degree: 3,204Associate degree: 1,931Bachelor's degree: 4,302Master's degree: 2,512Professional school degree: 478Doctorate degree: 125
Housing units in structures:
One, detached: 16,359One, attached: 2,273Two: 9393 or 4: 1,2655 to 9: 84010 to 19: 54820 to 49: 24950 or more: 277Mobile homes: 70Housing units lacking complete plumbing facilities in 2022: 0.2%Housing units lacking complete kitchen facilities in 2022: 0.5%House/condo owner moved in on average 10 years ago
Renter moved in on average 3 years ago
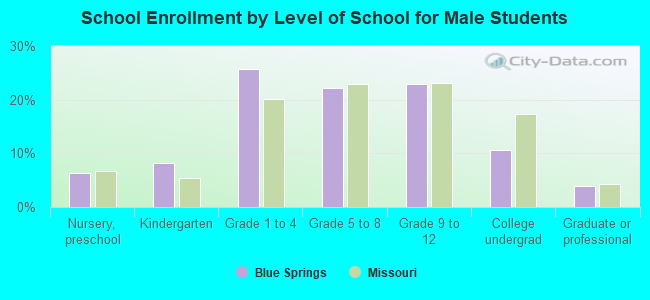
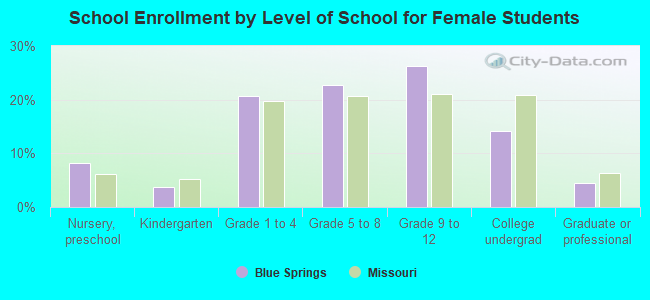
Private vs. public school enrollment:
Students in private schools in grades 1 to 8 (elementary and middle school): 530 Students in private schools in grades 9 to 12 (high school): 169 Students in private undergraduate colleges: 164