Bourbon, IN (Indiana) Houses and Residents
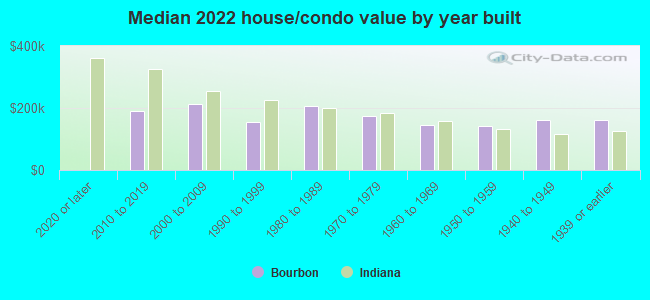
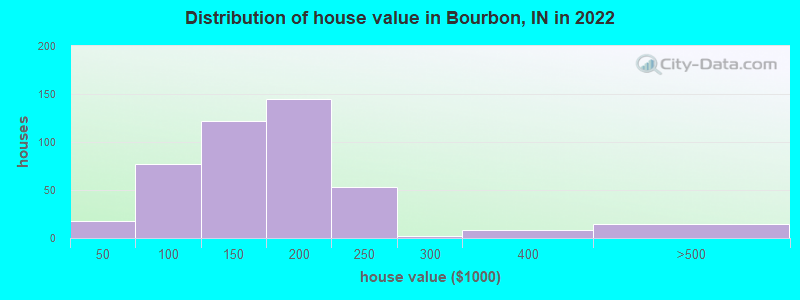
| Bourbon: | $165,164 |
| Indiana: | $208,700 |
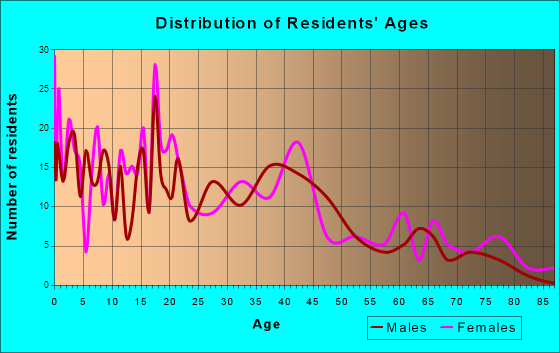
Total population: 1,791 (Urban population: 0, Rural population: 1,710 (all nonfarm))
Houses: 765 (677 occupied: 481 owner occupied, 203 renter occupied)
| % of renters here: | 30% |
| State: | 29% |
Housing density: 738 houses/condos per square mile
Median price asked for vacant for-sale houses and condos in 2022: $127,806.
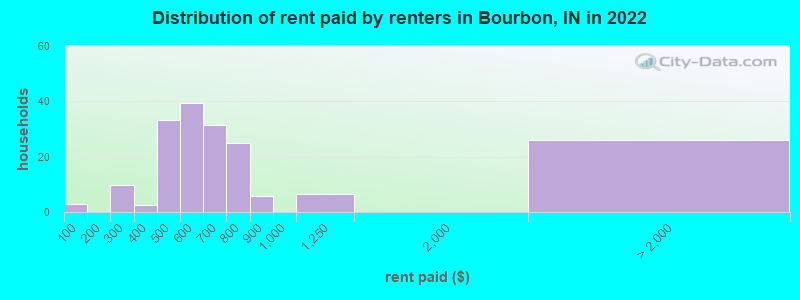
Median contract rent in 2022: $585 (lower quartile is $483, upper quartile is $708)
Median rent asked for vacant for-rent units in 2022: $604
Median gross rent in Bourbon, IN in 2022: $810
Housing units in Bourbon with a mortgage: 268 (15 second mortgage, 0 home equity loan, 16 both second mortgage and home equity loan)
Houses without a mortgage: 16
Median household income for houses/condos with a mortgage: $78,944
Median household income for apartments without a mortgage: $67,969
Median monthly housing costs: $761
Compare current foreclosures near Bourbon, IN:
| Photo | Address | Area | Beds / Baths | Price | Details |
|---|---|---|---|---|---|

|
#1
State Road 10
Bourbon, IN 46504
|
1,285 sq. feet
|
1 baths 4 beds |
show details | |

|
#2
E North St
Bourbon, IN 46504
|
1,816 sq. feet
|
1 baths 4 beds |
show details | |

|
#3
N Thompson St
Bourbon, IN 46504
|
- sq. feet
|
- baths - beds |
show details | |

|
#4
E Center St Apt 5d
Bourbon, IN 46504
|
- sq. feet
|
- baths - beds |
show details | |

|
#5
N Michigan St
Plymouth, IN 46563
|
2,016 sq. feet
|
2 baths 3 beds |
show details | |

|
#6
N Walnut St
Etna Green, IN 46524
|
2,203 sq. feet
|
2 baths 4 beds |
show details | |

|
#7
Park St
Rochester, IN 46975
|
1,088 sq. feet
|
1 baths 3 beds |
show details | |

|
#8
S Elm St
Nappanee, IN 46550
|
1,120 sq. feet
|
1 baths 3 beds |
show details | |

|
#9
N Rosenberger St
Nappanee, IN 46550
|
1,274 sq. feet
|
2 baths 3 beds |
show details | |

|
#10
King Rd
Plymouth, IN 46563
|
1,888 sq. feet
|
2 baths 2 beds |
show details |
| Photo | Address | Area | Beds / Baths | Price | Details |
|---|---|---|---|---|---|

|
#11
Blackstone Blvd
Nappanee, IN 46550
|
1,398 sq. feet
|
1 baths 2 beds |
show details | |

|
#12
W Riverchase Dr
Warsaw, IN 46582
|
1,568 sq. feet
|
2 baths 4 beds |
show details | |

|
#13
W Cherry Tree Dr
Warsaw, IN 46582
|
988 sq. feet
|
1 baths 3 beds |
show details | |

|
#14
W Market St
Warsaw, IN 46580
|
976 sq. feet
|
1 baths 2 beds |
show details | |

|
#15
Quince Rd
Plymouth, IN 46563
|
1,800 sq. feet
|
1 baths 3 beds |
show details | |

|
#16
W Sycamore Rd
Warsaw, IN 46580
|
1,976 sq. feet
|
2 baths 3 beds |
show details | |

|
#17
Maple Rd
Argos, IN 46501
|
1,040 sq. feet
|
1 baths 2 beds |
show details | |

|
#18
5th Rd
Plymouth, IN 46563
|
1,044 sq. feet
|
1 baths 2 beds |
show details | |

|
#19
Copeland St
Warsaw, IN 46580
|
1,328 sq. feet
|
2 baths 3 beds |
show details | |

|
#20
W Baker St
Warsaw, IN 46580
|
1,820 sq. feet
|
2 baths 3 beds |
show details |
| Photo | Address | Area | Beds / Baths | Price | Details |
|---|---|---|---|---|---|

|
#21
Oak Ct
Plymouth, IN 46563
|
2,640 sq. feet
|
2 baths 4 beds |
show details | |

|
#22
Maplewood Ave
Plymouth, IN 46563
|
1,470 sq. feet
|
1 baths 3 beds |
show details | |

|
#23
Kenwood Ave
Plymouth, IN 46563
|
1,125 sq. feet
|
1 baths 4 beds |
show details | |

|
#24
Second St
Rochester, IN 46975
|
1,080 sq. feet
|
1 baths 2 beds |
show details | |

|
#25
Lake Ave
Plymouth, IN 46563
|
1,180 sq. feet
|
1 baths 3 beds |
show details | |

|
#26
Henderson Dr
Warsaw, IN 46580
|
1,594 sq. feet
|
1 baths 3 beds |
show details | |

|
#27
Raintree Rd
Warsaw, IN 46582
|
1,596 sq. feet
|
1 baths 3 beds |
show details | |

|
#28
E Birchwood Ct
Warsaw, IN 46582
|
1,572 sq. feet
|
2 baths 4 beds |
show details | |

|
#29
Husky Trl
Warsaw, IN 46582
|
1,622 sq. feet
|
1 baths 6 beds |
show details | |

|
#30
Pontiac St
Rochester, IN 46975
|
2,048 sq. feet
|
2 baths 3 beds |
show details |
| Photo | Address | Area | Beds / Baths | Price | Details |
|---|---|---|---|---|---|

|
#31
Widaman St
Winona Lake, IN 46590
|
1,936 sq. feet
|
1 baths 3 beds |
show details | |

|
#32
W 5th St
Rochester, IN 46975
|
1,536 sq. feet
|
1 baths 2 beds |
show details | |

|
#33
W 3rd St
Rochester, IN 46975
|
1,502 sq. feet
|
1 baths 2 beds |
show details | |

|
#34
S Blue Spruce Rd
Warsaw, IN 46580
|
1,380 sq. feet
|
2 baths 3 beds |
show details | |

|
#35
E Sycamore Dr
Warsaw, IN 46580
|
1,073 sq. feet
|
2 baths 3 beds |
show details | |

|
#36
S Main St
Milford, IN 46542
|
2,446 sq. feet
|
1 baths 3 beds |
show details | |

|
#37
Nancy St
Warsaw, IN 46580
|
1,240 sq. feet
|
2 baths 3 beds |
show details | |

|
#38
E Wellington Dr
Warsaw, IN 46582
|
2,800 sq. feet
|
2 baths 2 beds |
show details | |

|
#39
Highlander Dr
Warsaw, IN 46580
|
1,433 sq. feet
|
2 baths 3 beds |
show details | |

|
#40
E 200 N
Rochester, IN 46975
|
2,114 sq. feet
|
2 baths 4 beds |
show details |
| Photo | Address | Area | Beds / Baths | Price | Details |
|---|---|---|---|---|---|

|
#41
Rose Rd
Plymouth, IN 46563
|
1,300 sq. feet
|
2 baths 3 beds |
show details | |

|
#42
Lincoln Dr
Warsaw, IN 46580
|
2,580 sq. feet
|
2 baths 4 beds |
show details | |

|
#43
N Johnson St
Warsaw, IN 46580
|
1,872 sq. feet
|
1 baths 3 beds |
show details | |

|
#44
E Main St
Warsaw, IN 46580
|
1,800 sq. feet
|
1 baths 3 beds |
show details | |

|
#45
E Olson Rd
Rochester, IN 46975
|
1,896 sq. feet
|
2 baths 4 beds |
show details | |

|
#46
E Center St
Warsaw, IN 46580
|
2,536 sq. feet
|
2 baths 4 beds |
show details | |

|
#47
W 450 N
Rochester, IN 46975
|
1,190 sq. feet
|
1 baths 3 beds |
show details | |

|
#48
Sunfish Dr
Warsaw, IN 46580
|
2,134 sq. feet
|
2 baths 3 beds |
show details | |

|
#49
W Old Road 30
Warsaw, IN 46580
|
1,848 sq. feet
|
2 baths 3 beds |
show details | |

|
Check over 1 million property listings on Foreclosure.com!
|
browse all offers | |||

Latest news about housing in Bourbon, IN collected exclusively by city-data.com from local newspapers, TV, and radio stations

 | Increasing Violent Crime Rates (203 replies) |
| Indianapolis hosting the Superbowl (413 replies) |
| New-ish to town... Things to do? (7 replies) |
| Why Doesn't Fort Wayne Have Many Restaurants and Stores??? (35 replies) |
| Indiana bank ratings (7 replies) |
Median year apartment built: 1969
Household type by relationship:
Households: 1,759- Male householders: 330 (106 living alone), Female householders: 341 (113 living alone)
297 spouses (297 opposite-sex spouses), 34 unmarried partners, (34 opposite-sex unmarried partners), 671 children (606 natural, 9 adopted, 56 stepchildren), 15 grandchildren, 4 brothers or sisters, 15 parents, 0 foster children, 27 other relatives, 23 non-relatives
Size of family households: 137 2-persons, 158 3-persons, 62 4-persons, 39 5-persons, 26 6-persons, 17 7-or-more-persons.
Size of nonfamily households: 226 1-person, 19 2-persons.
314 married couples with children.
203 single-parent households (60 men, 143 women).
98.3% of residents of Bourbon speak English at home.
0.2% of residents speak Spanish at home (100% speak English very well).
0.3% of residents speak Asian or Pacific Island language at home (40% speak English very well, 60% speak English well).
Foreign born population: 9 (0.5%)
(44.4% of them are naturalized citizens)
| Here: | 7.2 |
| State: | 6.6 |
| Here: | 4.6 |
| State: | 4.3 |
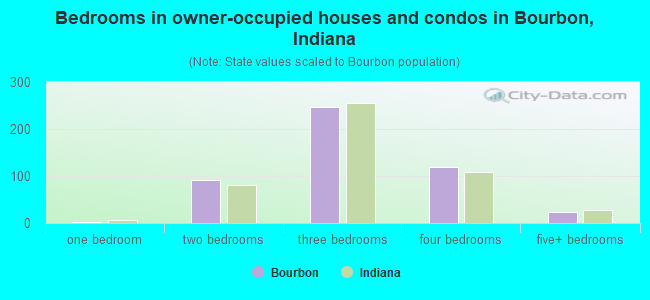
- Bedrooms in owner-occupied houses and condos in Bourbon, Indiana
- 0no bedroom
- 21 bedroom
- 912 bedrooms
- 2473 bedrooms
- 1194 bedrooms
- 235+ bedrooms
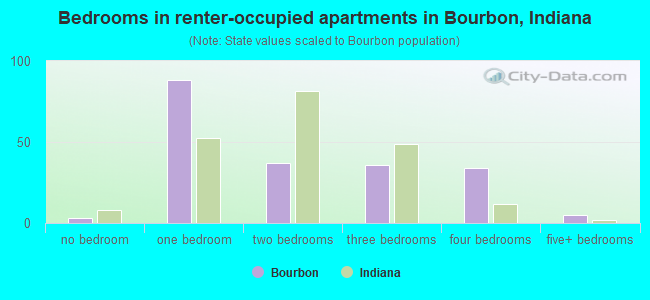
- Bedrooms in renter-occupied apartments in Bourbon, Indiana
- 3no bedroom
- 881 bedroom
- 372 bedrooms
- 363 bedrooms
- 344 bedrooms
- 55+ bedrooms
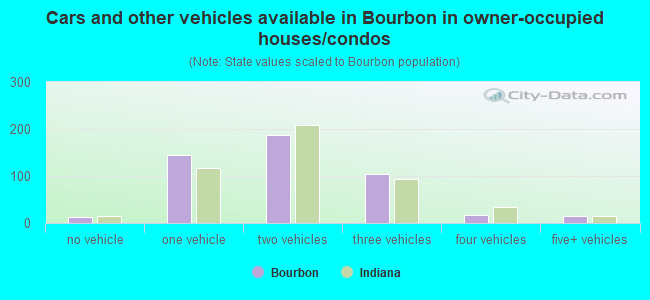
- Cars and other vehicles available in Bourbon in owner-occupied houses/condos
- 13no vehicle
- 1451 vehicle
- 1872 vehicles
- 1053 vehicles
- 164 vehicles
- 155+ vehicles
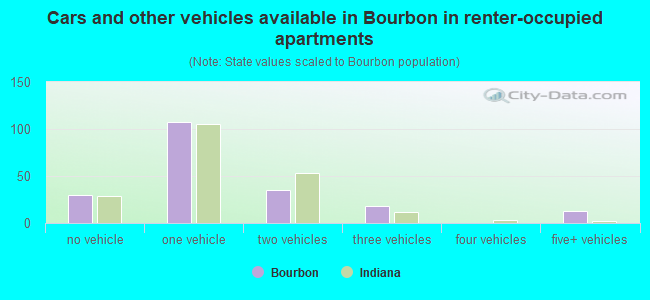
- Cars and other vehicles available in Bourbon in renter-occupied apartments
- 30no vehicle
- 1071 vehicle
- 352 vehicles
- 183 vehicles
- 04 vehicles
- 135+ vehicles
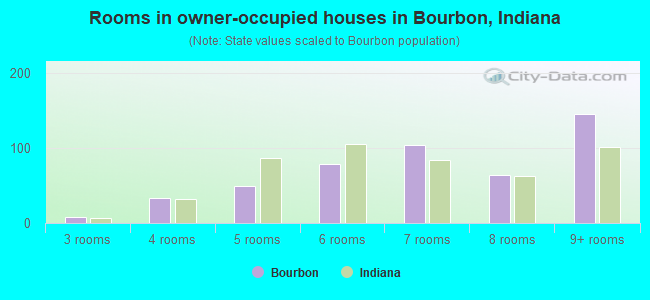
- Rooms in owner-occupied houses in Bourbon, Indiana
- 01 room
- 02 rooms
- 83 rooms
- 334 rooms
- 495 rooms
- 796 rooms
- 1047 rooms
- 648 rooms
- 1459+ rooms
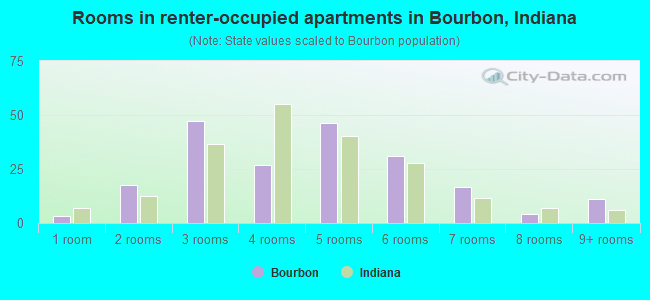
- Rooms in renter-occupied apartments in Bourbon, Indiana
- 31 room
- 172 rooms
- 473 rooms
- 274 rooms
- 465 rooms
- 316 rooms
- 167 rooms
- 48 rooms
- 119+ rooms
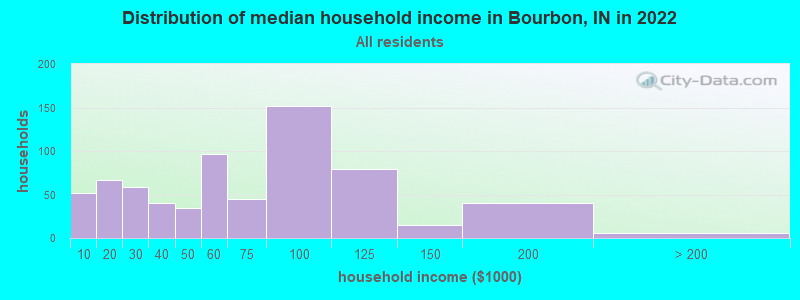
Bourbon, IN household income distribution

- 52Less than $10,000
- 67$10,000 to $19,999
- 59$20,000 to $29,999
- 40$30,000 to $39,999
- 35$40,000 to $49,999
- 96$50,000 to $59,999
- 45$60,000 to $74,999
- 152$75,000 to $99,999
- 79$100,000 to $124,999
- 15$125,000 to $149,999
- 40$150,000 to $199,999
- 6$200,000 or more
Home value of owner - occupied houses in 2022 in Bourbon, IN
-
- 2Less than $10,000
- 3$10,000 to $14,999
- 3$25,000 to $29,999
- 2$35,000 to $39,999
- 6$40,000 to $49,999
- 12$50,000 to $59,999
- 18$60,000 to $69,999
- 17$70,000 to $79,999
- 12$80,000 to $89,999
- 9$90,000 to $99,999
- 44$100,000 to $124,999
- 77$125,000 to $149,999
- 102$150,000 to $174,999
- 41$175,000 to $199,999
- 52$200,000 to $249,999
- 2$250,000 to $299,999
- 8$300,000 to $399,999
- 15$400,000 to $499,999
Rent paid by renters in 2022 in Bourbon, IN
-
- 2Less than $100
- 9$250 to $299
- 2$350 to $399
- 8$400 to $449
- 25$450 to $499
- 39$550 to $599
- 16$600 to $649
- 14$650 to $699
- 11$700 to $749
- 12$750 to $799
- 5$800 to $899
- 6$1,000 to $1,249
- 25No cash rent
Percentage of workers working in this county: 50.1%
Number of people working at home: 57 (6.8% of all workers)
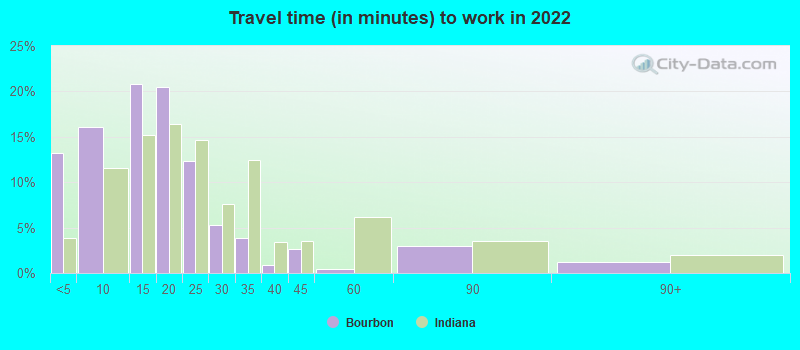
Travel time to work (commute)
- Less than 5 minutes: 95
- 5 to 9 minutes: 56
- 10 to 14 minutes: 54
- 15 to 19 minutes: 129
- 20 to 24 minutes: 200
- 25 to 29 minutes: 51
- 30 to 34 minutes: 71
- 35 to 39 minutes: 12
- 40 to 44 minutes: 16
- 45 to 59 minutes: 59
- 60 to 89 minutes: 27
- 90 or more minutes: 2
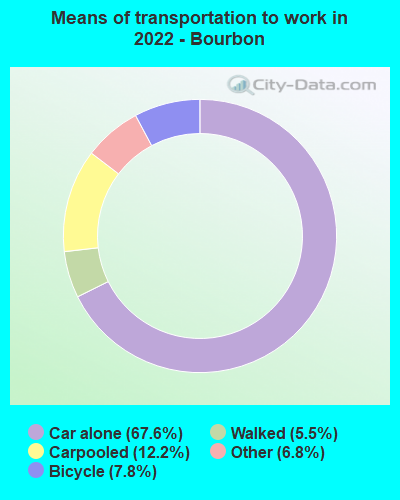
Means of transportation to work:
- Drove a car alone: 457 (61.1%)
- Carpooled: 91 (12.2%)
- Taxi: 54 (7.2%)
- Bicycle: 61 (8.2%)
- Walked: 37 (4.9%)
- Worked at home: 57 (7.6%)
- Unemployment by race in 2022
- Unemployment rate for White non-Hispanic residents
- 1.1%Males
- 3.6%Females
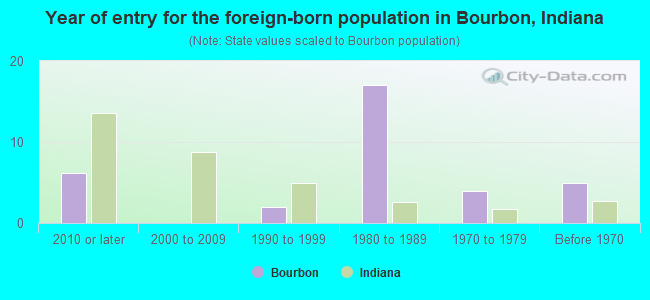
- Year of entry for the foreign-born population in Bourbon, Indiana
- 62010 or later
- 02000 to 2009
- 21990 to 1999
- 171980 to 1989
- 41970 to 1979
- 5Before 1970
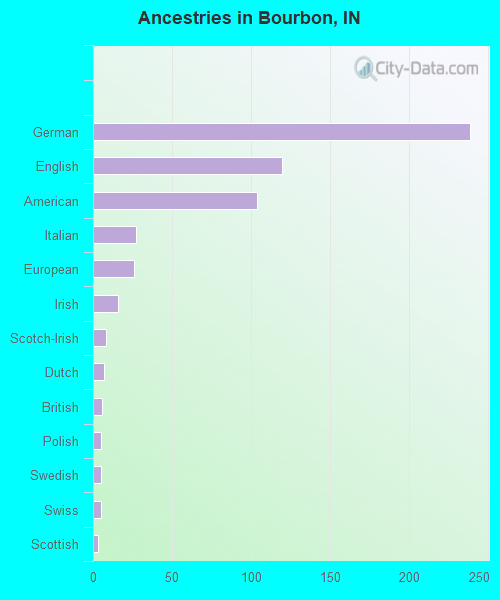
First ancestries reported:
- German: 239 (33.7%)
- English: 120 (16.9%)
- American: 104 (14.7%)
- Italian: 27 (3.8%)
- European: 26 (3.7%)
- Irish: 16 (2.3%)
- Scotch-Irish: 8 (1.1%)
- Dutch: 7 (1.0%)
- British: 6 (0.8%)
- Polish: 5 (0.7%)
- Swedish: 5 (0.7%)
- Swiss: 5 (0.7%)
- Scottish: 3 (0.4%)
- Austrian: 2 (0.3%)
- Celtic: 1 (0.1%)
Most common places of birth for foreign-born residents (%):
| Bourbon: | 88.9% (8) |
| Indiana: | 3.1% (11,851) |
Place of birth for U.S.-born residents:
- This state: 1,449
- Other state: 281
- Northeast: 34
- Midwest: 171
- South: 30
- West: 48
90.0% of Bourbon residents lived in the same house 1 years ago.
Out of people who lived in different houses, 29.8% lived in this county.
Out of people who lived in different counties, 90.5% lived in Indiana.
| Bourbon: | 90.0% |
| State average: | 87.1% |
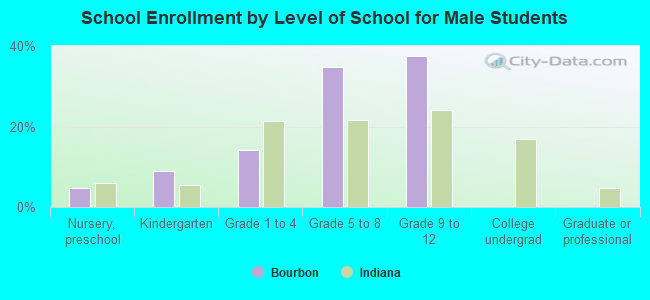
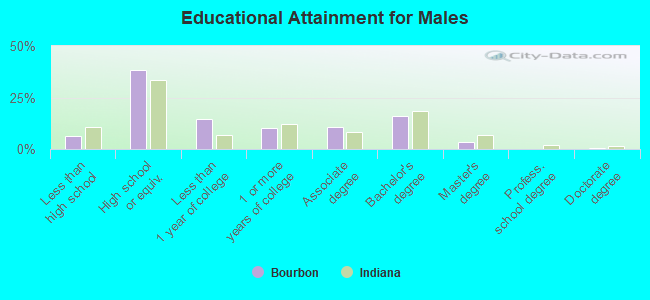
Education attainment for males 25 years and older:
- No schooling: 0
- Nursery to 4th grade: 0
- 5th and 6th grade: 0
- 7th and 8th grade: 0
- 9th grade: 3
- 10th grade: 10
- 11th grade: 6
- 12th grade, no diploma: 13
- High school graduate (or equivalency): 191
- Less than 1 year of college: 74
- Some college more than 1 year, no degree: 51
- Associate degree: 53
- Bachelor's degree: 81
- Master's degree: 16
- Professional school degree: 0
- Doctorate degree: 3
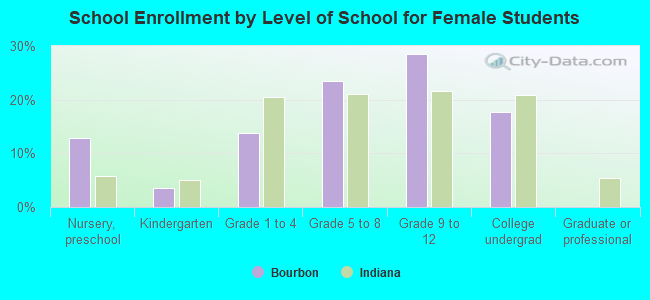
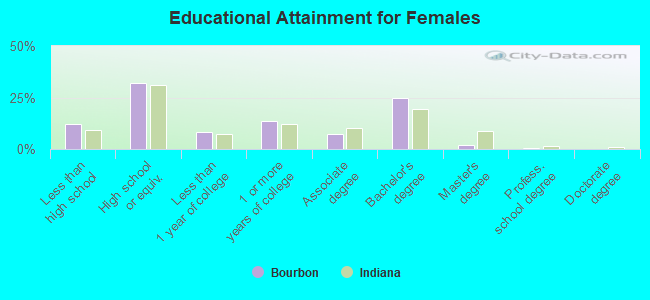
Education attainment for females 25 years and older:
- No schooling: 3
- Nursery to 4th grade: 0
- 5th and 6th grade: 0
- 7th and 8th grade: 0
- 9th grade: 0
- 10th grade: 14
- 11th grade: 19
- 12th grade, no diploma: 34
- High school graduate (or equivalency): 182
- Less than 1 year of college: 46
- Some college more than 1 year, no degree: 78
- Associate degree: 41
- Bachelor's degree: 140
- Master's degree: 11
- Professional school degree: 2
- Doctorate degree: 0
Housing units in structures:
- One, detached: 605
- One, attached: 2
- Two: 19
- 3 or 4: 82
- 5 to 9: 8
- 10 to 19: 11
- 20 to 49: 29
- Mobile homes: 8
Housing units lacking complete kitchen facilities in 2022: 7.0%
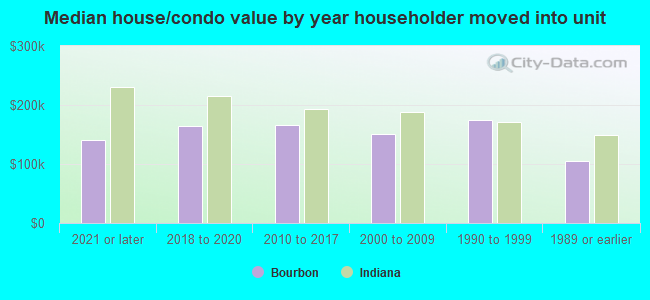
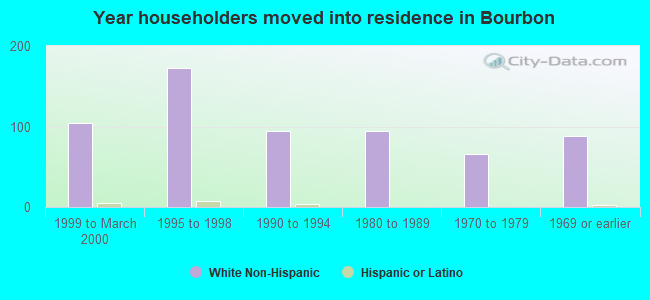
House/condo owner moved in on average 14 years ago
Renter moved in on average 6 years ago
Private vs. public school enrollment:
| Here: | 0.0% |
| Indiana: | 14.9% |
| Here: | 0.0% |
| Indiana: | 11.4% |
| Here: | 0.0% |
| Indiana: | 22.3% |