Brandon, FL (Florida) Houses and Residents
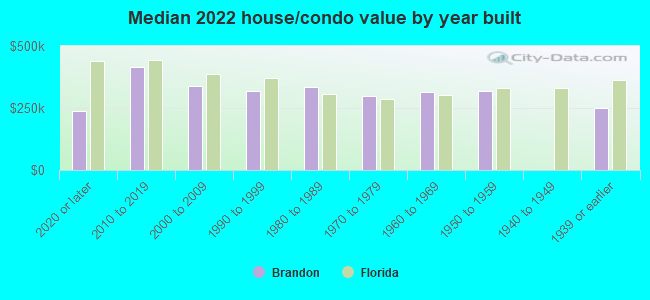
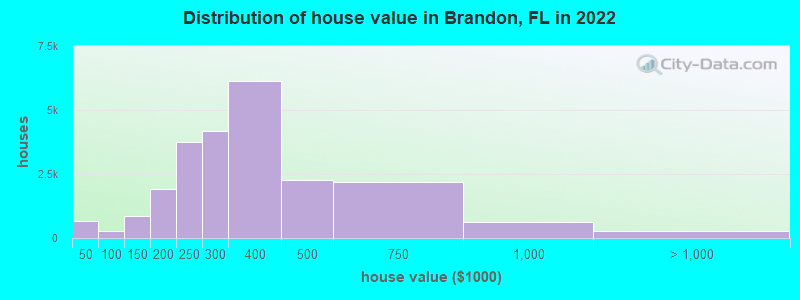
Estimated median house or condo value in 2022: $325,500 (it was $100,200 in 2000 )
Brandon:
$325,500Florida:
$354,100
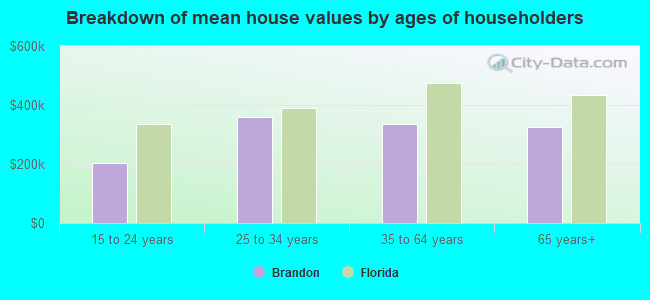
Lower value quartile - upper value quartile: $243,500 - $418,400Mean price in 2022: Detached houses: $394,063 Here:
$394,063State:
$500,941
Townhouses or other attached units: $222,886 Here:
$222,886State:
$370,869
In 3-to-4-unit structures: $209,639 Here:
$209,639State:
$309,944
In 5-or-more-unit structures: $265,066 Here:
$265,066State:
$447,145
Mobile homes: $148,133 Here:
$148,133State:
$113,202
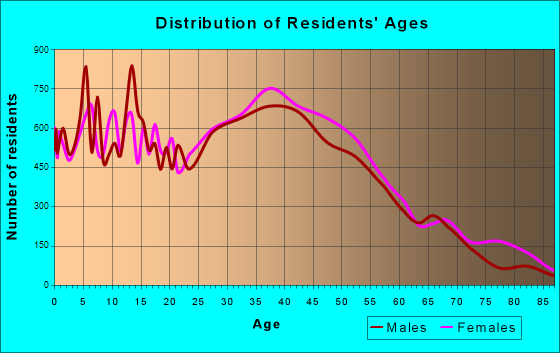
Total population: 103,483 (Urban population: 77,732, Rural population: 0)
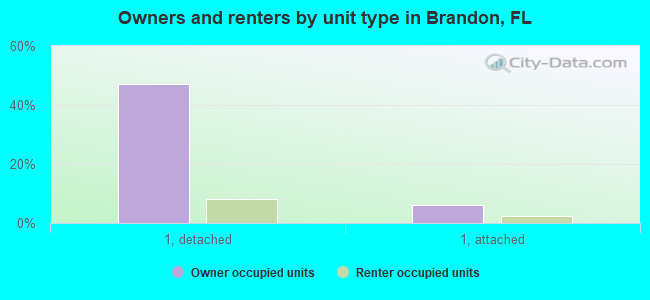
Houses: 49,576 (46,975 occupied: 25,827 owner occupied, 21,148 renter occupied )
% of renters here:
45%State:
33%
Housing density: 1,726 houses/condos per square mile
Median price asked for vacant for-sale houses and condos in 2022: $405,467.
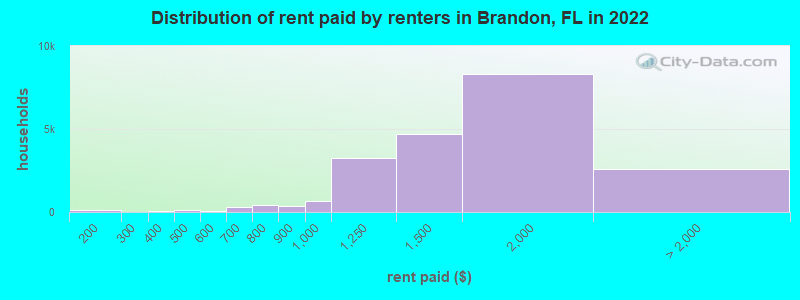
Median contract rent in 2022: $1,597 (lower quartile is $1,203, upper quartile is $1,946)
Median rent asked for vacant for-rent units in 2022: $2,009
Median gross rent in Brandon, FL in 2022: $1,717
Housing units in Brandon with a mortgage: 17,653 (1,639 second mortgage, 135 home equity loan, 1,415 both second mortgage and home equity loan )Houses without a mortgage: 223
Median household income for houses/condos with a mortgage: $94,075
Median household income for apartments without a mortgage: $80,771
Median monthly housing costs: $1,502
Data:
Median house or condo value ($)
Median house or condo value ($ change since 2000)
Median house or condo value ($) - White
Median house or condo value ($) - Black or African American
Median house or condo value ($) - Asian
Median house or condo value ($) - Hispanic or Latino
Median house or condo value ($) - American Indian and Alaska Native
Median house or condo value ($) - Multirace
Median house or condo value ($) - Other Race
Median price asked for mobile homes ($)
Household density (households per square mile)
Mean house or condo value by units in structure - 1, detached ($)
Mean house or condo value by units in structure - 1, attached ($)
Mean house or condo value by units in structure - 2 ($)
Mean house or condo value by units in structure by units in structure - 3 or 4 ($)
Mean house or condo value by units in structure - 5 or more ($)
Mean house or condo value by units in structure - Boat, RV, van, etc. ($)
Mean house or condo value by units in structure - Mobile home ($)
Median contract rent ($)
Median contract rent - Lower quartile ($)
Median contract rent - Upper quartile ($)
Median gross rent ($)
Urban houses (%)
Rural houses (%)
Houses occupied (%)
Houses occupied (% change since 2000)
Houses owner occupied (%)
Houses owner occupied (% change since 2000)
Houses renter occupied (%)
Houses renter occupied (% change since 2000)
Vacant housing units - For rent (%)
Vacant housing units - For rent (% change since 2000)
Vacant housing units - For sale only (%)
Vacant housing units - For sale only (% change since 2000)
Vacant housing units - Rented or sold, not occupied (%)
Vacant housing units - Rented or sold, not occupied (% change since 2000)
Vacant housing units - For seasonal, recreational, or occasional use (%)
Vacant housing units - For seasonal, recreational, or occasional use (% change since 2000)
Vacant housing units - For migrant workers (%)
Vacant housing units - For migrant workers (% change since 2000)
Vacant housing units - Other vacant (%)
Vacant housing units - Other vacant (% change since 2000)
Median monthly housing costs ($)
Median household income for houses/condos with a mortgage ($)
Median household income for houses/condos without a mortgage ($)
Median household income ($)
Median household income ($) - White
Median household income ($) - Black or African American
Median household income ($) - Asian
Median household income ($) - Hispanic or Latino
Median household income ($) - American Indian and Alaska Native
Median household income ($) - Multirace
Median household income ($) - Other Race
Mortgage status - with mortgage (%)
Mortgage status - with second mortgage (%)
Mortgage status - with home equity loan (%)
Mortgage status - with both second mortgage and home equity loan (%)
Mortgage status - without a mortgage (%)
Median year house/condo built
Median year apartment built
Household type by relationship - Male householder living alone (%)
Household type by relationship - Male householder not living alone (%)
Household type by relationship - Female householder living alone (%)
Household type by relationship - Female householder not living alone (%)
Household type by relationship - Opposite-Sex spouse (%)
Household type by relationship - Same-Sex spouse (%)
Household type by relationship - Opposite-Sex unmarried partner (%)
Household type by relationship - Same-Sex unmarried partner (%)
Household type by relationship - In group quarters (%)
Size of family households - 2-person household (%)
Size of family households - 3-person household (%)
Size of family households - 4-person household (%)
Size of family households - 5-person household (%)
Size of family households - 6-person household (%)
Size of family households - 7-or-more-person household (%)
Size of nonfamily households - 1-person household (%)
Size of nonfamily households - 2-person household (%)
Size of nonfamily households - 3-person household (%)
Size of nonfamily households - 4-person household (%)
Size of nonfamily households - 5-person household (%)
Size of nonfamily households - 6-person household (%)
Size of nonfamily households - 7-or-moreperson household (%)
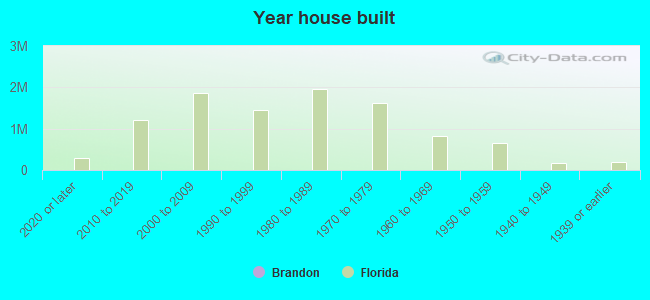
Year house built - Built 2010 or later (%)
Year house built - Built 2000 to 2009 (%)
Year house built - Built 1990 to 1999 (%)
Year house built - Built 1980 to 1989 (%)
Year house built - Built 1970 to 1979 (%)
Year house built - Built 1960 to 1969 (%)
Year house built - Built 1950 to 1959 (%)
Year house built - Built 1940 to 1949 (%)
Year house built - Built 1939 or earlier (%)
Median number of rooms in houses and condos
Median number of rooms in apartments
Median number of bedrooms in owner occupied houses
Mean number of bedrooms in owner occupied houses
Median number of bedrooms in renter occupied houses
Mean number of bedrooms in renter occupied houses
Median number of vehichles in owner occupied houses
Mean number of vehichles in owner occupied houses
Median number of vehichles in renter occupied houses
Mean number of vehichles in renter occupied houses
Rooms in owner-occupied houses - 1 room (%)
Rooms in owner-occupied houses - 2 rooms (%)
Rooms in owner-occupied houses - 3 rooms (%)
Rooms in owner-occupied houses - 4 rooms (%)
Rooms in owner-occupied houses - 5 rooms (%)
Rooms in owner-occupied houses - 6 rooms (%)
Rooms in owner-occupied houses - 7 rooms (%)
Rooms in owner-occupied houses - 8 rooms (%)
Rooms in owner-occupied houses - 9+ rooms (%)
Rooms in renter-occupied houses - 1 room (%)
Rooms in renter-occupied houses - 2 rooms (%)
Rooms in renter-occupied houses - 3 rooms (%)
Rooms in renter-occupied houses - 4 rooms (%)
Rooms in renter-occupied houses - 5 rooms (%)
Rooms in renter-occupied houses - 6 rooms (%)
Rooms in renter-occupied houses - 7 rooms (%)
Rooms in renter-occupied houses - 8 rooms (%)
Rooms in renter-occupied houses - 9+ rooms (%)
Bedrooms in owner-occupied houses - no bedrooms (%)
Bedrooms in owner-occupied houses - 1 bedroom (%)
Bedrooms in owner-occupied houses - 2 bedrooms (%)
Bedrooms in owner-occupied houses - 3 bedrooms (%)
Bedrooms in owner-occupied houses - 4 bedrooms (%)
Bedrooms in owner-occupied houses - 5+ bedrooms (%)
Bedrooms in renter-occupied houses - no bedrooms (%)
Bedrooms in renter-occupied houses - 1 bedroom (%)
Bedrooms in renter-occupied houses - 2 bedrooms (%)
Bedrooms in renter-occupied houses - 3 bedrooms (%)
Bedrooms in renter-occupied houses - 4 bedrooms (%)
Bedrooms in renter-occupied houses - 5+ bedrooms (%)
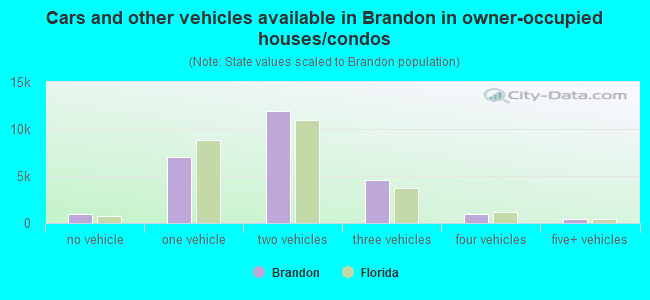
Vehicles available in owner-occupied houses - no vehicle available (%)
Vehicles available in owner-occupied houses - 1 vehicle available(%)
Vehicles available in owner-occupied houses - 2 Vehicles available (%)
Vehicles available in owner-occupied houses - 3 Vehicles available (%)
Vehicles available in owner-occupied houses - 4 Vehicles available (%)
Vehicles available in owner-occupied houses - 5+ Vehicles available (%)
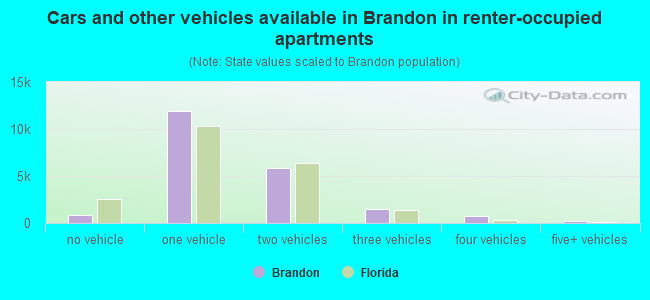
Vehicles available in renter-occupied houses - no vehicle available (%)
Vehicles available in renter-occupied houses - 1 vehicle available (%)
Vehicles available in renter-occupied houses - 2 Vehicles available (%)
Vehicles available in renter-occupied houses - 3 Vehicles available (%)
Vehicles available in renter-occupied houses - 4 Vehicles available (%)
Vehicles available in renter-occupied houses - 5+ Vehicles available (%)
Housing units in structures - 1, detached (%)
Housing units in structures - 1, attached (%)
Housing units in structures - 2 (%)
Housing units in structures - 3 or 4 (%)
Housing units in structures - 5 to 9 (%)
Housing units in structures - 10 to 19 (%)
Housing units in structures - 20 to 49 (%)
Housing units in structures - 50 or more (%)
Housing units in structures - Mobile home (%)
Housing units in structures - Boat, RV, van, etc. (%)
Housing units in structures - Owners - 1, detached (%)
Housing units in structures - Owners - 1, attached (%)
Housing units in structures - Owners - 2 (%)
Housing units in structures - Owners - 3 or 4 (%)
Housing units in structures - Owners - 5 to 9 (%)
Housing units in structures - Owners - 10 to 19 (%)
Housing units in structures - Owners - 20 to 49 (%)
Housing units in structures - Owners - 50 or more (%)
Housing units in structures - Owners - Mobile home (%)
Housing units in structures - Owners - Boat, RV, van, etc. (%)
Housing units in structures - Renters - 1, detached (%)
Housing units in structures - Renters - 1, attached (%)
Housing units in structures - Renters - 2 (%)
Housing units in structures - Renters - 3 or 4 (%)
Housing units in structures - Renters - 5 to 9 (%)
Housing units in structures - Renters - 10 to 19 (%)
Housing units in structures - Renters - 20 to 49 (%)
Housing units in structures - Renters - 50 or more (%)
Housing units in structures - Renters - Mobile home (%)
Housing units in structures - Renters - Boat, RV, van, etc. (%)
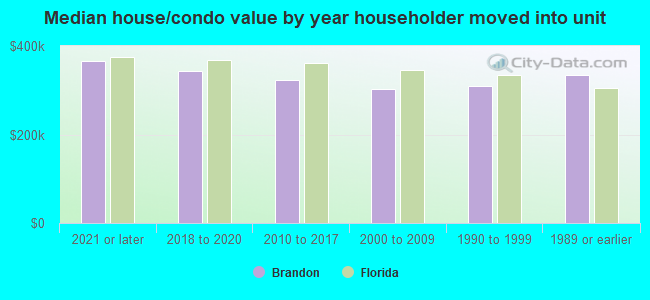
House/condo owner moved in on average (years ago)
Renter moved in on average (years ago)
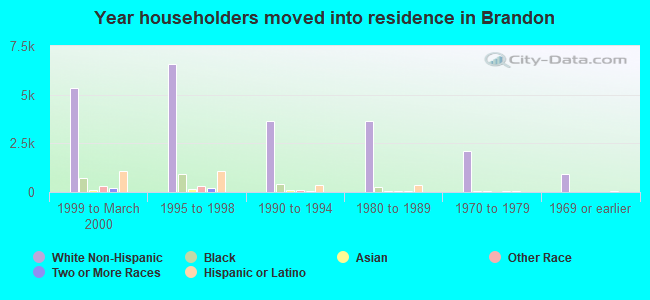
Year householder moved into unit - Moved in 1999 to March 2000 (%)
Year householder moved into unit - Moved in 1999 to March 2000 (%) - White
Year householder moved into unit - Moved in 1999 to March 2000 (%) - Black or African American
Year householder moved into unit - Moved in 1999 to March 2000 (%) - Asian
Year householder moved into unit - Moved in 1999 to March 2000 (%) - Hispanic or Latino
Year householder moved into unit - Moved in 1999 to March 2000 (%) - American Indian and Alaska Native
Year householder moved into unit - Moved in 1999 to March 2000 (%) - Multirace
Year householder moved into unit - Moved in 1999 to March 2000 (%) - Other Race
Year householder moved into unit - Moved in 1995 to 1998 (%)
Year householder moved into unit - Moved in 1995 to 1998 (%) - White
Year householder moved into unit - Moved in 1995 to 1998 (%) - Black or African American
Year householder moved into unit - Moved in 1995 to 1998 (%) - Asian
Year householder moved into unit - Moved in 1995 to 1998 (%) - Hispanic or Latino
Year householder moved into unit - Moved in 1995 to 1998 (%) - American Indian and Alaska Native
Year householder moved into unit - Moved in 1995 to 1998 (%) - Multirace
Year householder moved into unit - Moved in 1995 to 1998 (%) - Other Race
Year householder moved into unit - Moved in 1990 to 1994 (%)
Year householder moved into unit - Moved in 1990 to 1994 (%) - White
Year householder moved into unit - Moved in 1990 to 1994 (%) - Black or African American
Year householder moved into unit - Moved in 1990 to 1994 (%) - Asian
Year householder moved into unit - Moved in 1990 to 1994 (%) - Hispanic or Latino
Year householder moved into unit - Moved in 1990 to 1994 (%) - American Indian and Alaska Native
Year householder moved into unit - Moved in 1990 to 1994 (%) - Multirace
Year householder moved into unit - Moved in 1990 to 1994 (%) - Other Race
Year householder moved into unit - Moved in 1980 to 1989 (%)
Year householder moved into unit - Moved in 1980 to 1989 (%) - White
Year householder moved into unit - Moved in 1980 to 1989 (%) - Black or African American
Year householder moved into unit - Moved in 1980 to 1989 (%) - Asian
Year householder moved into unit - Moved in 1980 to 1989 (%) - Hispanic or Latino
Year householder moved into unit - Moved in 1980 to 1989 (%) - American Indian and Alaska Native
Year householder moved into unit - Moved in 1980 to 1989 (%) - Multirace
Year householder moved into unit - Moved in 1980 to 1989 (%) - Other Race
Year householder moved into unit - Moved in 1970 to 1979 (%)
Year householder moved into unit - Moved in 1970 to 1979 (%) - White
Year householder moved into unit - Moved in 1970 to 1979 (%) - Black or African American
Year householder moved into unit - Moved in 1970 to 1979 (%) - Asian
Year householder moved into unit - Moved in 1970 to 1979 (%) - Hispanic or Latino
Year householder moved into unit - Moved in 1970 to 1979 (%) - American Indian and Alaska Native
Year householder moved into unit - Moved in 1970 to 1979 (%) - Multirace
Year householder moved into unit - Moved in 1970 to 1979 (%) - Other Race
Year householder moved into unit - Moved in 1969 or earlier (%)
Year householder moved into unit - Moved in 1969 or earlier (%) - White
Year householder moved into unit - Moved in 1969 or earlier (%) - Black or African American
Year householder moved into unit - Moved in 1969 or earlier (%) - Asian
Year householder moved into unit - Moved in 1969 or earlier (%) - Hispanic or Latino
Year householder moved into unit - Moved in 1969 or earlier (%) - American Indian and Alaska Native
Year householder moved into unit - Moved in 1969 or earlier (%) - Multirace
Year householder moved into unit - Moved in 1969 or earlier (%) - Other Race
Housing units lacking complete plumbing facilities (%)
Housing units lacking complete kitchen facilities (%)
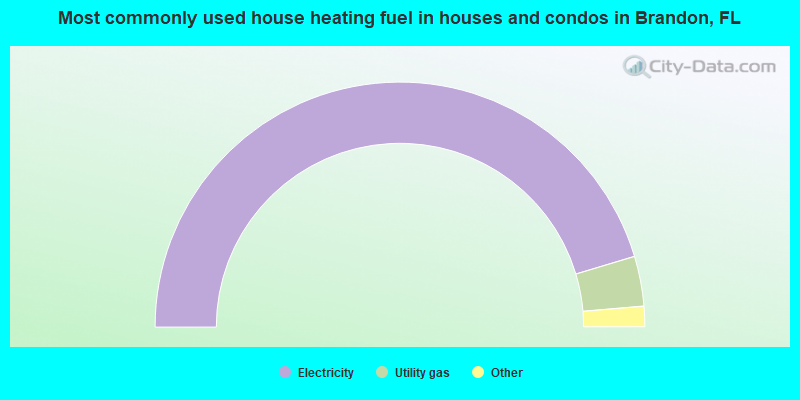
House heating fuel used in houses and condos - Utility gas (%)
House heating fuel used in houses and condos - Bottled, tank, or LP gas (%)
House heating fuel used in houses and condos - Electricity (%)
House heating fuel used in houses and condos - Fuel oil, kerosene, etc. (%)
House heating fuel used in houses and condos - Coal or coke (%)
House heating fuel used in houses and condos - Wood (%)
House heating fuel used in houses and condos - Solar energy (%)
House heating fuel used in houses and condos - Other fuel (%)
House heating fuel used in houses and condos - No fuel used (%)
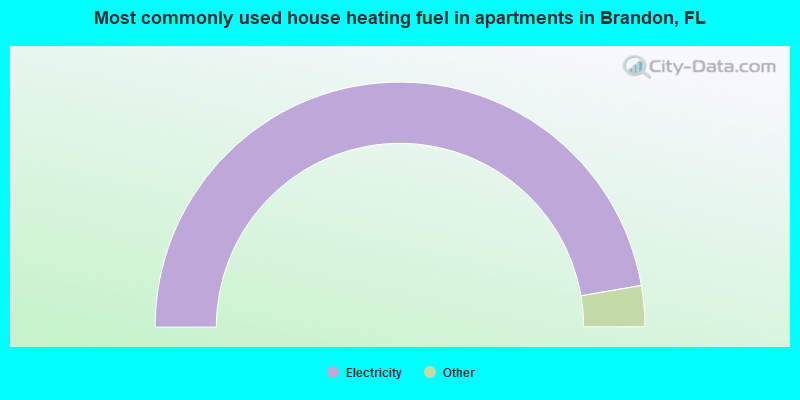
House heating fuel used in apartments - Utility gas (%)
House heating fuel used in apartments - Bottled, tank, or LP gas (%)
House heating fuel used in apartments - Electricity (%)
House heating fuel used in apartments - Fuel oil, kerosene, etc. (%)
House heating fuel used in apartments - Coal or coke (%)
House heating fuel used in apartments - Wood (%)
House heating fuel used in apartments - Solar energy (%)
House heating fuel used in apartments - Other fuel (%)
House heating fuel used in apartments - No fuel used (%)
Latest news about housing in Brandon, FL collected exclusively by city-data.com from local newspapers, TV, and radio stations
Median year house/condo built: 1987Median year apartment built: 1996Household type by relationship:
Households: 126,628
Male householders: 23,416 (5,683 living alone ), Female householders: 23,559 (6,375 living alone )21,227 spouses (20,880 opposite-sex spouses ), 3,053 unmarried partners , (2,866 opposite-sex unmarried partners ), 33,747 children (31,811 natural , 1,104 adopted , 832 stepchildren ), 5,408 grandchildren , 1,127 brothers or sisters , 3,598 parents , 158 foster children , 932 other relatives , 7,627 non-relatives In group quarters: 2,776
Size of family households: 11,268 2-persons , 10,587 3-persons , 4,719 4-persons , 2,077 5-persons , 1,778 6-persons , 756 7-or-more-persons .
Size of nonfamily households: 12,058 1-person , 2,492 2-persons , 916 3-persons , 46 4-persons , 278 7-or-more-persons .
12,117 married couples with children. single-parent households (1,813 men , 8,684 women ).
70.5% of residents of Brandon speak English at home. of residents speak Spanish at home (60% speak English very well , 15% speak English well , 16% speak English not well , 9% don't speak English at all ).of residents speak other Indo-European language at home (73% speak English very well , 15% speak English well , 11% speak English not well , 2% don't speak English at all ).of residents speak Asian or Pacific Island language at home (68% speak English very well , 24% speak English well , 5% speak English not well , 4% don't speak English at all ).of residents speak other language at home (87% speak English very well , 10% speak English well , 1% speak English not well , 2% don't speak English at all ).
Foreign born population: 27,104 (21.4%)of them are naturalized citizens )
Median number of rooms in houses and condos:
Median number of rooms in apartments
Owner-occupied Renter-occupied
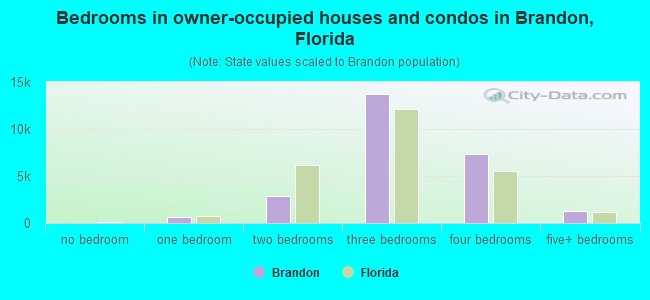
Bedrooms in owner-occupied houses and condos in Brandon, Florida
0 no bedroom 615 1 bedroom 2,825 2 bedrooms 13,758 3 bedrooms 7,328 4 bedrooms 1,301 5+ bedrooms
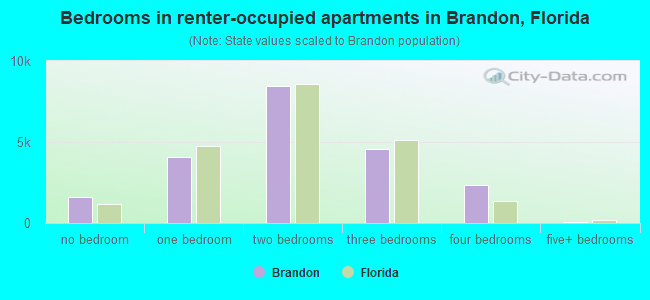
Bedrooms in renter-occupied apartments in Brandon, Florida
1,618 no bedroom 4,059 1 bedroom 8,482 2 bedrooms 4,566 3 bedrooms 2,372 4 bedrooms 51 5+ bedrooms
Owner-occupied Renter-occupied
Rooms in owner-occupied houses in Brandon, Florida
0 1 room 177 2 rooms 225 3 rooms 3,094 4 rooms 6,155 5 rooms 5,992 6 rooms 3,501 7 rooms 3,479 8 rooms 3,204 9+ rooms
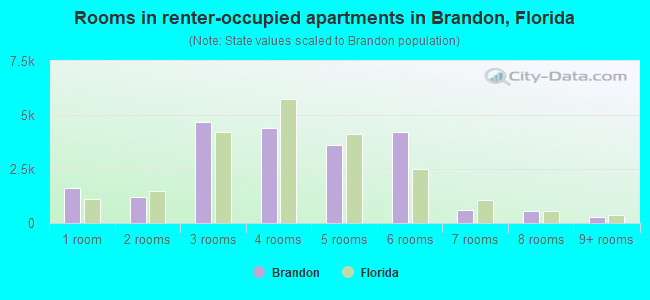
Rooms in renter-occupied apartments in Brandon, Florida
1,618 1 room 1,216 2 rooms 4,659 3 rooms 4,396 4 rooms 3,612 5 rooms 4,218 6 rooms 617 7 rooms 538 8 rooms 274 9+ rooms
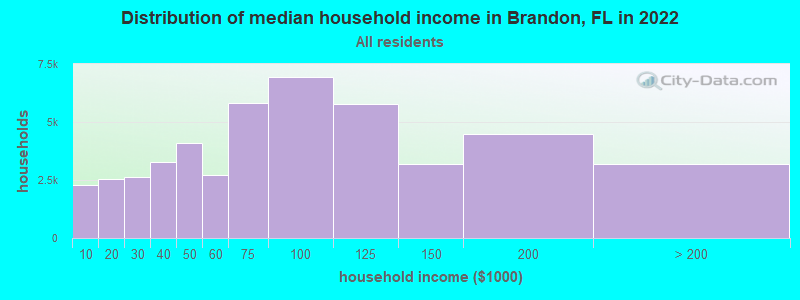
Brandon, FL household income distribution 2,287 Less than $10,0002,537 $10,000 to $19,9992,639 $20,000 to $29,9993,276 $30,000 to $39,9994,113 $40,000 to $49,9992,737 $50,000 to $59,9995,806 $60,000 to $74,9996,926 $75,000 to $99,9995,777 $100,000 to $124,9993,201 $125,000 to $149,9994,489 $150,000 to $199,9993,187 $200,000 or more
Home value of owner - occupied houses in 2022 in Brandon, FL 262 Less than $10,00019 $10,000 to $14,99910 $15,000 to $19,99935 $20,000 to $24,99962 $25,000 to $29,999123 $30,000 to $34,99932 $35,000 to $39,999122 $40,000 to $49,9994 $50,000 to $59,99925 $60,000 to $69,99941 $70,000 to $79,99941 $80,000 to $89,99924 $90,000 to $99,999314 $100,000 to $124,999534 $125,000 to $149,999921 $150,000 to $174,999998 $175,000 to $199,9993,749 $200,000 to $249,9994,165 $250,000 to $299,9996,131 $300,000 to $399,9992,270 $400,000 to $499,9992,178 $500,000 to $749,999644 $750,000 to $999,999111 $1,000,000 to $1,499,99946 $1,500,000 to $1,999,999112 $2,000,000 or moreRent paid by renters in 2022 in Brandon, FL 9 Less than $10044 $100 to $14977 $150 to $1995 $250 to $29919 $300 to $34959 $350 to $399130 $450 to $49959 $500 to $54923 $550 to $599254 $600 to $64943 $650 to $699211 $700 to $749223 $750 to $799385 $800 to $899670 $900 to $9993,226 $1,000 to $1,2494,669 $1,250 to $1,4998,328 $1,500 to $1,9991,775 $2,000 to $2,499390 $2,500 to $2,999102 $3,000 to $3,499308 No cash rent
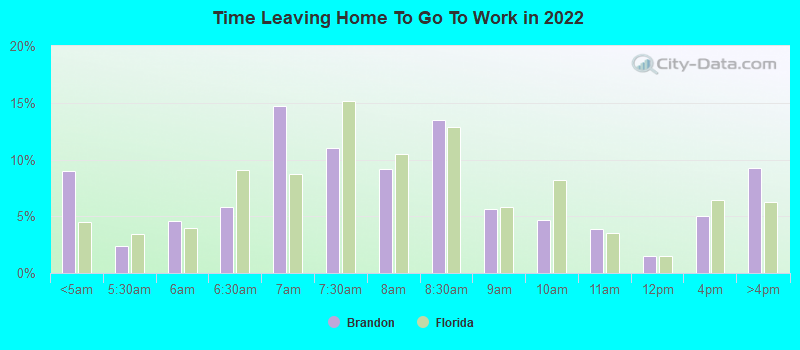
Percentage of workers working in this county: 89.0%Number of people working at home: 11,881 (19.2% of all workers )
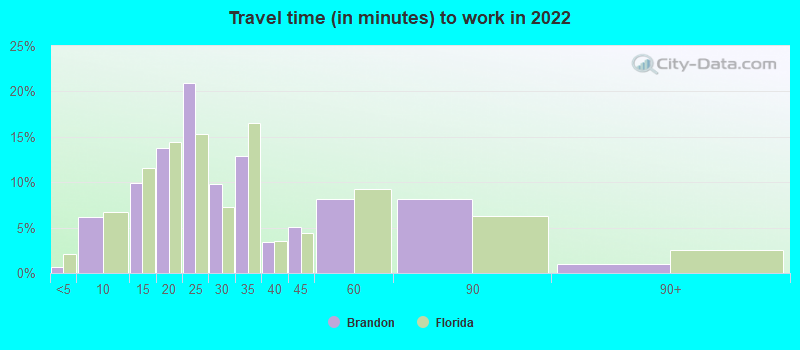
Travel time to work (commute)
Less than 5 minutes: 8275 to 9 minutes: 2,69910 to 14 minutes: 3,68815 to 19 minutes: 8,46220 to 24 minutes: 10,54925 to 29 minutes: 3,96130 to 34 minutes: 8,62535 to 39 minutes: 1,62040 to 44 minutes: 2,22845 to 59 minutes: 6,99360 to 89 minutes: 2,99890 or more minutes: 1,520
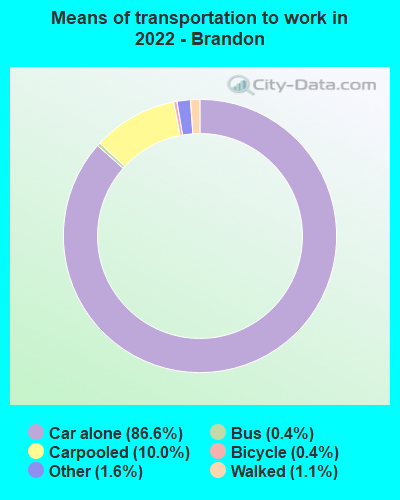
Means of transportation to work:
Drove a car alone: 40,937 (68.4%)Carpooled: 5,399 (9.0%)Bus : 121 (0.2%)Taxi: 884 (1.5%)Bicycle: 205 (0.3%)Walked: 467 (0.8%)Worked at home: 11,881 (19.9%)
Unemployment by race in 2022
Unemployment rate for White non-Hispanic residents 2.1% Males1.8% FemalesUnemployment rate for Black residents 4.9% Males4.7% FemalesUnemployment rate for American Indian and Alaska Native residents 11.5% Males11.1% FemalesUnemployment rate for Asian residents 0.8% Males5.0% FemalesUnemployment rate for other race residents 1.2% Males7.2% FemalesUnemployment rate for two or more race residents 3.8% Males7.5% FemalesUnemployment rate for Hispanic or Latino residents 2.4% Males6.9% Females
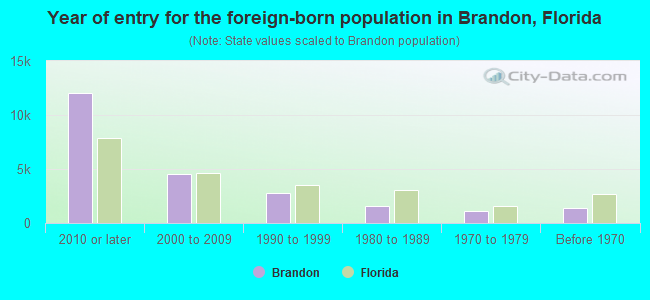
Year of entry for the foreign-born population in Brandon, Florida
12,072 2010 or later 4,491 2000 to 2009 2,813 1990 to 1999 1,594 1980 to 1989 1,071 1970 to 1979 1,359 Before 1970
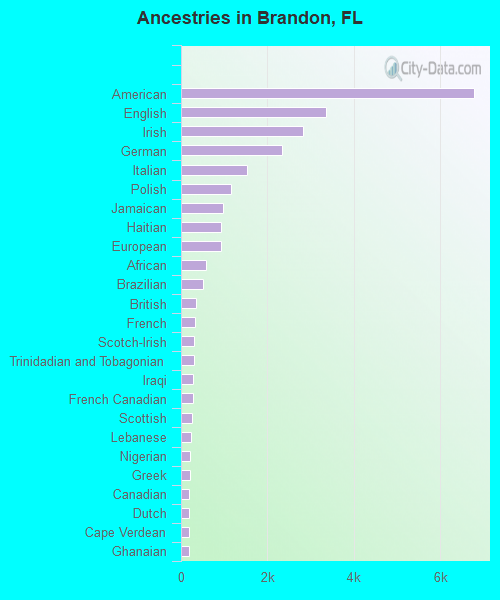
First ancestries reported:
American: 6,787 (10.3%)
English: 3,349 (5.1%)
Irish: 2,820 (4.3%)
German: 2,331 (3.5%)
Italian: 1,529 (2.3%)
Polish: 1,164 (1.8%)
Jamaican: 978 (1.5%)
Haitian: 935 (1.4%)
European: 914 (1.4%)
African: 585 (0.9%)
Brazilian: 513 (0.8%)
British: 345 (0.5%)
French: 329 (0.5%)
Scotch-Irish: 301 (0.5%)
Trinidadian and Tobagonian: 297 (0.5%)
Iraqi: 277 (0.4%)
French Canadian: 267 (0.4%)
Scottish: 257 (0.4%)
Lebanese: 236 (0.4%)
Nigerian: 212 (0.3%)
Greek: 210 (0.3%)
Canadian: 187 (0.3%)
Dutch: 182 (0.3%)
Cape Verdean: 180 (0.3%)
Ghanaian: 178 (0.3%)
Dutch West Indian: 172 (0.3%)
Moroccan: 169 (0.3%)
Norwegian: 166 (0.3%)
Slovak: 165 (0.3%)
Russian: 146 (0.2%)
Portuguese: 115 (0.2%)
Welsh: 114 (0.2%)
Turkish: 113 (0.2%)
Hungarian: 106 (0.2%)
Guyanese: 97 (0.1%)
Eastern European: 83 (0.1%)
Zimbabwean: 72 (0.1%)
Latvian: 70 (0.1%)
West Indian: 68 (0.1%)
Bulgarian: 67 (0.1%)
Swedish: 65 (0.10%)
Ethiopian: 64 (0.10%)
Ukrainian: 62 (0.09%)
Danish: 62 (0.09%)
Serbian: 61 (0.09%)
Egyptian: 59 (0.09%)
Scandinavian: 54 (0.08%)
Romanian: 49 (0.07%)
Armenian: 44 (0.07%)
Arab: 44 (0.07%)
Iranian: 43 (0.07%)
Czechoslovakian: 36 (0.05%)
Slavic: 34 (0.05%)
Croatian: 32 (0.05%)
Yugoslavian: 32 (0.05%)
Swiss: 30 (0.05%)
Czech: 29 (0.04%)
Bahamian: 28 (0.04%)
Palestinian: 27 (0.04%)
Liberian: 25 (0.04%)
Pennsylvania German: 23 (0.03%)
Austrian: 23 (0.03%)
Lithuanian: 22 (0.03%)
Estonian: 19 (0.03%)
Celtic: 18 (0.03%)
Northern European: 13 (0.02%)
Finnish: 11 (0.02%)
Belizean: 11 (0.02%)
U.S. Virgin Islander: 9 (0.01%)
Jordanian: 6 (0.01%)
Israeli: 6 (0.01%)
Slovene: 5 (0.01%)
Albanian: 4 (0.01%)
Most common places of birth for foreign-born residents (%): Cuba Brandon:
18.7% (4,200)Florida:
22.0% (1,006,576)
India Brandon:
9.1% (2,045)Florida:
2.1% (94,349)
Venezuela Brandon:
7.6% (1,701)Florida:
5.7% (262,042)
Dominican Republic Brandon:
5.7% (1,274)Florida:
3.0% (137,727)
Philippines Brandon:
4.6% (1,021)Florida:
1.8% (84,403)
Mexico Brandon:
4.0% (899)Florida:
5.6% (257,152)
Haiti Brandon:
4.0% (886)Florida:
7.5% (342,375)
Brazil Brandon:
3.3% (730)Florida:
2.7% (122,906)
Colombia Brandon:
3.1% (700)Florida:
6.5% (298,669)
Jamaica Brandon:
3.1% (699)Florida:
5.0% (227,319)
Peru Brandon:
2.8% (632)Florida:
2.1% (96,693)
Honduras Brandon:
2.1% (468)Florida:
2.3% (107,160)
Guyana Brandon:
2.0% (457)Florida:
0.7% (33,556)
Canada Brandon:
1.9% (415)Florida:
2.4% (109,132)
Germany Brandon:
1.8% (393)Florida:
1.2% (54,272)
Vietnam Brandon:
1.7% (380)Florida:
1.3% (60,604)
Place of birth for U.S.-born residents:
This state: 39,435Other state: 51,927Northeast: 21,731Midwest: 11,918South: 12,641West: 5,637 85.8% of Brandon residents lived in the same house 1 years ago.
Out of people who lived in different houses, 39.4% lived in this county.
Out of people who lived in different counties, 42.9% lived in Florida.
Brandon:
85.8%State average:
86.3%
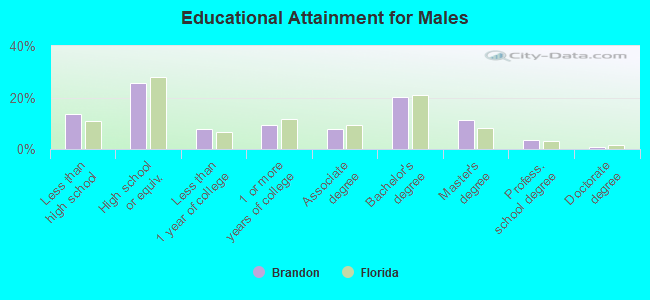
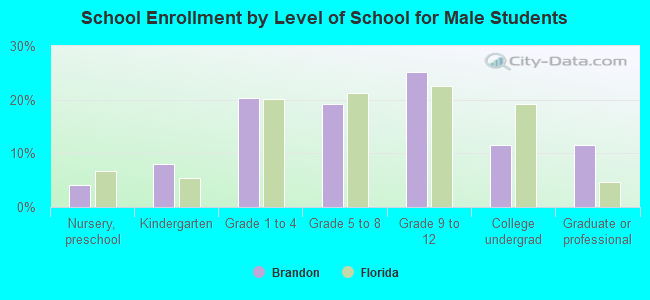
Education attainment for males 25 years and older:
No schooling: 960Nursery to 4th grade: 155th and 6th grade: 1957th and 8th grade: 4559th grade: 1,49410th grade: 59311th grade: 71212th grade, no diploma: 1,431High school graduate (or equivalency): 10,958Less than 1 year of college: 3,346Some college more than 1 year, no degree: 3,961Associate degree: 3,398Bachelor's degree: 8,698Master's degree: 4,845Professional school degree: 1,542Doctorate degree: 343
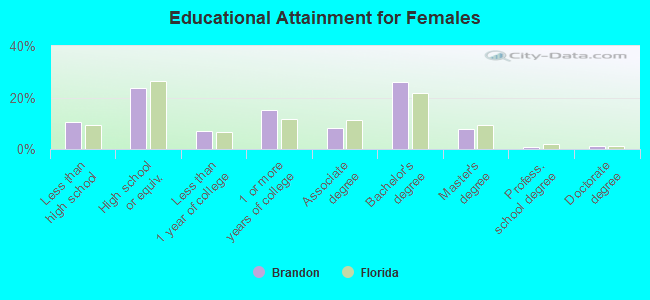
Education attainment for females 25 years and older:
No schooling: 1,849Nursery to 4th grade: 05th and 6th grade: 2117th and 8th grade: 3289th grade: 4810th grade: 86011th grade: 50512th grade, no diploma: 909High school graduate (or equivalency): 10,791Less than 1 year of college: 3,217Some college more than 1 year, no degree: 6,927Associate degree: 3,628Bachelor's degree: 11,808Master's degree: 3,543Professional school degree: 414Doctorate degree: 505
Housing units in structures:
One, detached: 27,079One, attached: 3,583Two: 2193 or 4: 1,5445 to 9: 3,81510 to 19: 7,60520 to 49: 2,47950 or more: 2,522Mobile homes: 207Boats, RVs, vans, etc.: 523Housing units lacking complete plumbing facilities in 2022: 0.6%Housing units lacking complete kitchen facilities in 2022: 1.0%House/condo owner moved in on average 11 years ago
Renter moved in on average 1 years ago
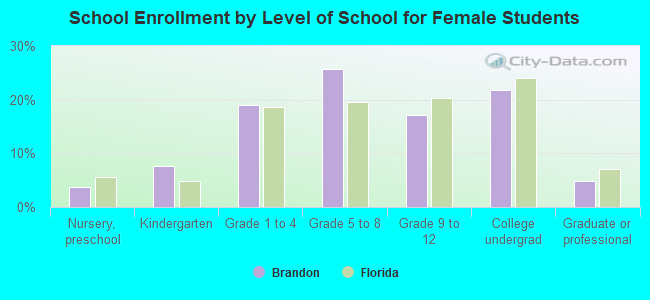
Private vs. public school enrollment:
Students in private schools in grades 1 to 8 (elementary and middle school): 2,237 Students in private schools in grades 9 to 12 (high school): 186 Students in private undergraduate colleges: 661