Bridgeview, IL (Illinois) Houses and Residents
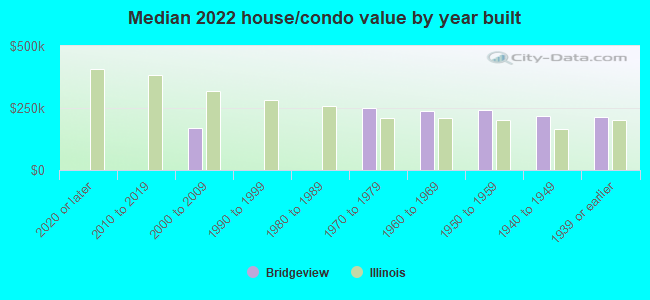
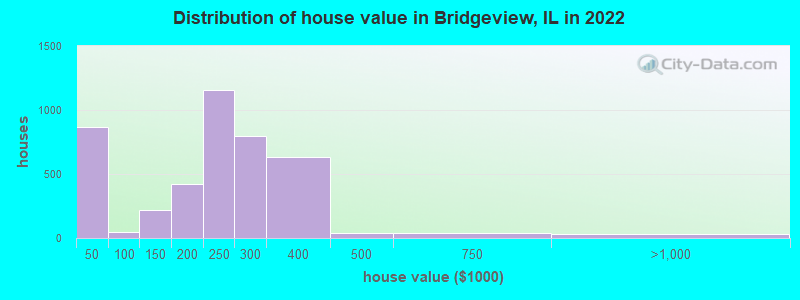
Estimated median house or condo value in 2022: $229,257 (it was $131,500 in 2000 )
Bridgeview:
$229,257Illinois:
$251,600
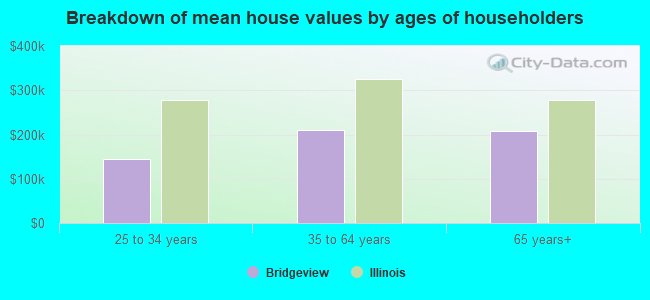
Lower value quartile - upper value quartile: $153,311 - $275,750Mean price in 2022: Detached houses: $295,743 Here:
$295,743State:
$310,164
Townhouses or other attached units: $256,673 Here:
$256,673State:
$286,230
In 3-to-4-unit structures: $420,315 Here:
$420,315State:
$330,907
In 5-or-more-unit structures: $150,327 Here:
$150,327State:
$318,887
Mobile homes: $44,621 Here:
$44,621State:
$78,855
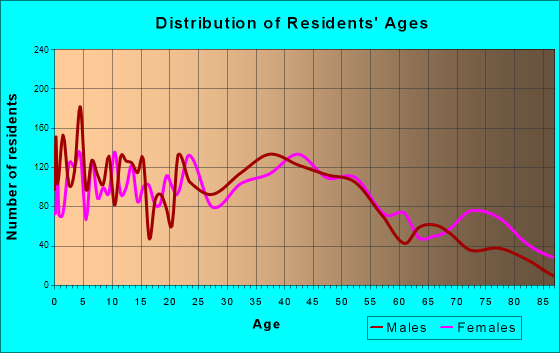
Total population: 16,491 (Urban population: 15,368, Rural population: 0)
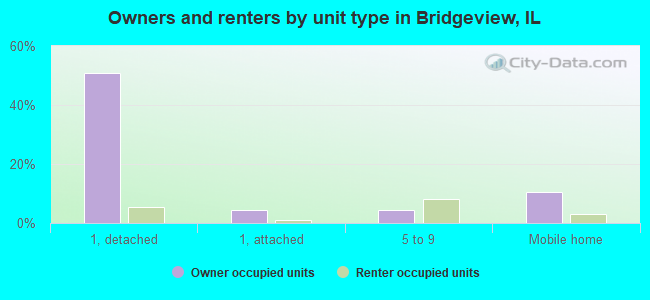
Houses: 6,688 (6,144 occupied: 4,163 owner occupied, 2,085 renter occupied )
% of renters here:
33%State:
33%
Housing density: 1,621 houses/condos per square mile
Median price asked for vacant for-sale houses and condos in 2022: $163,433.
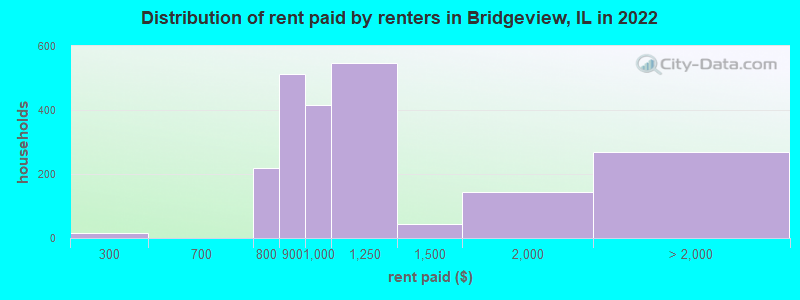
Median contract rent in 2022: $950 (lower quartile is $845, upper quartile is $1,130)
Median rent asked for vacant for-rent units in 2022: $1,401
Median gross rent in Bridgeview, IL in 2022: $1,053
Housing units in Bridgeview with a mortgage: 2,117 (163 second mortgage, 10 home equity loan, 132 both second mortgage and home equity loan )Houses without a mortgage: 7
Median household income for houses/condos with a mortgage: $80,836
Median household income for apartments without a mortgage: $65,547
Median monthly housing costs: $1,093
Data:
Median house or condo value ($)
Median house or condo value ($ change since 2000)
Median house or condo value ($) - White
Median house or condo value ($) - Black or African American
Median house or condo value ($) - Asian
Median house or condo value ($) - Hispanic or Latino
Median house or condo value ($) - American Indian and Alaska Native
Median house or condo value ($) - Multirace
Median house or condo value ($) - Other Race
Median price asked for mobile homes ($)
Household density (households per square mile)
Mean house or condo value by units in structure - 1, detached ($)
Mean house or condo value by units in structure - 1, attached ($)
Mean house or condo value by units in structure - 2 ($)
Mean house or condo value by units in structure by units in structure - 3 or 4 ($)
Mean house or condo value by units in structure - 5 or more ($)
Mean house or condo value by units in structure - Boat, RV, van, etc. ($)
Mean house or condo value by units in structure - Mobile home ($)
Median contract rent ($)
Median contract rent - Lower quartile ($)
Median contract rent - Upper quartile ($)
Median gross rent ($)
Urban houses (%)
Rural houses (%)
Houses occupied (%)
Houses occupied (% change since 2000)
Houses owner occupied (%)
Houses owner occupied (% change since 2000)
Houses renter occupied (%)
Houses renter occupied (% change since 2000)
Vacant housing units - For rent (%)
Vacant housing units - For rent (% change since 2000)
Vacant housing units - For sale only (%)
Vacant housing units - For sale only (% change since 2000)
Vacant housing units - Rented or sold, not occupied (%)
Vacant housing units - Rented or sold, not occupied (% change since 2000)
Vacant housing units - For seasonal, recreational, or occasional use (%)
Vacant housing units - For seasonal, recreational, or occasional use (% change since 2000)
Vacant housing units - For migrant workers (%)
Vacant housing units - For migrant workers (% change since 2000)
Vacant housing units - Other vacant (%)
Vacant housing units - Other vacant (% change since 2000)
Median monthly housing costs ($)
Median household income for houses/condos with a mortgage ($)
Median household income for houses/condos without a mortgage ($)
Median household income ($)
Median household income ($) - White
Median household income ($) - Black or African American
Median household income ($) - Asian
Median household income ($) - Hispanic or Latino
Median household income ($) - American Indian and Alaska Native
Median household income ($) - Multirace
Median household income ($) - Other Race
Mortgage status - with mortgage (%)
Mortgage status - with second mortgage (%)
Mortgage status - with home equity loan (%)
Mortgage status - with both second mortgage and home equity loan (%)
Mortgage status - without a mortgage (%)
Median year house/condo built
Median year apartment built
Household type by relationship - Male householder living alone (%)
Household type by relationship - Male householder not living alone (%)
Household type by relationship - Female householder living alone (%)
Household type by relationship - Female householder not living alone (%)
Household type by relationship - Opposite-Sex spouse (%)
Household type by relationship - Same-Sex spouse (%)
Household type by relationship - Opposite-Sex unmarried partner (%)
Household type by relationship - Same-Sex unmarried partner (%)
Household type by relationship - In group quarters (%)
Size of family households - 2-person household (%)
Size of family households - 3-person household (%)
Size of family households - 4-person household (%)
Size of family households - 5-person household (%)
Size of family households - 6-person household (%)
Size of family households - 7-or-more-person household (%)
Size of nonfamily households - 1-person household (%)
Size of nonfamily households - 2-person household (%)
Size of nonfamily households - 3-person household (%)
Size of nonfamily households - 4-person household (%)
Size of nonfamily households - 5-person household (%)
Size of nonfamily households - 6-person household (%)
Size of nonfamily households - 7-or-moreperson household (%)
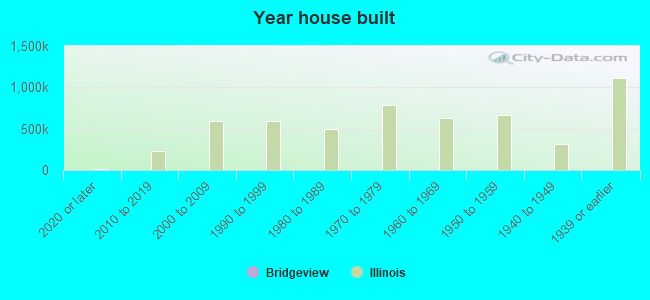
Year house built - Built 2010 or later (%)
Year house built - Built 2000 to 2009 (%)
Year house built - Built 1990 to 1999 (%)
Year house built - Built 1980 to 1989 (%)
Year house built - Built 1970 to 1979 (%)
Year house built - Built 1960 to 1969 (%)
Year house built - Built 1950 to 1959 (%)
Year house built - Built 1940 to 1949 (%)
Year house built - Built 1939 or earlier (%)
Median number of rooms in houses and condos
Median number of rooms in apartments
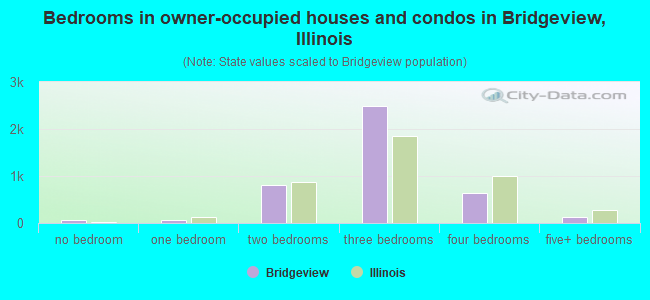
Median number of bedrooms in owner occupied houses
Mean number of bedrooms in owner occupied houses
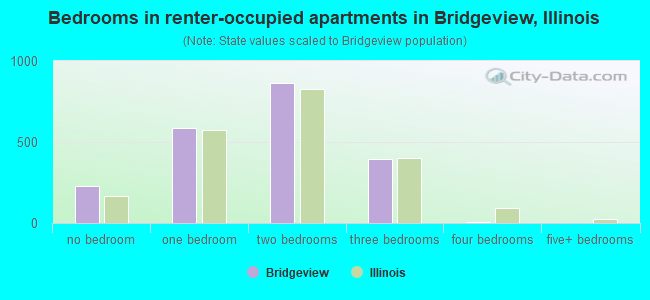
Median number of bedrooms in renter occupied houses
Mean number of bedrooms in renter occupied houses
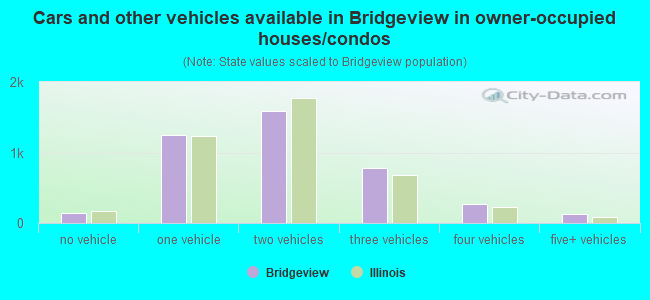
Median number of vehichles in owner occupied houses
Mean number of vehichles in owner occupied houses
Median number of vehichles in renter occupied houses
Mean number of vehichles in renter occupied houses
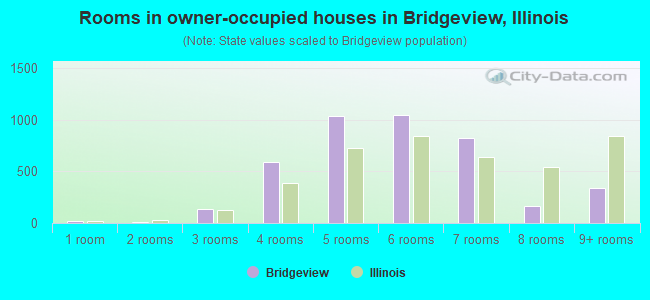
Rooms in owner-occupied houses - 1 room (%)
Rooms in owner-occupied houses - 2 rooms (%)
Rooms in owner-occupied houses - 3 rooms (%)
Rooms in owner-occupied houses - 4 rooms (%)
Rooms in owner-occupied houses - 5 rooms (%)
Rooms in owner-occupied houses - 6 rooms (%)
Rooms in owner-occupied houses - 7 rooms (%)
Rooms in owner-occupied houses - 8 rooms (%)
Rooms in owner-occupied houses - 9+ rooms (%)
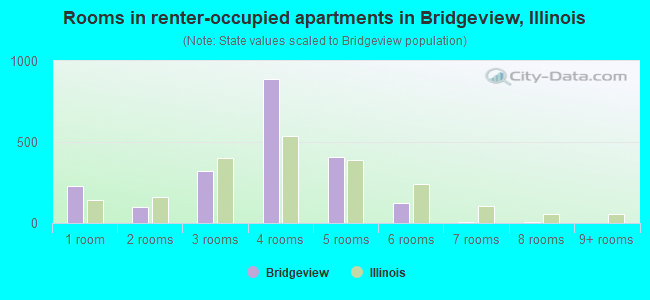
Rooms in renter-occupied houses - 1 room (%)
Rooms in renter-occupied houses - 2 rooms (%)
Rooms in renter-occupied houses - 3 rooms (%)
Rooms in renter-occupied houses - 4 rooms (%)
Rooms in renter-occupied houses - 5 rooms (%)
Rooms in renter-occupied houses - 6 rooms (%)
Rooms in renter-occupied houses - 7 rooms (%)
Rooms in renter-occupied houses - 8 rooms (%)
Rooms in renter-occupied houses - 9+ rooms (%)
Bedrooms in owner-occupied houses - no bedrooms (%)
Bedrooms in owner-occupied houses - 1 bedroom (%)
Bedrooms in owner-occupied houses - 2 bedrooms (%)
Bedrooms in owner-occupied houses - 3 bedrooms (%)
Bedrooms in owner-occupied houses - 4 bedrooms (%)
Bedrooms in owner-occupied houses - 5+ bedrooms (%)
Bedrooms in renter-occupied houses - no bedrooms (%)
Bedrooms in renter-occupied houses - 1 bedroom (%)
Bedrooms in renter-occupied houses - 2 bedrooms (%)
Bedrooms in renter-occupied houses - 3 bedrooms (%)
Bedrooms in renter-occupied houses - 4 bedrooms (%)
Bedrooms in renter-occupied houses - 5+ bedrooms (%)
Vehicles available in owner-occupied houses - no vehicle available (%)
Vehicles available in owner-occupied houses - 1 vehicle available(%)
Vehicles available in owner-occupied houses - 2 Vehicles available (%)
Vehicles available in owner-occupied houses - 3 Vehicles available (%)
Vehicles available in owner-occupied houses - 4 Vehicles available (%)
Vehicles available in owner-occupied houses - 5+ Vehicles available (%)
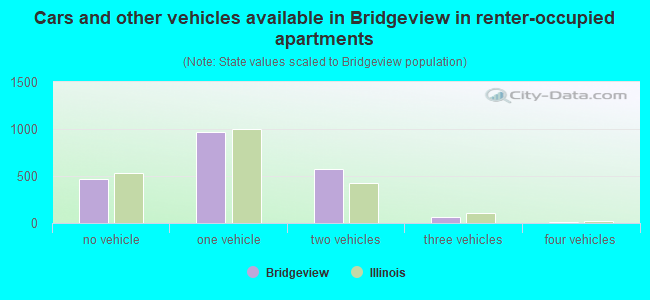
Vehicles available in renter-occupied houses - no vehicle available (%)
Vehicles available in renter-occupied houses - 1 vehicle available (%)
Vehicles available in renter-occupied houses - 2 Vehicles available (%)
Vehicles available in renter-occupied houses - 3 Vehicles available (%)
Vehicles available in renter-occupied houses - 4 Vehicles available (%)
Vehicles available in renter-occupied houses - 5+ Vehicles available (%)
Housing units in structures - 1, detached (%)
Housing units in structures - 1, attached (%)
Housing units in structures - 2 (%)
Housing units in structures - 3 or 4 (%)
Housing units in structures - 5 to 9 (%)
Housing units in structures - 10 to 19 (%)
Housing units in structures - 20 to 49 (%)
Housing units in structures - 50 or more (%)
Housing units in structures - Mobile home (%)
Housing units in structures - Boat, RV, van, etc. (%)
Housing units in structures - Owners - 1, detached (%)
Housing units in structures - Owners - 1, attached (%)
Housing units in structures - Owners - 2 (%)
Housing units in structures - Owners - 3 or 4 (%)
Housing units in structures - Owners - 5 to 9 (%)
Housing units in structures - Owners - 10 to 19 (%)
Housing units in structures - Owners - 20 to 49 (%)
Housing units in structures - Owners - 50 or more (%)
Housing units in structures - Owners - Mobile home (%)
Housing units in structures - Owners - Boat, RV, van, etc. (%)
Housing units in structures - Renters - 1, detached (%)
Housing units in structures - Renters - 1, attached (%)
Housing units in structures - Renters - 2 (%)
Housing units in structures - Renters - 3 or 4 (%)
Housing units in structures - Renters - 5 to 9 (%)
Housing units in structures - Renters - 10 to 19 (%)
Housing units in structures - Renters - 20 to 49 (%)
Housing units in structures - Renters - 50 or more (%)
Housing units in structures - Renters - Mobile home (%)
Housing units in structures - Renters - Boat, RV, van, etc. (%)
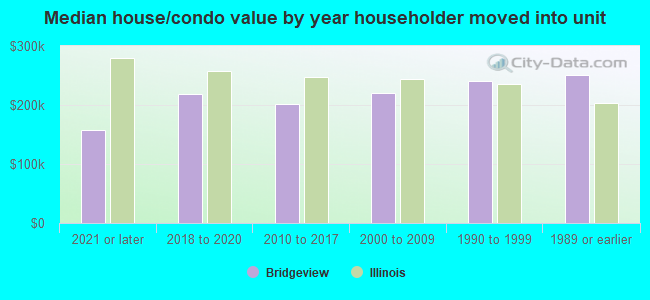
House/condo owner moved in on average (years ago)
Renter moved in on average (years ago)
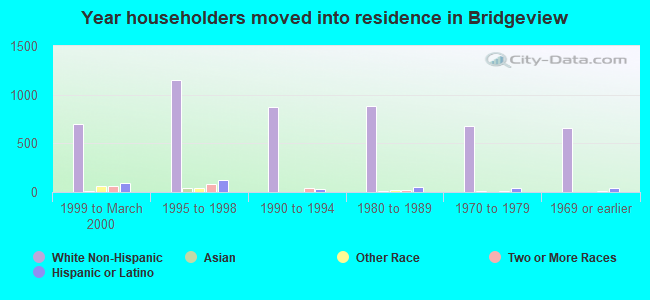
Year householder moved into unit - Moved in 1999 to March 2000 (%)
Year householder moved into unit - Moved in 1999 to March 2000 (%) - White
Year householder moved into unit - Moved in 1999 to March 2000 (%) - Black or African American
Year householder moved into unit - Moved in 1999 to March 2000 (%) - Asian
Year householder moved into unit - Moved in 1999 to March 2000 (%) - Hispanic or Latino
Year householder moved into unit - Moved in 1999 to March 2000 (%) - American Indian and Alaska Native
Year householder moved into unit - Moved in 1999 to March 2000 (%) - Multirace
Year householder moved into unit - Moved in 1999 to March 2000 (%) - Other Race
Year householder moved into unit - Moved in 1995 to 1998 (%)
Year householder moved into unit - Moved in 1995 to 1998 (%) - White
Year householder moved into unit - Moved in 1995 to 1998 (%) - Black or African American
Year householder moved into unit - Moved in 1995 to 1998 (%) - Asian
Year householder moved into unit - Moved in 1995 to 1998 (%) - Hispanic or Latino
Year householder moved into unit - Moved in 1995 to 1998 (%) - American Indian and Alaska Native
Year householder moved into unit - Moved in 1995 to 1998 (%) - Multirace
Year householder moved into unit - Moved in 1995 to 1998 (%) - Other Race
Year householder moved into unit - Moved in 1990 to 1994 (%)
Year householder moved into unit - Moved in 1990 to 1994 (%) - White
Year householder moved into unit - Moved in 1990 to 1994 (%) - Black or African American
Year householder moved into unit - Moved in 1990 to 1994 (%) - Asian
Year householder moved into unit - Moved in 1990 to 1994 (%) - Hispanic or Latino
Year householder moved into unit - Moved in 1990 to 1994 (%) - American Indian and Alaska Native
Year householder moved into unit - Moved in 1990 to 1994 (%) - Multirace
Year householder moved into unit - Moved in 1990 to 1994 (%) - Other Race
Year householder moved into unit - Moved in 1980 to 1989 (%)
Year householder moved into unit - Moved in 1980 to 1989 (%) - White
Year householder moved into unit - Moved in 1980 to 1989 (%) - Black or African American
Year householder moved into unit - Moved in 1980 to 1989 (%) - Asian
Year householder moved into unit - Moved in 1980 to 1989 (%) - Hispanic or Latino
Year householder moved into unit - Moved in 1980 to 1989 (%) - American Indian and Alaska Native
Year householder moved into unit - Moved in 1980 to 1989 (%) - Multirace
Year householder moved into unit - Moved in 1980 to 1989 (%) - Other Race
Year householder moved into unit - Moved in 1970 to 1979 (%)
Year householder moved into unit - Moved in 1970 to 1979 (%) - White
Year householder moved into unit - Moved in 1970 to 1979 (%) - Black or African American
Year householder moved into unit - Moved in 1970 to 1979 (%) - Asian
Year householder moved into unit - Moved in 1970 to 1979 (%) - Hispanic or Latino
Year householder moved into unit - Moved in 1970 to 1979 (%) - American Indian and Alaska Native
Year householder moved into unit - Moved in 1970 to 1979 (%) - Multirace
Year householder moved into unit - Moved in 1970 to 1979 (%) - Other Race
Year householder moved into unit - Moved in 1969 or earlier (%)
Year householder moved into unit - Moved in 1969 or earlier (%) - White
Year householder moved into unit - Moved in 1969 or earlier (%) - Black or African American
Year householder moved into unit - Moved in 1969 or earlier (%) - Asian
Year householder moved into unit - Moved in 1969 or earlier (%) - Hispanic or Latino
Year householder moved into unit - Moved in 1969 or earlier (%) - American Indian and Alaska Native
Year householder moved into unit - Moved in 1969 or earlier (%) - Multirace
Year householder moved into unit - Moved in 1969 or earlier (%) - Other Race
Housing units lacking complete plumbing facilities (%)
Housing units lacking complete kitchen facilities (%)
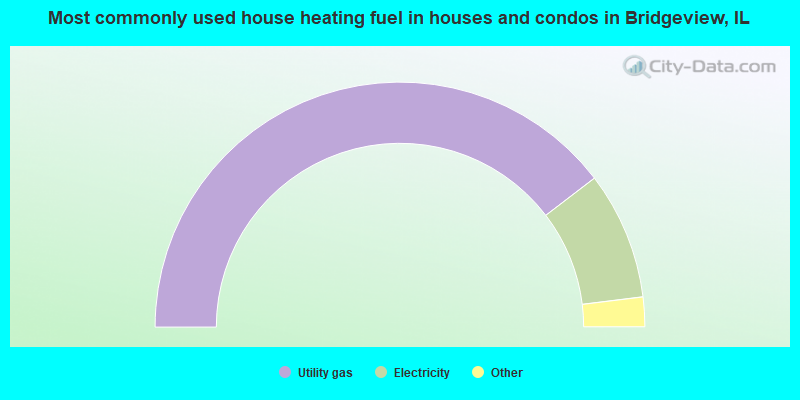
House heating fuel used in houses and condos - Utility gas (%)
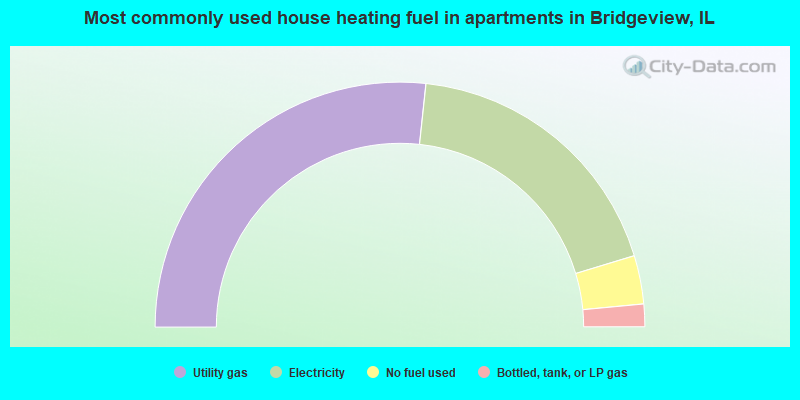
House heating fuel used in houses and condos - Bottled, tank, or LP gas (%)
House heating fuel used in houses and condos - Electricity (%)
House heating fuel used in houses and condos - Fuel oil, kerosene, etc. (%)
House heating fuel used in houses and condos - Coal or coke (%)
House heating fuel used in houses and condos - Wood (%)
House heating fuel used in houses and condos - Solar energy (%)
House heating fuel used in houses and condos - Other fuel (%)
House heating fuel used in houses and condos - No fuel used (%)
House heating fuel used in apartments - Utility gas (%)
House heating fuel used in apartments - Bottled, tank, or LP gas (%)
House heating fuel used in apartments - Electricity (%)
House heating fuel used in apartments - Fuel oil, kerosene, etc. (%)
House heating fuel used in apartments - Coal or coke (%)
House heating fuel used in apartments - Wood (%)
House heating fuel used in apartments - Solar energy (%)
House heating fuel used in apartments - Other fuel (%)
House heating fuel used in apartments - No fuel used (%)
Latest news about housing in Bridgeview, IL collected exclusively by city-data.com from local newspapers, TV, and radio stations
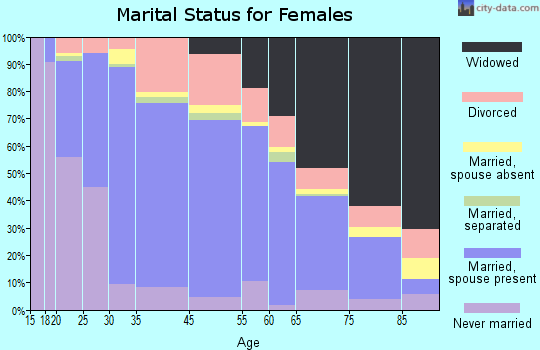
Median year house/condo built: 1967Median year apartment built: 1993Household type by relationship:
Households: 16,562
Male householders: 2,766 (708 living alone ), Female householders: 3,215 (1,087 living alone )2,462 spouses (2,462 opposite-sex spouses ), 377 unmarried partners , (364 opposite-sex unmarried partners ), 5,621 children (5,206 natural , 379 adopted , 35 stepchildren ), 440 grandchildren , 130 brothers or sisters , 333 parents , 200 foster children , 199 other relatives , 270 non-relatives In group quarters: 544
Size of family households: 1,625 2-persons , 1,000 3-persons , 570 4-persons , 469 5-persons , 235 6-persons , 89 7-or-more-persons .
Size of nonfamily households: 1,929 1-person , 274 2-persons , 10 3-persons .
1,580 married couples with children. single-parent households (255 men , 1,061 women ).
54.5% of residents of Bridgeview speak English at home. of residents speak Spanish at home (67% speak English very well , 21% speak English well , 9% speak English not well , 3% don't speak English at all ).of residents speak other Indo-European language at home (38% speak English very well , 18% speak English well , 36% speak English not well , 8% don't speak English at all ).of residents speak Asian or Pacific Island language at home (43% speak English very well , 49% speak English well , 8% speak English not well ).of residents speak other language at home (62% speak English very well , 21% speak English well , 17% speak English not well ).
Foreign born population: 3,984 (24.1%)of them are naturalized citizens )
Median number of rooms in houses and condos:
Median number of rooms in apartments
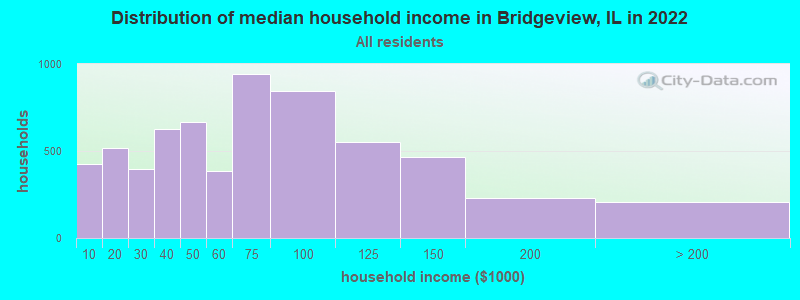
Bridgeview, IL household income distribution 428 Less than $10,000515 $10,000 to $19,999398 $20,000 to $29,999627 $30,000 to $39,999667 $40,000 to $49,999385 $50,000 to $59,999945 $60,000 to $74,999844 $75,000 to $99,999550 $100,000 to $124,999465 $125,000 to $149,999231 $150,000 to $199,999206 $200,000 or more
Home value of owner - occupied houses in 2022 in Bridgeview, IL 327 Less than $10,000104 $10,000 to $14,99945 $15,000 to $19,999196 $20,000 to $24,99970 $25,000 to $29,999115 $30,000 to $34,99911 $35,000 to $39,99927 $50,000 to $59,99918 $80,000 to $89,999112 $100,000 to $124,999104 $125,000 to $149,999254 $150,000 to $174,999166 $175,000 to $199,9991,154 $200,000 to $249,999799 $250,000 to $299,999631 $300,000 to $399,99935 $400,000 to $499,99936 $500,000 to $749,99917 $750,000 to $999,99911 $2,000,000 or moreRent paid by renters in 2022 in Bridgeview, IL 3 Less than $10016 $200 to $24962 $700 to $749155 $750 to $799511 $800 to $899414 $900 to $999546 $1,000 to $1,24944 $1,250 to $1,499143 $1,500 to $1,99925 $2,000 to $2,499242 No cash rent
Percentage of workers working in this county: 82.5%Number of people working at home: 731 (9.9% of all workers )
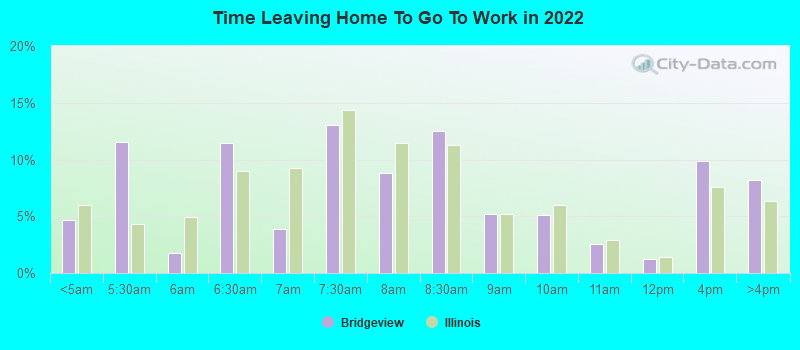
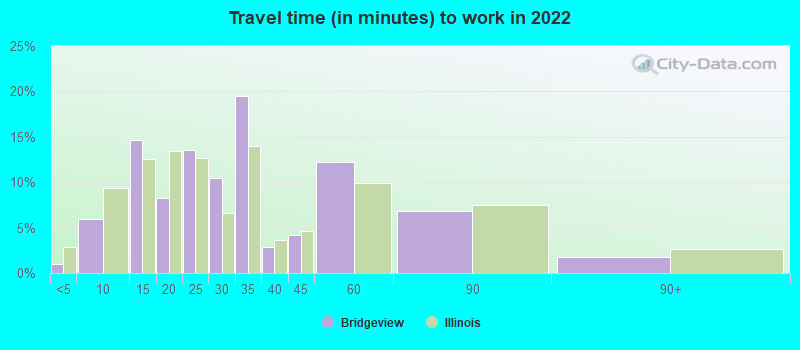
Travel time to work (commute)
Less than 5 minutes: 1275 to 9 minutes: 39010 to 14 minutes: 78715 to 19 minutes: 94420 to 24 minutes: 49025 to 29 minutes: 30130 to 34 minutes: 1,07535 to 39 minutes: 17440 to 44 minutes: 39245 to 59 minutes: 1,16060 to 89 minutes: 47390 or more minutes: 156
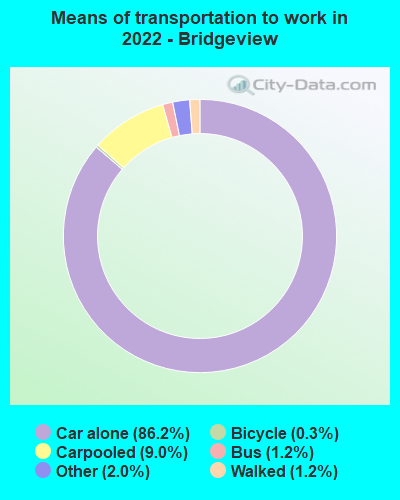
Means of transportation to work:
Drove a car alone: 8,452 (79.2%)Carpooled: 943 (8.8%)Bus : 106 (1.0%)Subway or elevated rail : 5 (0.0%)Taxi: 201 (1.9%)Bicycle: 29 (0.3%)Walked: 123 (1.2%)Worked at home: 731 (6.9%)
Unemployment by race in 2022
Unemployment rate for White non-Hispanic residents 8.1% Males4.0% FemalesUnemployment rate for Black residents 5.5% MalesUnemployment rate for other race residents 7.4% FemalesUnemployment rate for two or more race residents 5.0% Males2.5% FemalesUnemployment rate for Hispanic or Latino residents 7.4% Males9.5% Females
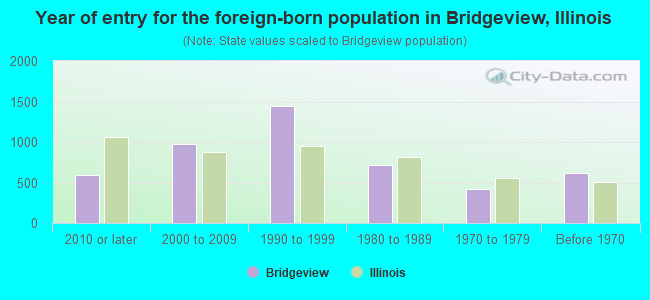
Year of entry for the foreign-born population in Bridgeview, Illinois
587 2010 or later 971 2000 to 2009 1,443 1990 to 1999 717 1980 to 1989 418 1970 to 1979 615 Before 1970
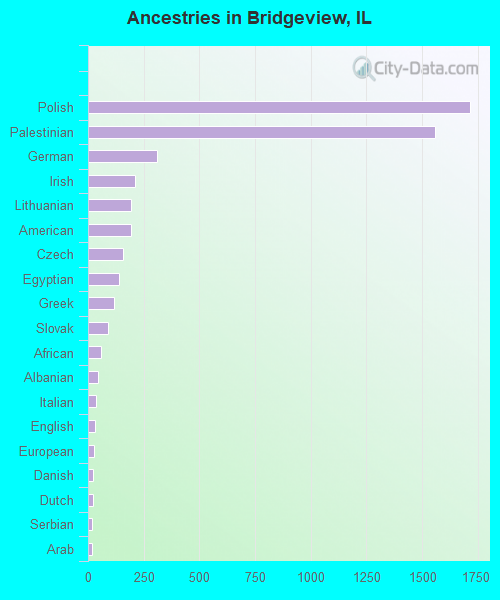
First ancestries reported:
Polish: 1,715 (19.2%)
Palestinian: 1,559 (17.5%)
German: 312 (3.5%)
Irish: 212 (2.4%)
Lithuanian: 194 (2.2%)
American: 193 (2.2%)
Czech: 159 (1.8%)
Egyptian: 137 (1.5%)
Greek: 119 (1.3%)
Slovak: 91 (1.0%)
African: 60 (0.7%)
Albanian: 46 (0.5%)
Italian: 38 (0.4%)
English: 33 (0.4%)
European: 29 (0.3%)
Danish: 22 (0.2%)
Dutch: 22 (0.2%)
Serbian: 17 (0.2%)
Arab: 16 (0.2%)
Haitian: 13 (0.1%)
Lebanese: 10 (0.1%)
German Russian: 9 (0.1%)
French: 8 (0.09%)
Croatian: 7 (0.08%)
Hungarian: 7 (0.08%)
Swedish: 5 (0.06%)
British: 2 (0.02%) Most common places of birth for foreign-born residents (%): Poland Bridgeview:
33.8% (1,346)Illinois:
6.9% (124,474)
Mexico Bridgeview:
26.0% (1,034)Illinois:
34.7% (626,958)
Asia, n.e.c. Bridgeview:
5.3% (213)Illinois:
0.4% (7,117)
Jordan Bridgeview:
4.2% (168)Illinois:
0.5% (8,827)
China, excluding Hong Kong and Taiwan Bridgeview:
2.9% (115)Illinois:
4.1% (74,364)
Egypt Bridgeview:
2.4% (95)Illinois:
0.3% (5,762)
Yemen Bridgeview:
2.2% (88)Illinois:
0.1% (1,771)
Greece Bridgeview:
2.2% (87)Illinois:
0.6% (10,720)
Bangladesh Bridgeview:
2.1% (84)Illinois:
0.2% (2,731)
Algeria Bridgeview:
2.1% (82)Illinois:
0.1% (2,465)
Czechoslovakia (includes Czech Republic and Slovakia) Bridgeview:
1.7% (68)Illinois:
0.3% (4,741)
Kuwait Bridgeview:
1.5% (61)Illinois:
0.1% (1,630)
Place of birth for U.S.-born residents:
This state: 10,604Other state: 1,496Northeast: 189Midwest: 706South: 404West: 200 92.9% of Bridgeview residents lived in the same house 1 years ago.
Out of people who lived in different houses, 48.2% lived in this county.
Out of people who lived in different counties, 71.6% lived in Illinois.
Bridgeview:
92.9%State average:
88.3%
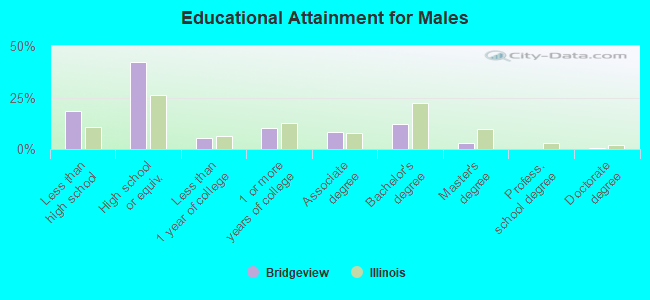
Education attainment for males 25 years and older:
No schooling: 227Nursery to 4th grade: 185th and 6th grade: 1607th and 8th grade: 1659th grade: 13510th grade: 5311th grade: 1912th grade, no diploma: 176High school graduate (or equivalency): 2,189Less than 1 year of college: 272Some college more than 1 year, no degree: 534Associate degree: 425Bachelor's degree: 628Master's degree: 157Professional school degree: 0Doctorate degree: 24
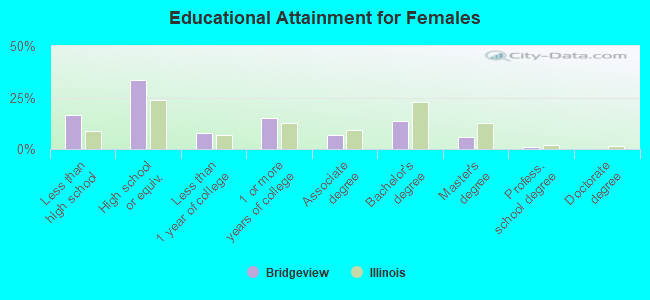
Education attainment for females 25 years and older:
No schooling: 216Nursery to 4th grade: 545th and 6th grade: 257th and 8th grade: 2979th grade: 2310th grade: 10011th grade: 5012th grade, no diploma: 254High school graduate (or equivalency): 2,067Less than 1 year of college: 477Some college more than 1 year, no degree: 914Associate degree: 417Bachelor's degree: 848Master's degree: 372Professional school degree: 50Doctorate degree: 5
Housing units in structures:
One, detached: 3,302One, attached: 263Two: 283 or 4: 1695 to 9: 1,00810 to 19: 44520 to 49: 26150 or more: 163Mobile homes: 1,046Median worth of mobile homes: $21,334
Housing units lacking complete plumbing facilities in 2022: 0.9%Housing units lacking complete kitchen facilities in 2022: 3.7%House/condo owner moved in on average 16 years ago
Renter moved in on average 3 years ago
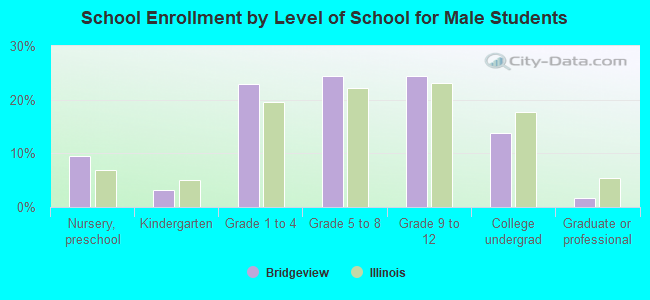
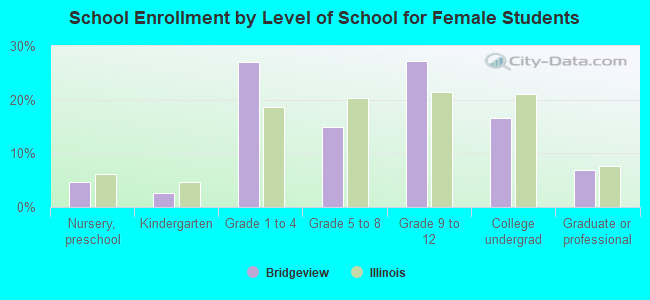
Private vs. public school enrollment:
Students in private schools in grades 1 to 8 (elementary and middle school): 256 Students in private schools in grades 9 to 12 (high school): 9 Students in private undergraduate colleges: 206