Bridgewater, VA (Virginia) Houses and Residents
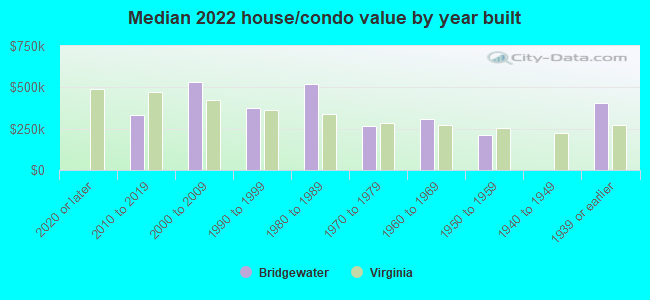
| Bridgewater: | $398,601 |
| Virginia: | $365,700 |
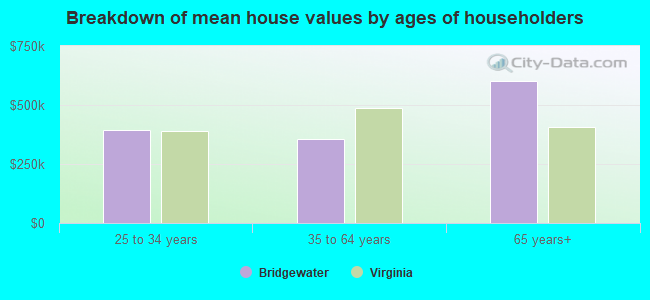
Mean price in 2022:
Detached houses: $318,899
Here: $318,899 State: $472,865 Townhouses or other attached units: $328,193
Here: $328,193 State: $457,437 In 2-unit structures: $197,223
Here: $197,223 State: $396,289 In 5-or-more-unit structures: $346,823
Here: $346,823 State: $382,551
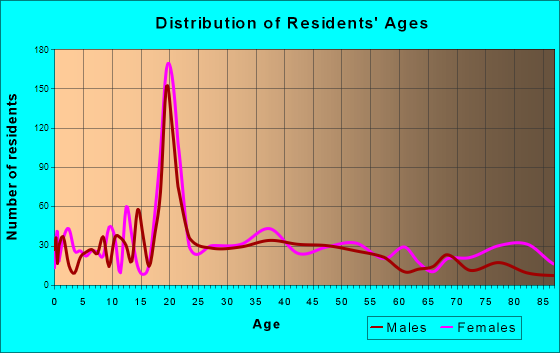
Total population: 5,951 (Urban population: 5,200, Rural population: 34 (all nonfarm))
Houses: 2,469 (2,265 occupied: 1,396 owner occupied, 968 renter occupied)
| % of renters here: | 41% |
| State: | 33% |
Housing density: 1,029 houses/condos per square mile
Median price asked for vacant for-sale houses and condos in 2022 in this county: $309,224.
Median contract rent in 2022: $898 (lower quartile is $818, upper quartile is $1,053)
Median rent asked for vacant for-rent units in 2022: $1,288
Median gross rent in Bridgewater, VA in 2022: $1,089
Housing units in Bridgewater with a mortgage: 981 (109 second mortgage, 0 home equity loan, 122 both second mortgage and home equity loan)
Houses without a mortgage: 42
Median household income for houses/condos with a mortgage: $111,634
Median household income for apartments without a mortgage: $48,415
Median monthly housing costs: $1,268
Compare current foreclosures near Bridgewater, VA:
| Photo | Address | Area | Beds / Baths | Price | Details |
|---|---|---|---|---|---|

|
#1
Homestead Dr
Bridgewater, VA 22812
|
3,770 sq. feet
|
2 baths 3 beds |
show details | |

|
#2
Lady Bug Rd
Bridgewater, VA 22812
|
1,070 sq. feet
|
- baths 3 beds |
show details | |

|
#3
Bruce St
Bridgewater, VA 22812
|
- sq. feet
|
- baths - beds |
show details | |

|
#4
Joyce Dr
Bridgewater, VA 22812
|
- sq. feet
|
- baths - beds |
show details | |

|
#5
Dolphin Ln
Broadway, VA 22815
|
1,248 sq. feet
|
2 baths 3 beds |
$335,000
|
show details |

|
#6
Selma Blvd
Staunton, VA 24401
|
2,066 sq. feet
|
2 baths 4 beds |
show details | |

|
#7
Berryfield Dr
Harrisonburg, VA 22801
|
4,318 sq. feet
|
2 baths 2 beds |
show details | |

|
#8
Churchville Ave
Churchville, VA 24421
|
3,141 sq. feet
|
2 baths 3 beds |
show details | |

|
#9
Mcgaheysville Rd
Penn Laird, VA 22846
|
3,588 sq. feet
|
1 baths 3 beds |
show details | |

|
#10
Gravels Rd
Harrisonburg, VA 22802
|
2,488 sq. feet
|
1 baths 2 beds |
show details |
| Photo | Address | Area | Beds / Baths | Price | Details |
|---|---|---|---|---|---|

|
#11
Craig Shop Rd
Mount Sidney, VA 24467
|
1,336 sq. feet
|
1 baths 2 beds |
show details | |

|
#12
Valley View Rd
Mc Gaheysville, VA 22840
|
1,679 sq. feet
|
3 baths 6 beds |
show details | |

|
#13
Wyer St
Weyers Cave, VA 24486
|
1,964 sq. feet
|
2 baths 3 beds |
show details | |

|
#14
Rawley Pike
Hinton, VA 22831
|
860 sq. feet
|
1 baths 3 beds |
show details | |

|
#15
Goldfinch Dr
Harrisonburg, VA 22802
|
1,696 sq. feet
|
2 baths 3 beds |
show details | |

|
#16
Weyers Cave Rd
Weyers Cave, VA 24486
|
1,796 sq. feet
|
2 baths 3 beds |
show details | |

|
#17
Goldfinch Dr
Harrisonburg, VA 22802
|
1,480 sq. feet
|
2 baths 3 beds |
show details | |

|
#18
Evas Ln
Dayton, VA 22821
|
924 sq. feet
|
1 baths 2 beds |
show details | |

|
#19
Terrace Run
Grottoes, VA 24441
|
1,392 sq. feet
|
2 baths 3 beds |
show details | |

|
#20
Westgate Rd
Verona, VA 24482
|
1,054 sq. feet
|
1 baths 3 beds |
show details |
| Photo | Address | Area | Beds / Baths | Price | Details |
|---|---|---|---|---|---|

|
#21
Mountain View Dr
Verona, VA 24482
|
1,701 sq. feet
|
2 baths 3 beds |
show details | |

|
#22
Mcgaheysville Rd
Mc Gaheysville, VA 22840
|
1,824 sq. feet
|
1 baths 3 beds |
show details | |

|
#23
Spring Oaks Dr
Harrisonburg, VA 22801
|
1,160 sq. feet
|
2 baths 2 beds |
show details | |

|
#24
Hangers Mill Rd
Churchville, VA 24421
|
1,865 sq. feet
|
2 baths 2 beds |
show details | |

|
#25
Turleytown Rd
Singers Glen, VA 22850
|
4,256 sq. feet
|
2 baths 3 beds |
show details | |

|
#26
Harriston Rd
Grottoes, VA 24441
|
960 sq. feet
|
1 baths 3 beds |
show details | |

|
#27
Brassie Way
Verona, VA 24482
|
2,694 sq. feet
|
2 baths 2 beds |
show details | |

|
#28
Hankey Mountain Hwy
Churchville, VA 24421
|
846 sq. feet
|
1 baths 2 beds |
show details | |

|
#29
Vinegar Hill Rd
Churchville, VA 24421
|
1,870 sq. feet
|
2 baths 3 beds |
show details | |

|
#30
Kettle View Rd
Elkton, VA 22827
|
1,394 sq. feet
|
2 baths 3 beds |
show details |
| Photo | Address | Area | Beds / Baths | Price | Details |
|---|---|---|---|---|---|

|
#31
Rising Creek Ln
Broadway, VA 22815
|
3,500 sq. feet
|
2 baths 3 beds |
show details | |

|
#32
Thorofare Rd
Crimora, VA 24431
|
3,392 sq. feet
|
3 baths 4 beds |
show details | |

|
#33
Thorofare Rd
Crimora, VA 24431
|
2,681 sq. feet
|
2 baths 3 beds |
show details | |

|
#34
Davis Rd
Penn Laird, VA 22846
|
8,054 sq. feet
|
5 baths 4 beds |
show details | |

|
#35
Clayborn Rd
Harrisonburg, VA 22802
|
4,344 sq. feet
|
2 baths 3 beds |
show details | |

|
#36
Franklin St
Harrisonburg, VA 22801
|
1,383 sq. feet
|
1 baths 3 beds |
show details | |

|
#37
Mill St
Mount Crawford, VA 22841
|
2,269 sq. feet
|
1 baths 3 beds |
show details | |

|
#38
Central Ave
Harrisonburg, VA 22801
|
1,856 sq. feet
|
1 baths 3 beds |
show details | |

|
#39
New York Ave
Harrisonburg, VA 22801
|
918 sq. feet
|
1 baths 2 beds |
show details | |

|
#40
Munchkin Ln
Harrisonburg, VA 22801
|
587 sq. feet
|
1 baths 2 beds |
show details |
| Photo | Address | Area | Beds / Baths | Price | Details |
|---|---|---|---|---|---|

|
#41
Woodland Dr
Harrisonburg, VA 22801
|
1,411 sq. feet
|
2 baths 3 beds |
show details | |

|
#42
Pear St
Harrisonburg, VA 22801
|
720 sq. feet
|
1 baths 2 beds |
show details | |

|
#43
Joppa Ct
Harrisonburg, VA 22801
|
2,022 sq. feet
|
2 baths 3 beds |
show details | |

|
#44
Reservoir St # 201
Harrisonburg, VA 22801
|
864 sq. feet
|
1 baths 3 beds |
show details | |

|
#45
Port Republic Rd
Harrisonburg, VA 22801
|
1,512 sq. feet
|
1 baths 2 beds |
show details | |

|
#46
Summit Ave
Harrisonburg, VA 22802
|
3,857 sq. feet
|
3 baths 4 beds |
show details | |

|
#47
Cumberland Dr
Harrisonburg, VA 22801
|
5,028 sq. feet
|
4 baths 4 beds |
show details | |

|
#48
Ridgetop Dr
Weyers Cave, VA 24486
|
2,088 sq. feet
|
2 baths 3 beds |
show details | |

|
#49
Westview St
Dayton, VA 22821
|
2,917 sq. feet
|
1 baths 3 beds |
show details | |

|
Check over 1 million property listings on Foreclosure.com!
|
browse all offers | |||

Latest news about housing in Bridgewater, VA collected exclusively by city-data.com from local newspapers, TV, and radio stations

 | Need current Staunton information (8 replies) |
| Seeking apartments in Harrisonburg area (1 reply) |
| Homes in Bridgewater...... (0 replies) |
| Downtown Harrisonburg/Massanutten (1 reply) |
| Apartments w/ garage in Hampton (1 reply) |
| Possible Job in Bridgewater-Looking for Area info/demographics etc... (5 replies) |
Median year apartment built: 1988
Household type by relationship:
Households: 6,691- Male householders: 1,053 (344 living alone), Female householders: 1,199 (559 living alone)
1,017 spouses (1,017 opposite-sex spouses), 129 unmarried partners, (129 opposite-sex unmarried partners), 1,418 children (1,390 natural, 0 adopted, 28 stepchildren), 0 grandchildren, 35 brothers or sisters, 73 parents, 0 foster children, 0 other relatives, 130 non-relatives
- In group quarters: 1,633
Size of family households: 464 2-persons, 275 3-persons, 342 4-persons, 197 5-persons, 41 6-persons.
Size of nonfamily households: 785 1-person, 104 2-persons, 28 3-persons.
992 married couples with children.
184 single-parent households (0 men, 184 women).
86.5% of residents of Bridgewater speak English at home.
4.5% of residents speak Spanish at home (83% speak English very well, 2% speak English well, 15% speak English not well).
6.1% of residents speak other Indo-European language at home (82% speak English very well, 16% speak English well, 3% speak English not well).
0.4% of residents speak Asian or Pacific Island language at home (81% speak English very well, 19% speak English well).
2.6% of residents speak other language at home (65% speak English very well, 17% speak English well, 18% speak English not well).
Foreign born population: 558 (8.3%)
(69.0% of them are naturalized citizens)
| Here: | 7.9 |
| State: | 7.0 |
| Here: | 4.4 |
| State: | 4.3 |
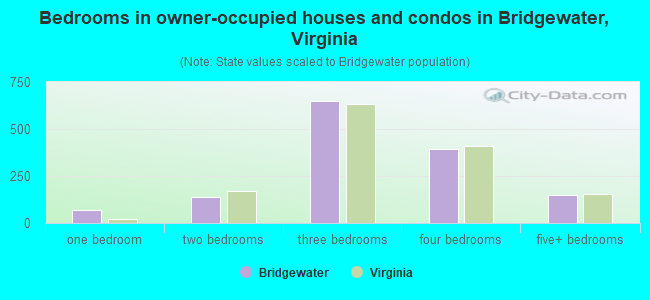
- Bedrooms in owner-occupied houses and condos in Bridgewater, Virginia
- 0no bedroom
- 691 bedroom
- 1372 bedrooms
- 6483 bedrooms
- 3944 bedrooms
- 1475+ bedrooms
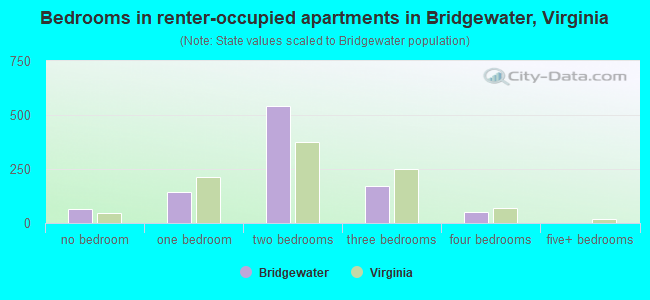
- Bedrooms in renter-occupied apartments in Bridgewater, Virginia
- 63no bedroom
- 1451 bedroom
- 5422 bedrooms
- 1693 bedrooms
- 504 bedrooms
- 05+ bedrooms
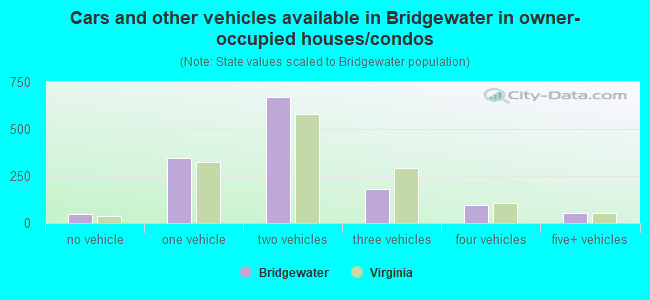
- Cars and other vehicles available in Bridgewater in owner-occupied houses/condos
- 47no vehicle
- 3461 vehicle
- 6722 vehicles
- 1823 vehicles
- 954 vehicles
- 545+ vehicles
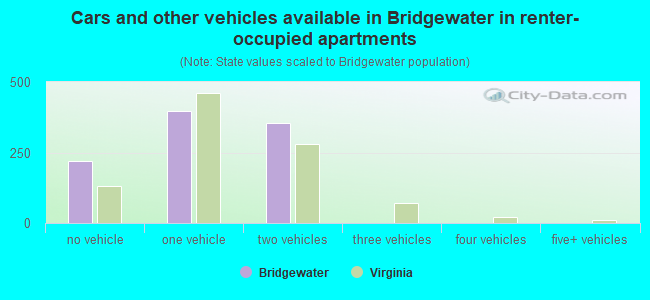
- Cars and other vehicles available in Bridgewater in renter-occupied apartments
- 220no vehicle
- 3961 vehicle
- 3532 vehicles
- 03 vehicles
- 04 vehicles
- 05+ vehicles
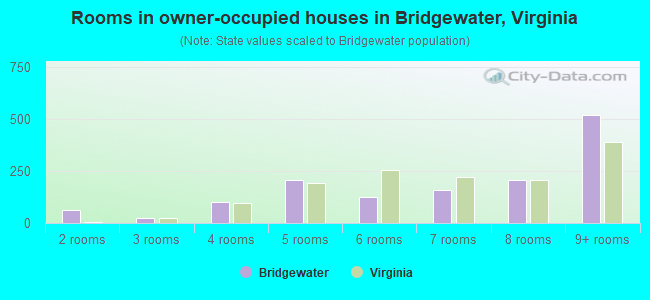
- Rooms in owner-occupied houses in Bridgewater, Virginia
- 01 room
- 602 rooms
- 243 rooms
- 994 rooms
- 2065 rooms
- 1276 rooms
- 1567 rooms
- 2068 rooms
- 5189+ rooms
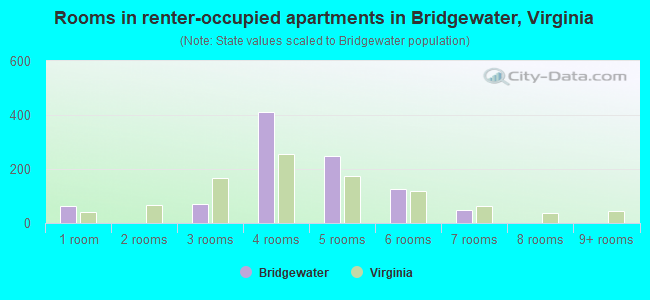
- Rooms in renter-occupied apartments in Bridgewater, Virginia
- 631 room
- 02 rooms
- 723 rooms
- 4104 rooms
- 2495 rooms
- 1256 rooms
- 507 rooms
- 08 rooms
- 09+ rooms
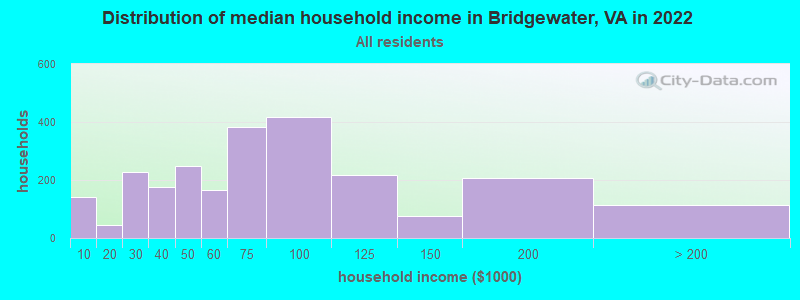
Bridgewater, VA household income distribution

- 143Less than $10,000
- 44$10,000 to $19,999
- 228$20,000 to $29,999
- 177$30,000 to $39,999
- 247$40,000 to $49,999
- 167$50,000 to $59,999
- 382$60,000 to $74,999
- 417$75,000 to $99,999
- 218$100,000 to $124,999
- 76$125,000 to $149,999
- 206$150,000 to $199,999
- 114$200,000 or more
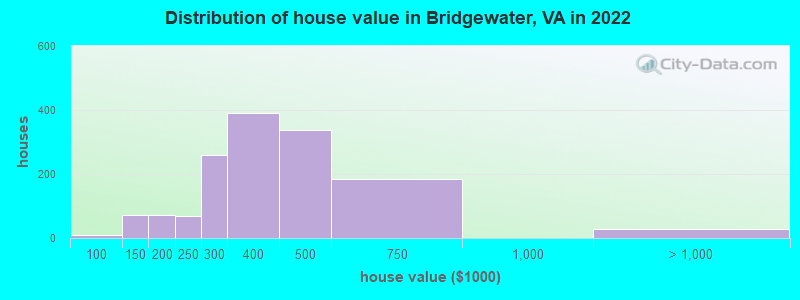
Home value of owner - occupied houses in 2022 in Bridgewater, VA
-
- 9$90,000 to $99,999
- 62$100,000 to $124,999
- 8$125,000 to $149,999
- 15$150,000 to $174,999
- 55$175,000 to $199,999
- 69$200,000 to $249,999
- 259$250,000 to $299,999
- 390$300,000 to $399,999
- 335$400,000 to $499,999
- 184$500,000 to $749,999
- 28$2,000,000 or more
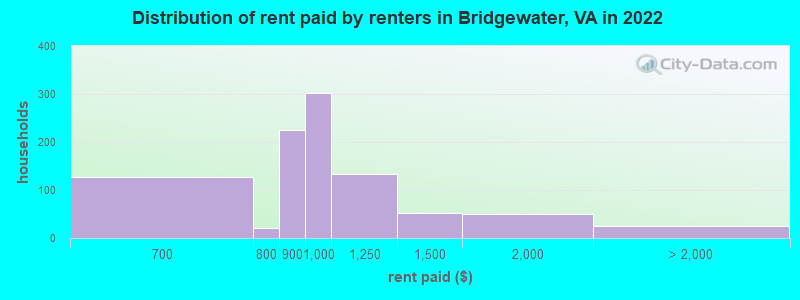
Rent paid by renters in 2022 in Bridgewater, VA
-
- 127$650 to $699
- 21$750 to $799
- 224$800 to $899
- 303$900 to $999
- 132$1,000 to $1,249
- 52$1,250 to $1,499
- 49$1,500 to $1,999
- 25$2,500 to $2,999
Percentage of workers working in this county: 56.2%
Number of people working at home: 376 (12.4% of all workers)
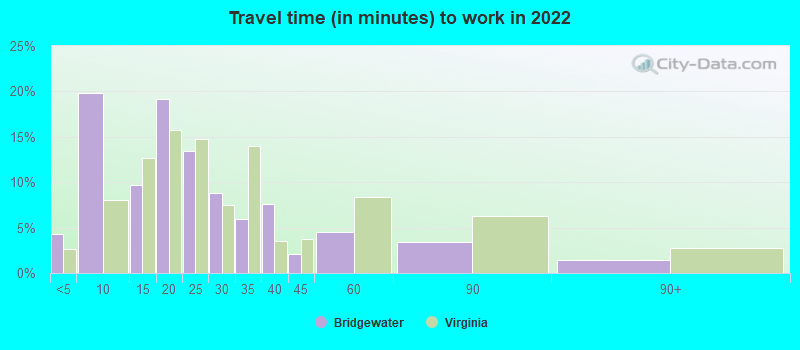
Travel time to work (commute)
- Less than 5 minutes: 240
- 5 to 9 minutes: 891
- 10 to 14 minutes: 414
- 15 to 19 minutes: 543
- 20 to 24 minutes: 302
- 25 to 29 minutes: 94
- 30 to 34 minutes: 158
- 35 to 39 minutes: 15
- 40 to 44 minutes: 0
- 45 to 59 minutes: 114
- 60 to 89 minutes: 32
- 90 or more minutes: 0
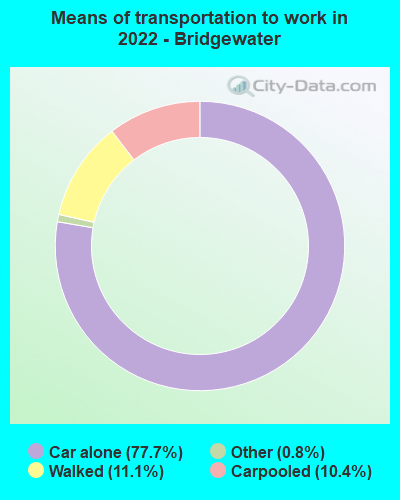
Means of transportation to work:
- Drove a car alone: 2,932 (69.0%)
- Carpooled: 398 (9.4%)
- Taxi: 36 (0.8%)
- Walked: 449 (10.6%)
- Worked at home: 376 (8.8%)
- Unemployment by race in 2022
- Unemployment rate for White non-Hispanic residents
- 8.4%Males
- 3.4%Females
- Unemployment rate for two or more race residents
- 5.1%Females
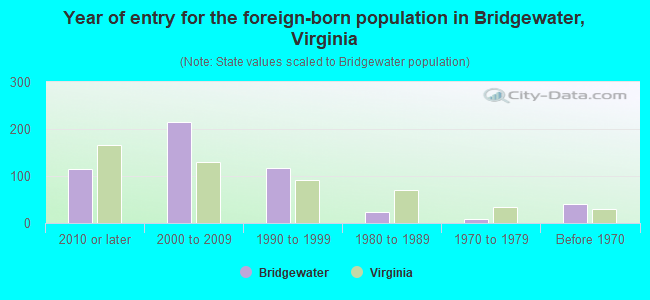
- Year of entry for the foreign-born population in Bridgewater, Virginia
- 1152010 or later
- 2152000 to 2009
- 1171990 to 1999
- 231980 to 1989
- 91970 to 1979
- 40Before 1970
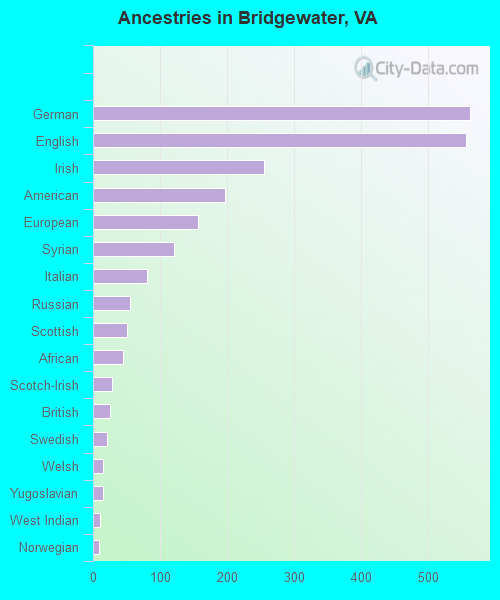
First ancestries reported:
- German: 563 (19.1%)
- English: 557 (18.9%)
- Irish: 255 (8.7%)
- American: 197 (6.7%)
- European: 156 (5.3%)
- Syrian: 121 (4.1%)
- Italian: 81 (2.7%)
- Russian: 55 (1.9%)
- Scottish: 51 (1.7%)
- African: 45 (1.5%)
- Scotch-Irish: 28 (1.0%)
- British: 25 (0.8%)
- Swedish: 21 (0.7%)
- Welsh: 15 (0.5%)
- Yugoslavian: 15 (0.5%)
- West Indian: 11 (0.4%)
- Norwegian: 9 (0.3%)
- Lebanese: 5 (0.2%)
- Palestinian: 5 (0.2%)
Most common places of birth for foreign-born residents (%):
| Bridgewater: | 34.1% (205) |
| Virginia: | 0.1% (1,246) |
| Bridgewater: | 27.0% (162) |
| Virginia: | 0.3% (2,743) |
| Bridgewater: | 15.8% (95) |
| Virginia: | 0.9% (9,351) |
| Bridgewater: | 10.8% (65) |
| Virginia: | 3.0% (32,892) |
| Bridgewater: | 7.2% (43) |
| Virginia: | 5.3% (57,498) |
| Bridgewater: | 6.3% (38) |
| Virginia: | 2.4% (25,722) |
| Bridgewater: | 4.5% (27) |
| Virginia: | 0.2% (2,328) |
| Bridgewater: | 3.5% (21) |
| Virginia: | 4.8% (52,629) |
| Bridgewater: | 2.5% (15) |
| Virginia: | 0.9% (9,440) |
| Bridgewater: | 2.2% (13) |
| Virginia: | 0.1% (1,291) |
| Bridgewater: | 1.8% (11) |
| Virginia: | 0.3% (3,452) |
| Bridgewater: | 1.8% (11) |
| Virginia: | 1.7% (18,227) |
Place of birth for U.S.-born residents:
- This state: 3,674
- Other state: 2,399
- Northeast: 799
- Midwest: 307
- South: 889
- West: 397
87.0% of Bridgewater residents lived in the same house 1 years ago.
Out of people who lived in different houses, 12.5% lived in this county.
Out of people who lived in different counties, 51.2% lived in Virginia.
| Bridgewater: | 87.0% |
| State average: | 86.6% |
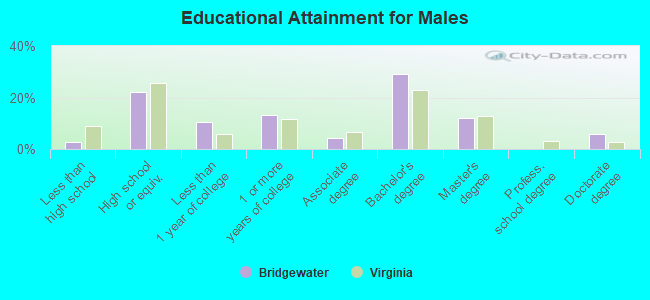
Education attainment for males 25 years and older:
- No schooling: 14
- Nursery to 4th grade: 0
- 5th and 6th grade: 0
- 7th and 8th grade: 0
- 9th grade: 2
- 10th grade: 10
- 11th grade: 11
- 12th grade, no diploma: 11
- High school graduate (or equivalency): 399
- Less than 1 year of college: 190
- Some college more than 1 year, no degree: 239
- Associate degree: 79
- Bachelor's degree: 522
- Master's degree: 213
- Professional school degree: 0
- Doctorate degree: 102
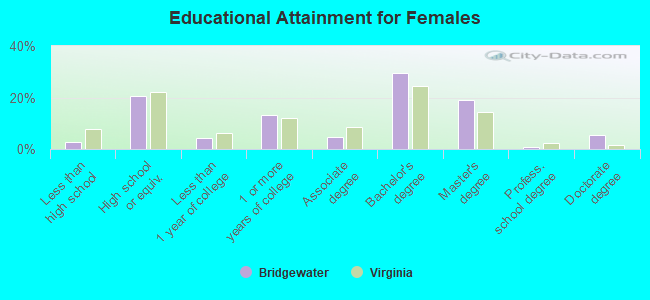
Education attainment for females 25 years and older:
- No schooling: 0
- Nursery to 4th grade: 0
- 5th and 6th grade: 0
- 7th and 8th grade: 8
- 9th grade: 10
- 10th grade: 20
- 11th grade: 17
- 12th grade, no diploma: 0
- High school graduate (or equivalency): 406
- Less than 1 year of college: 85
- Some college more than 1 year, no degree: 259
- Associate degree: 96
- Bachelor's degree: 587
- Master's degree: 379
- Professional school degree: 17
- Doctorate degree: 107
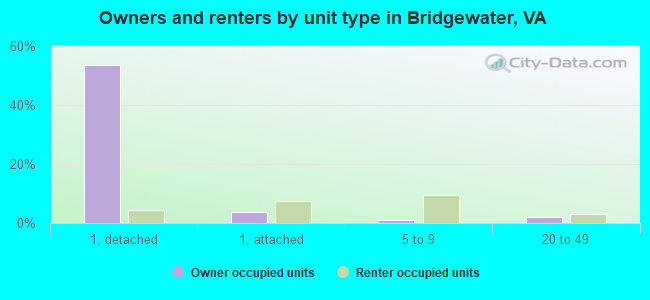
Housing units in structures:
- One, detached: 1,371
- One, attached: 266
- Two: 202
- 3 or 4: 299
- 5 to 9: 184
- 10 to 19: 16
- 20 to 49: 68
- 50 or more: 60
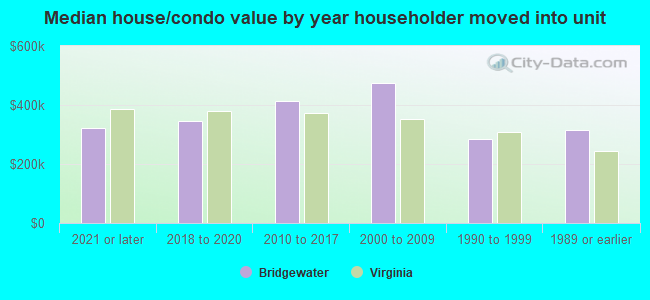
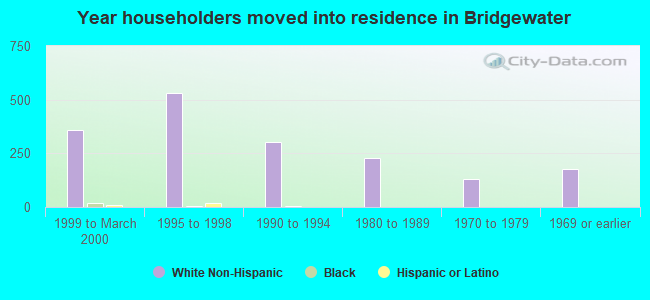
House/condo owner moved in on average 7 years ago
Renter moved in on average 5 years ago
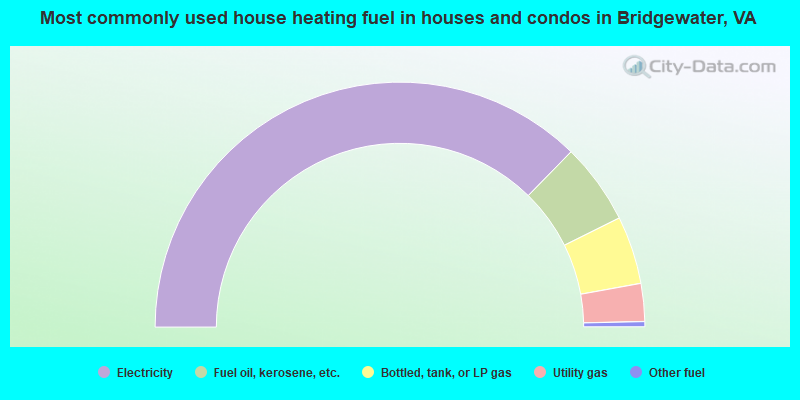
- 74.7%Electricity
- 10.7%Fuel oil, kerosene, etc.
- 9.0%Bottled, tank, or LP gas
- 5.0%Utility gas
- 0.7%Other fuel
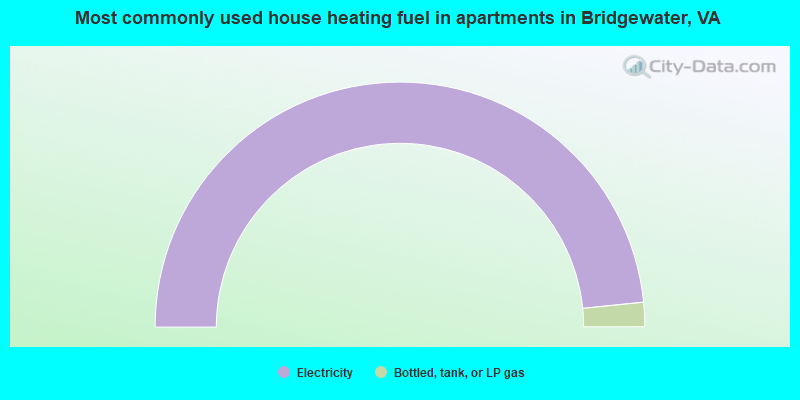
- 96.8%Electricity
- 3.2%Bottled, tank, or LP gas
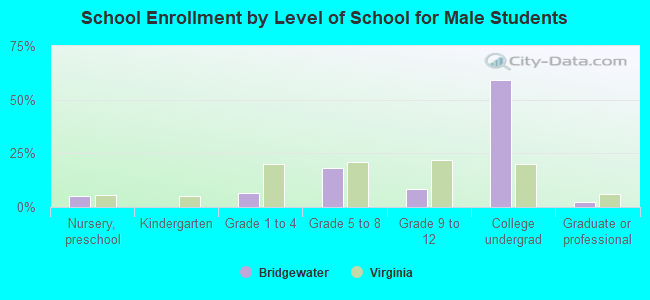
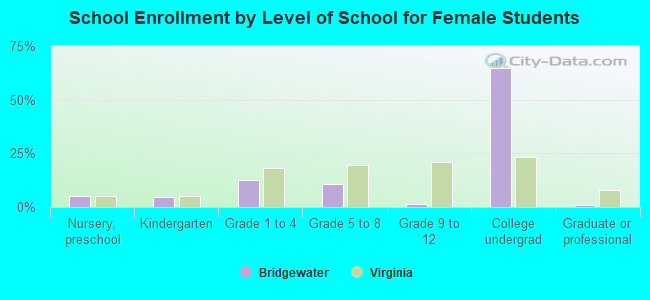
Private vs. public school enrollment:
| Here: | 22.8% |
| Virginia: | 13.2% |
| Here: | 28.6% |
| Virginia: | 10.2% |
| Here: | 88.5% |
| Virginia: | 18.7% |