Brielle, NJ (New Jersey) Houses and Residents
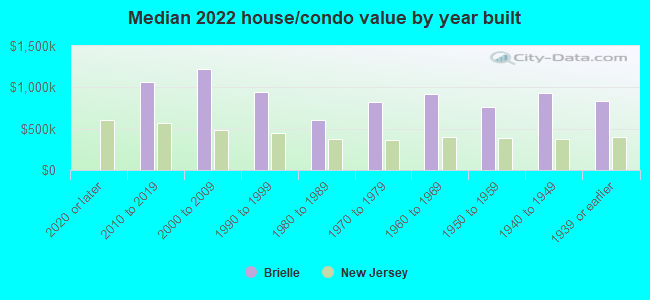
| Brielle: | $857,258 |
| New Jersey: | $428,900 |
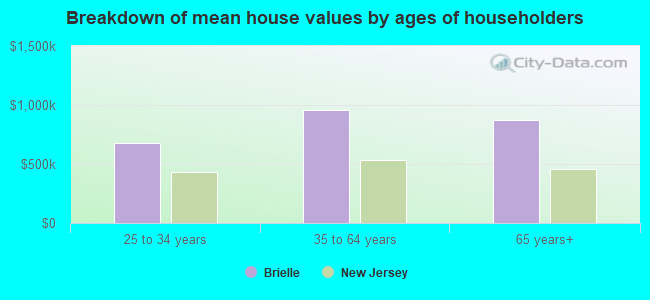
Mean price in 2022:
Detached houses: $930,495
Here: $930,495 State: $537,591 Townhouses or other attached units: $510,872
Here: $510,872 State: $381,113 In 3-to-4-unit structures: $584,333
Here: $584,333 State: $457,463
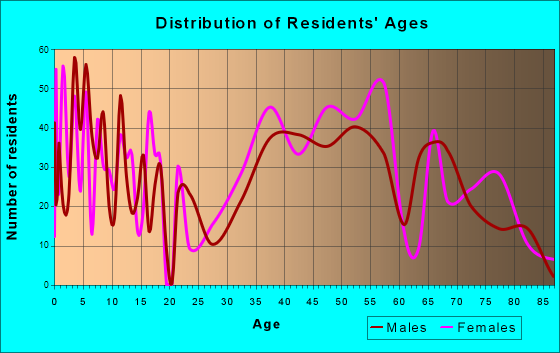
Total population: 4,759 (All urban)
Houses: 2,160 (1,855 occupied: 1,770 owner occupied, 117 renter occupied)
| % of renters here: | 6% |
| State: | 35% |
Housing density: 1,216 houses/condos per square mile
Median price asked for vacant for-sale houses and condos in 2022 in this county: $430,351.
Median contract rent in 2022: over $2,000 (lower quartile is over $2,000, upper quartile is over $2,000)
Median rent asked for vacant for-rent units in 2022: $1,876
Median gross rent in Brielle, NJ in 2022: over $2,000
Housing units in Brielle with a mortgage: 1,030 (165 second mortgage, 7 home equity loan, 134 both second mortgage and home equity loan)
Houses without a mortgage: 47
Median household income for houses/condos with a mortgage: $180,211
Median household income for apartments without a mortgage: $107,890
Median monthly housing costs: $2,440
Compare current foreclosures near Brielle, NJ:
| Photo | Address | Area | Beds / Baths | Price | Details |
|---|---|---|---|---|---|

|
#1
Rankin Rd
Brielle, NJ 08730
|
- sq. feet
|
3 baths 4 beds |
show details | |

|
#2
Susan Ln
Brielle, NJ 08730
|
- sq. feet
|
2 baths 2 beds |
show details | |

|
#3
Ashley Ave
Brielle, NJ 08730
|
1,212 sq. feet
|
- baths - beds |
show details | |

|
#4
Ashley 401
Brielle, NJ 08730
|
1,212 sq. feet
|
- baths - beds |
show details | |

|
#5
Higgins Ave # 254
Brielle, NJ 08730
|
- sq. feet
|
- baths - beds |
show details | |

|
#6
Lenni-Lenape Trl
Brielle, NJ 08730
|
- sq. feet
|
- baths - beds |
show details | |

|
#7
Lenni Lenape Trl
Brielle, NJ 08730
|
- sq. feet
|
- baths - beds |
show details | |

|
#8
Blue Heron Ct
Point Pleasant Beach, NJ 08742
|
2,059 sq. feet
|
2 baths 3 beds |
$750,500
|
show details |

|
#9
Fisk Ave
Brielle, NJ 08730
|
- sq. feet
|
- baths - beds |
show details | |

|
#10
Brielle Ave
Brielle, NJ 08730
|
- sq. feet
|
- baths - beds |
show details |
| Photo | Address | Area | Beds / Baths | Price | Details |
|---|---|---|---|---|---|

|
#11
Longstreet Ave
Brielle, NJ 08730
|
- sq. feet
|
- baths - beds |
show details | |

|
#12
Old Bridge Rd
Brielle, NJ 08730
|
- sq. feet
|
- baths - beds |
show details | |

|
#13
Park Ave
Brielle, NJ 08730
|
- sq. feet
|
- baths - beds |
show details | |

|
#14
Black Pine Ln
Brielle, NJ 08730
|
- sq. feet
|
- baths - beds |
show details | |

|
#15
Crawford Street
Red Bank, NJ 07701
|
1,280 sq. feet
|
1 baths 2 beds |
show details | |

|
#16
Forest Dr
Lakewood, NJ 08701
|
1,768 sq. feet
|
1 baths 3 beds |
show details | |

|
#17
Beachwood Blvd
Beachwood, NJ 08722
|
2,550 sq. feet
|
3 baths 4 beds |
show details | |

|
#18
Wilkinson Dr
Toms River, NJ 08755
|
2,370 sq. feet
|
2 baths 4 beds |
show details | |

|
#19
Carter St
Toms River, NJ 08753
|
1,326 sq. feet
|
2 baths 3 beds |
show details | |

|
#20
Drummond Ave
Neptune, NJ 07753
|
928 sq. feet
|
1 baths 2 beds |
show details |
| Photo | Address | Area | Beds / Baths | Price | Details |
|---|---|---|---|---|---|

|
#21
Wooddale Ave
Point Pleasant Beach, NJ 08742
|
1,242 sq. feet
|
2 baths 3 beds |
show details | |

|
#22
Cheyenne St
Asbury Park, NJ 07712
|
1,840 sq. feet
|
2 baths 3 beds |
show details | |

|
#23
Jib Cir
Brick, NJ 08723
|
1,580 sq. feet
|
2 baths 4 beds |
show details | |

|
#24
1st Ave
Asbury Park, NJ 07712
|
1,318 sq. feet
|
1 baths 2 beds |
show details | |

|
#25
Potter Rd
Freehold, NJ 07728
|
4,062 sq. feet
|
3 baths 5 beds |
show details | |

|
#26
Brookforest Dr
Toms River, NJ 08757
|
1,248 sq. feet
|
2 baths 3 beds |
show details | |

|
#27
Bimini Dr
Toms River, NJ 08757
|
1,124 sq. feet
|
1 baths 2 beds |
show details | |

|
#28
Meadow Run Ct
Jackson, NJ 08527
|
3,040 sq. feet
|
3 baths 4 beds |
show details | |

|
#29
Cumberland Dr
Brick, NJ 08723
|
1,512 sq. feet
|
2 baths 3 beds |
show details | |

|
#30
Woodlake Manor Dr
Lakewood, NJ 08701
|
1,059 sq. feet
|
1 baths 2 beds |
show details |
| Photo | Address | Area | Beds / Baths | Price | Details |
|---|---|---|---|---|---|

|
#31
Primrose Ln
Brick, NJ 08724
|
1,120 sq. feet
|
1 baths 2 beds |
show details | |

|
#32
Baser Ln
Brick, NJ 08724
|
1,021 sq. feet
|
2 baths 2 beds |
show details | |

|
#33
Forman Ave
Point Pleasant Beach, NJ 08742
|
1,672 sq. feet
|
2 baths 3 beds |
show details | |

|
#34
Widgeon Dr
Bayville, NJ 08721
|
1,600 sq. feet
|
2 baths 4 beds |
show details | |

|
#35
Pkwy Dr
Freehold, NJ 07728
|
1,262 sq. feet
|
1 baths 2 beds |
show details | |

|
#36
Kent Rd
Howell, NJ 07731
|
1,104 sq. feet
|
2 baths 4 beds |
show details | |

|
#37
Forest Glen Ct
Toms River, NJ 08755
|
3,509 sq. feet
|
4 baths 5 beds |
show details | |

|
#38
Cedar Swamp Rd
Jackson, NJ 08527
|
1,799 sq. feet
|
3 baths 4 beds |
show details | |

|
#39
Stratford Ave
Neptune, NJ 07753
|
1,058 sq. feet
|
1 baths 3 beds |
show details | |

|
#40
Creamery Ct
Freehold, NJ 07728
|
1,510 sq. feet
|
1 baths 3 beds |
show details |
| Photo | Address | Area | Beds / Baths | Price | Details |
|---|---|---|---|---|---|

|
#41
Fort De France Ave
Toms River, NJ 08757
|
1,124 sq. feet
|
1 baths 2 beds |
show details | |

|
#42
Oak Knoll Rd
Asbury Park, NJ 07712
|
2,596 sq. feet
|
- baths - beds |
show details | |

|
#43
Church St
Manasquan, NJ 08736
|
4,406 sq. feet
|
- baths - beds |
show details | |

|
#44
Tennis Ct
Belmar, NJ 07719
|
1,700 sq. feet
|
- baths 3 beds |
show details | |

|
#45
Lester Rd
Toms River, NJ 08753
|
2,120 sq. feet
|
- baths - beds |
show details | |

|
#46
Mccormick Dr
Toms River, NJ 08753
|
2,598 sq. feet
|
- baths - beds |
show details | |

|
#47
Mccormick Dr
Toms River, NJ 08753
|
2,598 sq. feet
|
- baths - beds |
show details | |

|
#48
Turner Rd
Freehold, NJ 07728
|
966 sq. feet
|
- baths 3 beds |
show details | |

|
#49
Marble Way
Lakewood, NJ 08701
|
2,652 sq. feet
|
- baths - beds |
show details | |

|
Check over 1 million property listings on Foreclosure.com!
|
browse all offers | |||

Latest news about housing in Brielle, NJ collected exclusively by city-data.com from local newspapers, TV, and radio stations

 | NJ Real Estate Market. (124 replies) |
| Where past Brick does Ocean County end and Monmouth County begin? (Brielle?) (16 replies) |
| NJ Cities/Large Suburbs, Ranked (56 replies) |
| Wall Township (South Wall) or Brielle Advice Needed (2 replies) |
| Long term Rental In Brielle, NJ (1 reply) |
| Maybe NJ would work (29 replies) |
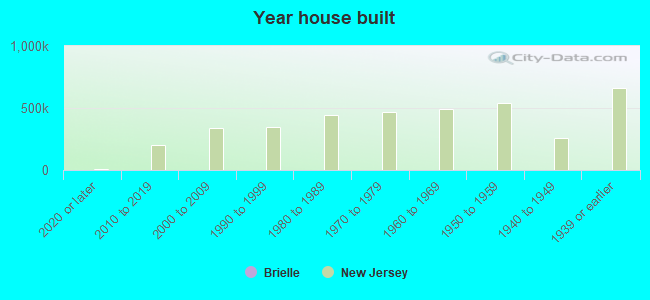
Median year apartment built: 1973
Household type by relationship:
Households: 4,964- Male householders: 841 (155 living alone), Female householders: 1,007 (347 living alone)
1,156 spouses (1,156 opposite-sex spouses), 57 unmarried partners, (57 opposite-sex unmarried partners), 1,757 children (1,645 natural, 88 adopted, 24 stepchildren), 12 grandchildren, 19 brothers or sisters, 84 parents, 0 foster children, 29 other relatives, 0 non-relatives
Size of family households: 600 2-persons, 265 3-persons, 208 4-persons, 199 5-persons, 64 6-persons, 12 7-or-more-persons.
Size of nonfamily households: 501 1-person, 48 2-persons.
1,053 married couples with children.
120 single-parent households (46 men, 74 women).
92.6% of residents of Brielle speak English at home.
3.0% of residents speak Spanish at home (41% speak English very well, 49% speak English well, 10% speak English not well).
3.0% of residents speak other Indo-European language at home (70% speak English very well, 9% speak English well, 6% speak English not well, 14% don't speak English at all).
0.2% of residents speak Asian or Pacific Island language at home (100% speak English not well).
0.3% of residents speak other language at home (100% speak English very well).
Foreign born population: 202 (4.1%)
(76.2% of them are naturalized citizens)
| Here: | 7.7 |
| State: | 6.8 |
| Here: | 5.7 |
| State: | 3.9 |
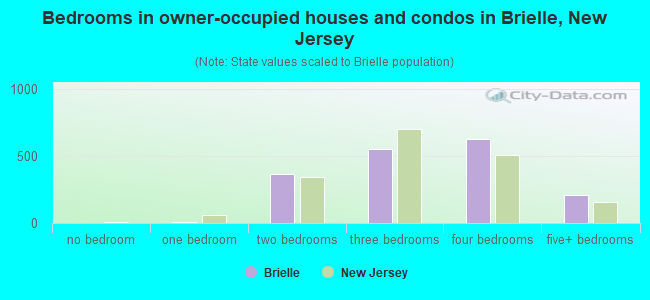
- Bedrooms in owner-occupied houses and condos in Brielle, New Jersey
- 0no bedroom
- 91 bedroom
- 3662 bedrooms
- 5533 bedrooms
- 6304 bedrooms
- 2125+ bedrooms
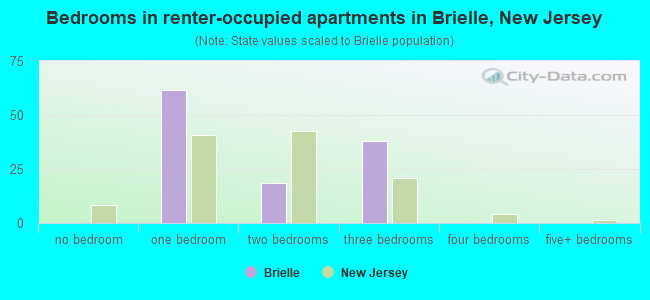
- Bedrooms in renter-occupied apartments in Brielle, New Jersey
- 0no bedroom
- 611 bedroom
- 182 bedrooms
- 383 bedrooms
- 04 bedrooms
- 05+ bedrooms
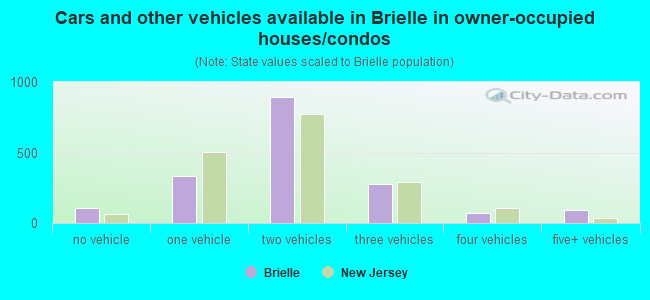
- Cars and other vehicles available in Brielle in owner-occupied houses/condos
- 104no vehicle
- 3321 vehicle
- 8962 vehicles
- 2793 vehicles
- 704 vehicles
- 895+ vehicles
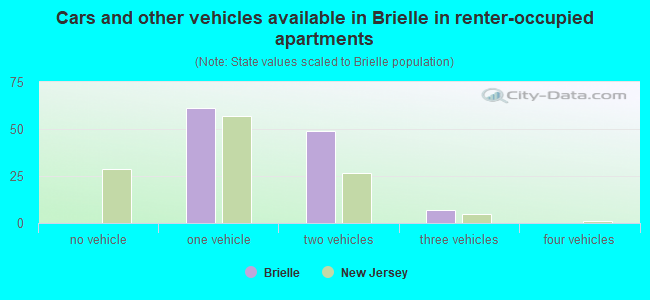
- Cars and other vehicles available in Brielle in renter-occupied apartments
- 0no vehicle
- 611 vehicle
- 492 vehicles
- 73 vehicles
- 04 vehicles
- 05+ vehicles
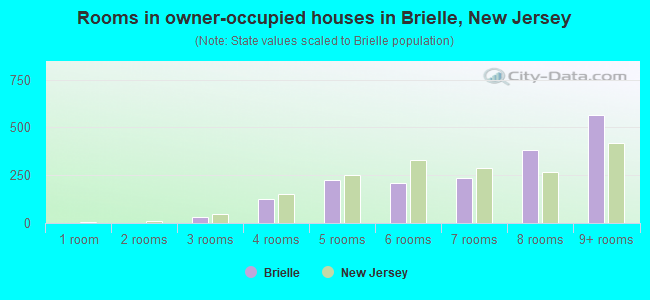
- Rooms in owner-occupied houses in Brielle, New Jersey
- 01 room
- 02 rooms
- 323 rooms
- 1284 rooms
- 2245 rooms
- 2076 rooms
- 2337 rooms
- 3818 rooms
- 5669+ rooms
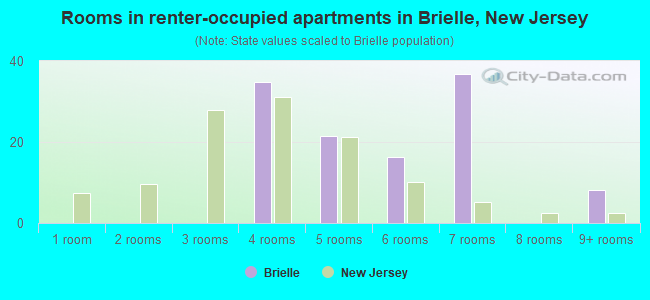
- Rooms in renter-occupied apartments in Brielle, New Jersey
- 01 room
- 02 rooms
- 03 rooms
- 354 rooms
- 215 rooms
- 166 rooms
- 377 rooms
- 08 rooms
- 89+ rooms
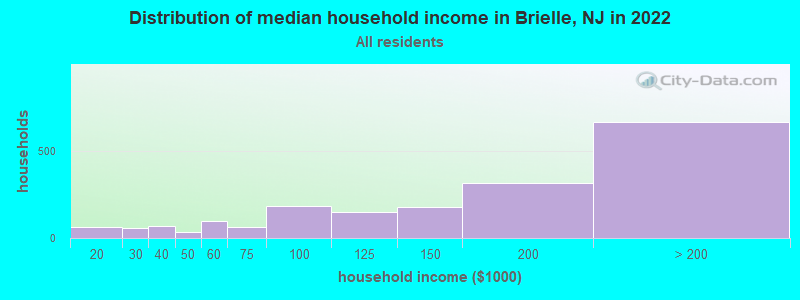
Brielle, NJ household income distribution

- 62$10,000 to $19,999
- 60$20,000 to $29,999
- 66$30,000 to $39,999
- 37$40,000 to $49,999
- 96$50,000 to $59,999
- 63$60,000 to $74,999
- 184$75,000 to $99,999
- 146$100,000 to $124,999
- 177$125,000 to $149,999
- 312$150,000 to $199,999
- 664$200,000 or more
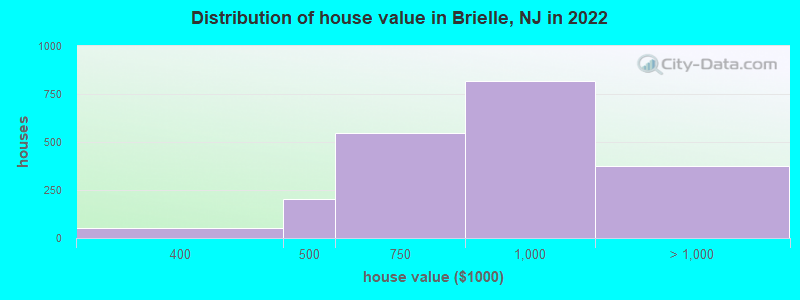
Home value of owner - occupied houses in 2022 in Brielle, NJ
-
- 6$100,000 to $124,999
- 52$300,000 to $399,999
- 200$400,000 to $499,999
- 546$500,000 to $749,999
- 818$750,000 to $999,999
- 253$1,000,000 to $1,499,999
- 80$1,500,000 to $1,999,999
- 40$2,000,000 or more
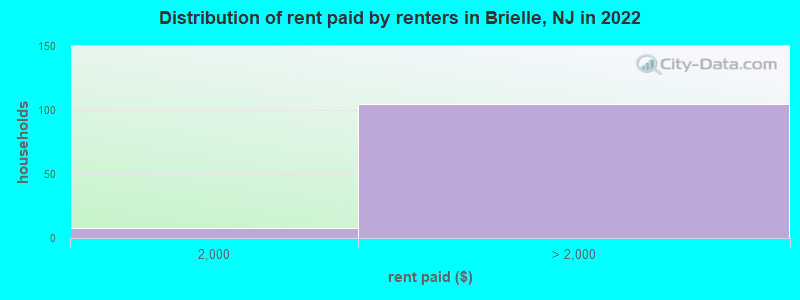
Rent paid by renters in 2022 in Brielle, NJ
-
- 7$1,500 to $1,999
- 65$2,000 to $2,499
- 28$2,500 to $2,999
- 11$3,500 or more
Percentage of workers working in this county: 70.0%
Number of people working at home: 544 (22.5% of all workers)
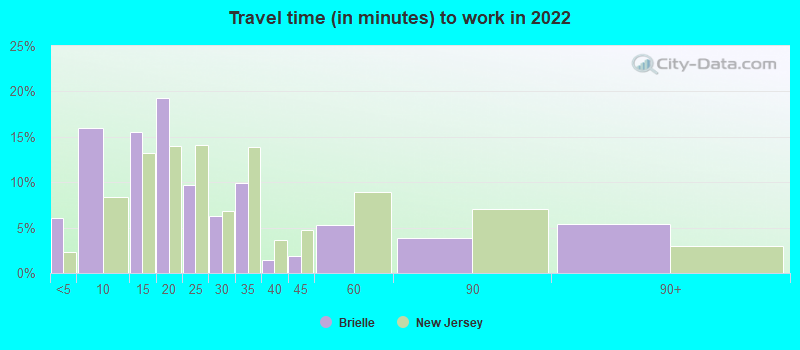
Travel time to work (commute)
- Less than 5 minutes: 77
- 5 to 9 minutes: 176
- 10 to 14 minutes: 274
- 15 to 19 minutes: 311
- 20 to 24 minutes: 106
- 25 to 29 minutes: 98
- 30 to 34 minutes: 338
- 35 to 39 minutes: 42
- 40 to 44 minutes: 80
- 45 to 59 minutes: 139
- 60 to 89 minutes: 178
- 90 or more minutes: 69
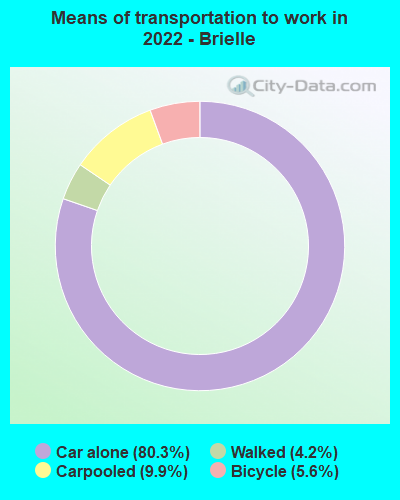
Means of transportation to work:
- Drove a car alone: 1,028 (56.1%)
- Carpooled: 150 (8.2%)
- Bicycle: 52 (2.8%)
- Walked: 81 (4.4%)
- Worked at home: 544 (29.7%)
- Unemployment by race in 2022
- Unemployment rate for White non-Hispanic residents
- 3.1%Males
- 4.3%Females
- Unemployment rate for American Indian and Alaska Native residents
- 36.0%Females
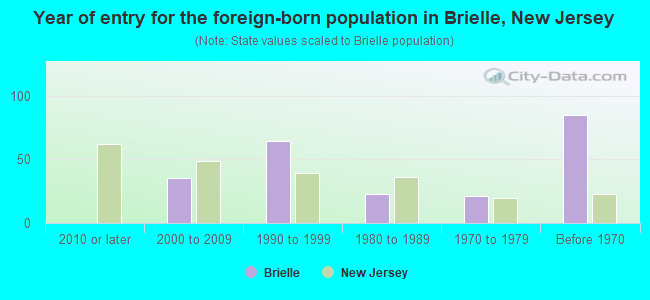
- Year of entry for the foreign-born population in Brielle, New Jersey
- 02010 or later
- 362000 to 2009
- 651990 to 1999
- 231980 to 1989
- 211970 to 1979
- 85Before 1970
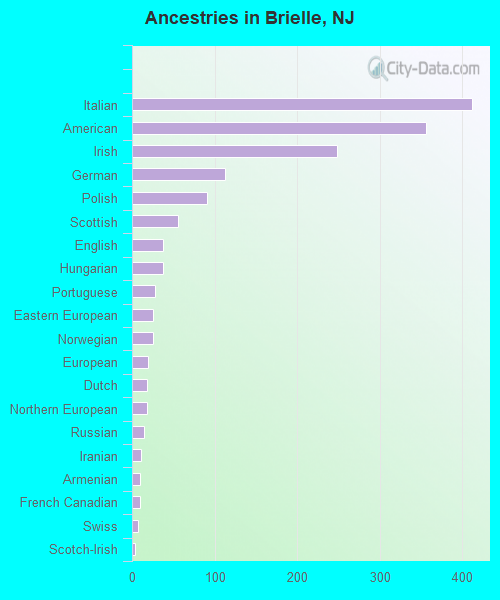
First ancestries reported:
- Italian: 412 (23.3%)
- American: 356 (20.1%)
- Irish: 249 (14.1%)
- German: 113 (6.4%)
- Polish: 91 (5.1%)
- Scottish: 56 (3.2%)
- English: 38 (2.1%)
- Hungarian: 37 (2.1%)
- Portuguese: 28 (1.6%)
- Eastern European: 26 (1.5%)
- Norwegian: 25 (1.4%)
- European: 19 (1.1%)
- Dutch: 18 (1.0%)
- Northern European: 18 (1.0%)
- Russian: 15 (0.8%)
- Iranian: 11 (0.6%)
- Armenian: 10 (0.6%)
- French Canadian: 10 (0.6%)
- Swiss: 7 (0.4%)
- Scotch-Irish: 4 (0.2%)
Most common places of birth for foreign-born residents (%):
| Brielle: | 16.3% (33) |
| New Jersey: | 3.7% (78,969) |
| Brielle: | 13.9% (28) |
| New Jersey: | 1.3% (28,871) |
| Brielle: | 10.9% (22) |
| New Jersey: | 2.7% (58,563) |
| Brielle: | 10.4% (21) |
| New Jersey: | 2.3% (48,811) |
| Brielle: | 9.4% (19) |
| New Jersey: | 0.9% (18,317) |
| Brielle: | 8.9% (18) |
| New Jersey: | 0.5% (10,246) |
| Brielle: | 8.9% (18) |
| New Jersey: | 0.2% (4,579) |
| Brielle: | 5.9% (12) |
| New Jersey: | 0.8% (16,778) |
| Brielle: | 5.4% (11) |
| New Jersey: | 0.2% (4,947) |
| Brielle: | 5.4% (11) |
| New Jersey: | 0.5% (10,886) |
Place of birth for U.S.-born residents:
- This state: 3,808
- Other state: 933
- Northeast: 690
- Midwest: 54
- South: 122
- West: 72
98.0% of Brielle residents lived in the same house 1 years ago.
Out of people who lived in different houses, 40.5% lived in this county.
Out of people who lived in different counties, 70.0% lived in New Jersey.
| Brielle: | 98.0% |
| State average: | 90.4% |
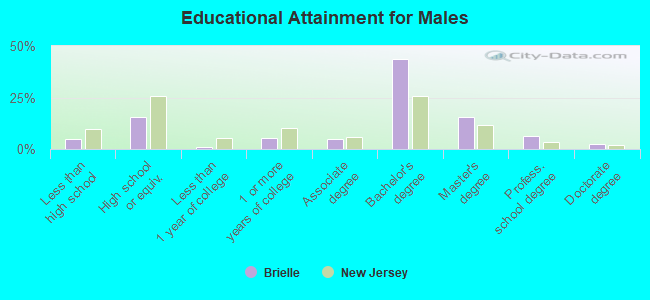
Education attainment for males 25 years and older:
- No schooling: 48
- Nursery to 4th grade: 0
- 5th and 6th grade: 0
- 7th and 8th grade: 0
- 9th grade: 0
- 10th grade: 0
- 11th grade: 0
- 12th grade, no diploma: 29
- High school graduate (or equivalency): 248
- Less than 1 year of college: 17
- Some college more than 1 year, no degree: 87
- Associate degree: 81
- Bachelor's degree: 706
- Master's degree: 248
- Professional school degree: 103
- Doctorate degree: 40
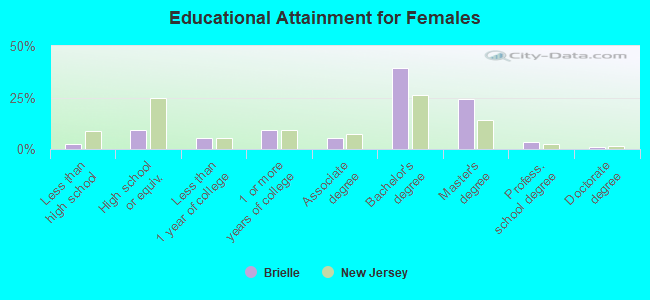
Education attainment for females 25 years and older:
- No schooling: 29
- Nursery to 4th grade: 0
- 5th and 6th grade: 0
- 7th and 8th grade: 0
- 9th grade: 7
- 10th grade: 0
- 11th grade: 0
- 12th grade, no diploma: 8
- High school graduate (or equivalency): 168
- Less than 1 year of college: 98
- Some college more than 1 year, no degree: 168
- Associate degree: 99
- Bachelor's degree: 705
- Master's degree: 438
- Professional school degree: 64
- Doctorate degree: 16
Housing units in structures:
- One, detached: 1,689
- One, attached: 285
- Two: 53
- 3 or 4: 131
Housing units lacking complete kitchen facilities in 2022: 1.4%
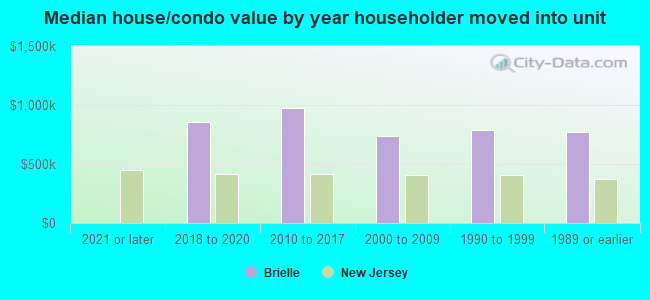
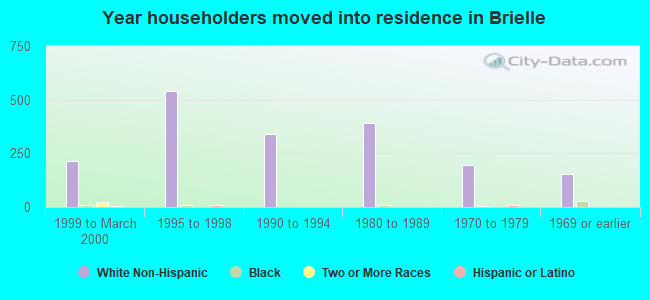
House/condo owner moved in on average 14 years ago
Renter moved in on average 5 years ago
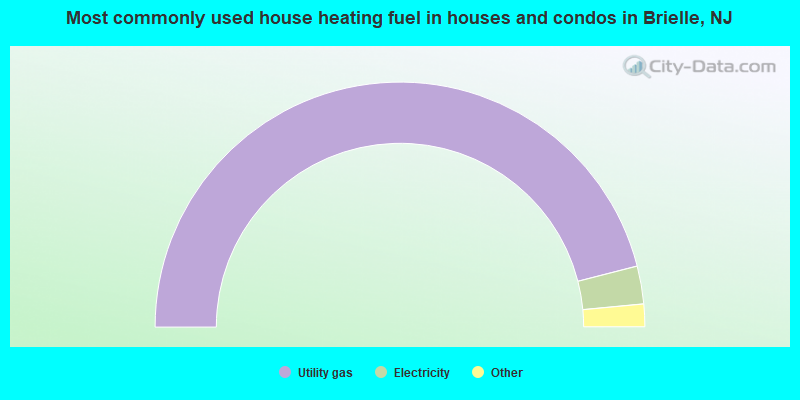
- 92.1%Utility gas
- 5.0%Electricity
- 2.4%Fuel oil, kerosene, etc.
- 0.5%Wood
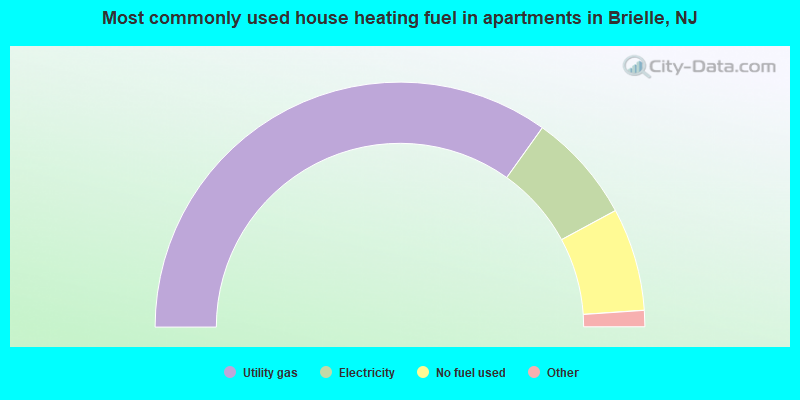
- 71.3%Utility gas
- 14.8%Electricity
- 13.9%No fuel used
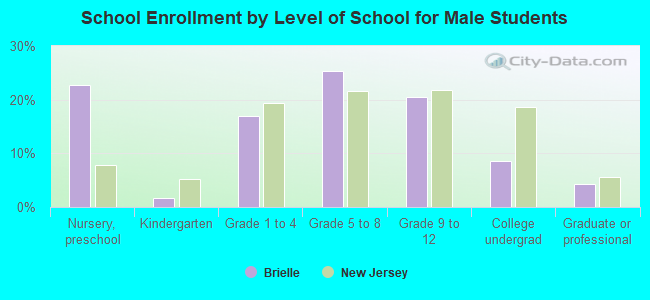
Private vs. public school enrollment:
| Here: | 0.0% |
| New Jersey: | 12.3% |
| Here: | 11.1% |
| New Jersey: | 13.1% |
| Here: | 15.7% |
| New Jersey: | 33.2% |