Cambria, IL (Illinois) Houses and Residents
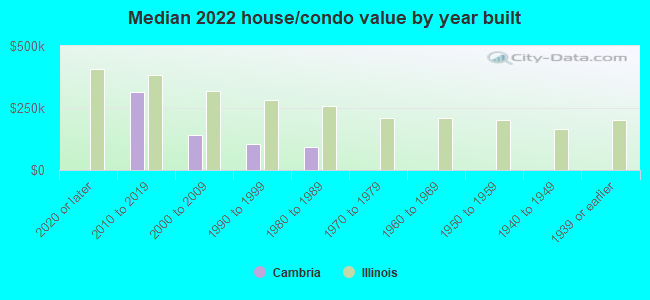
| Cambria: | $159,547 |
| Illinois: | $251,600 |
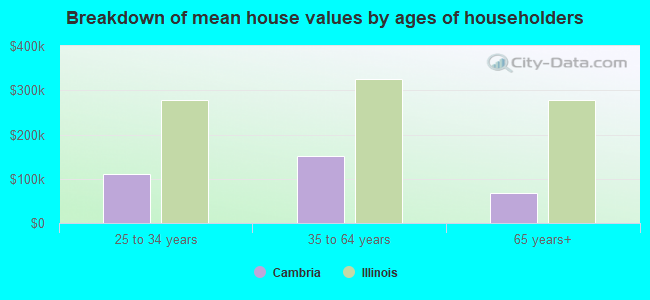
Mean price in 2022:
Detached houses: $123,830
Here: $123,830 State: $310,164 Mobile homes: $47,837
Here: $47,837 State: $78,855
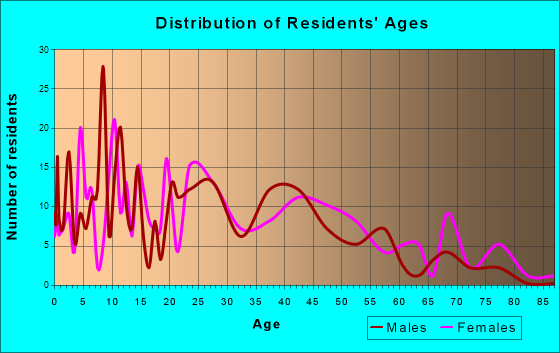
Total population: 1,260 (All urban)
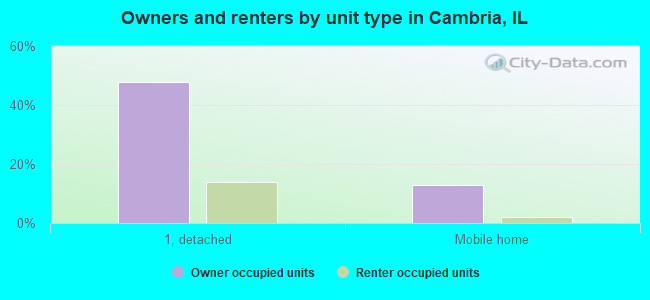
Houses: 736 (639 occupied: 271 owner occupied, 377 renter occupied)
| % of renters here: | 58% |
| State: | 33% |
Housing density: 539 houses/condos per square mile
Median price asked for vacant for-sale houses and condos in 2022: $399,779.
Median contract rent in 2022: $587 (lower quartile is $387, upper quartile is $916)
Median rent asked for vacant for-rent units in 2022: $592
Median gross rent in Cambria, IL in 2022: $844
Housing units in Cambria with a mortgage: 152 (2 second mortgage, 0 home equity loan, 2 both second mortgage and home equity loan)
Houses without a mortgage: 0
Median household income for houses/condos with a mortgage: $59,576
Median household income for apartments without a mortgage: $56,379
Median monthly housing costs: $911
Compare current foreclosures near Cambria, IL:
| Photo | Address | Area | Beds / Baths | Price | Details |
|---|---|---|---|---|---|

|
#1
S Gardner St
West Frankfort, IL 62896
|
1,196 sq. feet
|
1 baths 3 beds |
$105,000
|
show details |

|
#2
Kim St
De Soto, IL 62924
|
1,260 sq. feet
|
2 baths 3 beds |
$125,000
|
show details |

|
#3
E Grand Ave
Carbondale, IL 62902
|
1,550 sq. feet
|
1 baths 3 beds |
$164,900
|
show details |

|
#4
S Midway St
Herrin, IL 62948
|
1,772 sq. feet
|
2 baths 3 beds |
$174,900
|
show details |

|
#5
Roblee Ave
Murphysboro, IL 62966
|
- sq. feet
|
1 baths 3 beds |
$49,900
|
show details |

|
#6
Napolean Rd
Marion, IL 62959
|
920 sq. feet
|
2 baths 3 beds |
show details | |

|
#7
Clay St
Murphysboro, IL 62966
|
1,822 sq. feet
|
1 baths 4 beds |
show details | |

|
#8
N 11th St
Murphysboro, IL 62966
|
1,258 sq. feet
|
2 baths 3 beds |
show details | |

|
#9
S T. Road
Mulkeytown, IL 62865
|
1,823 sq. feet
|
1 baths 3 beds |
show details | |

|
#10
E Saint Louis St
West Frankfort, IL 62896
|
1,705 sq. feet
|
2 baths 4 beds |
show details |
| Photo | Address | Area | Beds / Baths | Price | Details |
|---|---|---|---|---|---|

|
#11
N Emma St
Christopher, IL 62822
|
- sq. feet
|
- baths - beds |
$19,900
|
show details |

|
#12
N Division St
Carterville, IL 62918
|
- sq. feet
|
- baths - beds |
$14,900
|
show details |

|
#13
N Division St
Carterville, IL 62918
|
1,442 sq. feet
|
1 baths 3 beds |
show details | |

|
#14
E 7th St
West Frankfort, IL 62896
|
- sq. feet
|
2 baths 3 beds |
show details | |

|
#15
W Rigdon St
Carbondale, IL 62901
|
1,215 sq. feet
|
2 baths 3 beds |
show details | |

|
#16
W Tyler St
Herrin, IL 62948
|
1,120 sq. feet
|
1 baths 2 beds |
show details | |

|
#17
Court H
Herrin, IL 62948
|
1,024 sq. feet
|
1 baths 3 beds |
show details | |

|
#18
E Creekwood Dr
Carbondale, IL 62902
|
1,588 sq. feet
|
3 baths 3 beds |
show details | |

|
#19
Roberts Rd
Marion, IL 62959
|
- sq. feet
|
2 baths 3 beds |
show details | |

|
#20
S 20th St
Murphysboro, IL 62966
|
- sq. feet
|
1 baths 5 beds |
show details |
| Photo | Address | Area | Beds / Baths | Price | Details |
|---|---|---|---|---|---|

|
#21
N Horn St
West Frankfort, IL 62896
|
- sq. feet
|
- baths - beds |
$19,900
|
show details |

|
#22
N Adams St
West Frankfort, IL 62896
|
- sq. feet
|
- baths - beds |
$3,400
|
show details |

|
#23
W Ray Ave
Christopher, IL 62822
|
- sq. feet
|
1 baths 2 beds |
show details | |

|
#24
Fawn Dr
Marion, IL 62959
|
1,671 sq. feet
|
- baths - beds |
show details | |

|
#25
Stotlar Rd
Marion, IL 62959
|
- sq. feet
|
- baths - beds |
show details | |

|
#26
W Main St # 81
Marion, IL 62959
|
- sq. feet
|
- baths - beds |
show details | |

|
#27
W Broadway Blvd
Johnston City, IL 62951
|
- sq. feet
|
- baths - beds |
show details | |

|
#28
Bevard St
Carterville, IL 62918
|
- sq. feet
|
- baths - beds |
show details | |

|
#29
W 5th St
Johnston City, IL 62951
|
- sq. feet
|
- baths - beds |
show details | |

|
#30
W 5th St
Johnston City, IL 62951
|
- sq. feet
|
- baths - beds |
show details |
| Photo | Address | Area | Beds / Baths | Price | Details |
|---|---|---|---|---|---|

|
#31
State Highway 149
West Frankfort, IL 62896
|
- sq. feet
|
- baths - beds |
show details | |

|
#32
W Cherry St
Marion, IL 62959
|
- sq. feet
|
- baths - beds |
show details | |

|
#33
Benton Ave
Johnston City, IL 62951
|
- sq. feet
|
- baths - beds |
show details | |

|
#34
Red Row
Marion, IL 62959
|
- sq. feet
|
- baths - beds |
show details | |

|
#35
E Board St
Elkville, IL 62932
|
- sq. feet
|
- baths - beds |
show details | |

|
#36
Gass St
West Frankfort, IL 62896
|
- sq. feet
|
- baths - beds |
show details | |

|
#37
N Van Buren St
Marion, IL 62959
|
- sq. feet
|
- baths - beds |
show details | |

|
#38
Melanie Ln Apt H
Marion, IL 62959
|
- sq. feet
|
- baths - beds |
show details | |

|
#39
Christian Ct
Carterville, IL 62918
|
- sq. feet
|
- baths - beds |
show details | |

|
#40
Darren Dr
Marion, IL 62959
|
- sq. feet
|
- baths - beds |
show details |
| Photo | Address | Area | Beds / Baths | Price | Details |
|---|---|---|---|---|---|

|
#41
New Era Rd
Murphysboro, IL 62966
|
- sq. feet
|
- baths - beds |
show details | |

|
#42
Jenni Ln
Carbondale, IL 62901
|
- sq. feet
|
- baths - beds |
show details | |

|
#43
Circus St
Herrin, IL 62948
|
- sq. feet
|
- baths - beds |
show details | |

|
#44
Chateau Rd # 12
Carbondale, IL 62901
|
- sq. feet
|
- baths - beds |
show details | |

|
#45
N Main St
Royalton, IL 62983
|
- sq. feet
|
- baths - beds |
show details | |

|
#46
Phillips Rd
Carbondale, IL 62902
|
- sq. feet
|
- baths - beds |
show details | |

|
#47
N Main St
Royalton, IL 62983
|
- sq. feet
|
- baths - beds |
show details | |

|
#48
N Helen St
Carbondale, IL 62901
|
- sq. feet
|
- baths - beds |
show details | |

|
#49
S James St
Carbondale, IL 62901
|
- sq. feet
|
- baths - beds |
show details | |

|
Check over 1 million property listings on Foreclosure.com!
|
browse all offers | |||

Latest news about housing in Cambria, IL collected exclusively by city-data.com from local newspapers, TV, and radio stations

 | Potential move to Carbondale.. info appreciated :) (29 replies) |
| What do you think the next suburb to experience white flight will be? (275 replies) |
| RTA survey (3 replies) |
| Chicago Segregation Worries Mixed Race (149 replies) |
Median year apartment built: 1997
Household type by relationship:
Households: 1,223- Male householders: 240 (79 living alone), Female householders: 389 (152 living alone)
204 spouses (204 opposite-sex spouses), 38 unmarried partners, (38 opposite-sex unmarried partners), 278 children (261 natural, 0 adopted, 16 stepchildren), 11 grandchildren, 2 brothers or sisters, 0 parents, 0 foster children, 49 other relatives, 6 non-relatives
Size of family households: 288 2-persons, 48 3-persons, 25 4-persons, 6 5-persons, 17 6-persons.
Size of nonfamily households: 243 1-person, 7 2-persons.
79 married couples with children.
121 single-parent households (34 men, 87 women).
93.3% of residents of Cambria speak English at home.
5.5% of residents speak Spanish at home (48% speak English very well, 52% don't speak English at all).
0.5% of residents speak Asian or Pacific Island language at home (100% speak English very well).
Foreign born population: 117 (9.6%)
(29.9% of them are naturalized citizens)
| Here: | 5.9 |
| State: | 6.4 |
| Here: | 4.5 |
| State: | 4.1 |
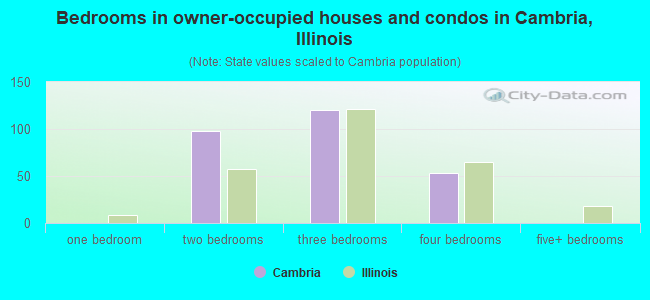
- Bedrooms in owner-occupied houses and condos in Cambria, Illinois
- 0no bedroom
- 01 bedroom
- 982 bedrooms
- 1203 bedrooms
- 534 bedrooms
- 05+ bedrooms
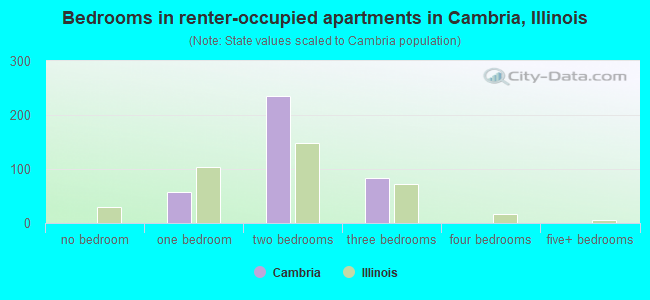
- Bedrooms in renter-occupied apartments in Cambria, Illinois
- 0no bedroom
- 581 bedroom
- 2352 bedrooms
- 843 bedrooms
- 04 bedrooms
- 05+ bedrooms
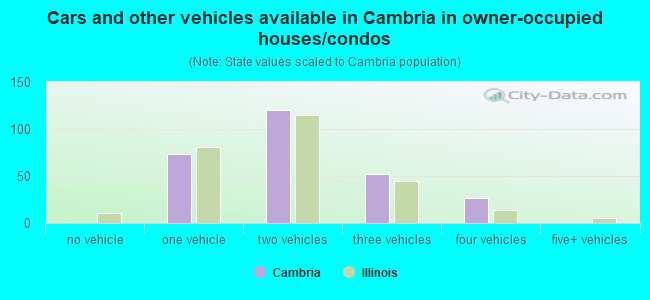
- Cars and other vehicles available in Cambria in owner-occupied houses/condos
- 0no vehicle
- 731 vehicle
- 1202 vehicles
- 523 vehicles
- 274 vehicles
- 05+ vehicles
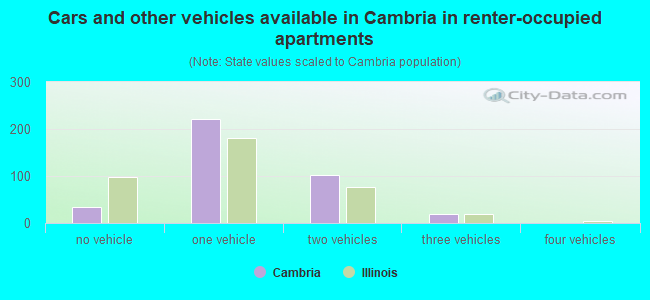
- Cars and other vehicles available in Cambria in renter-occupied apartments
- 34no vehicle
- 2221 vehicle
- 1022 vehicles
- 193 vehicles
- 04 vehicles
- 05+ vehicles
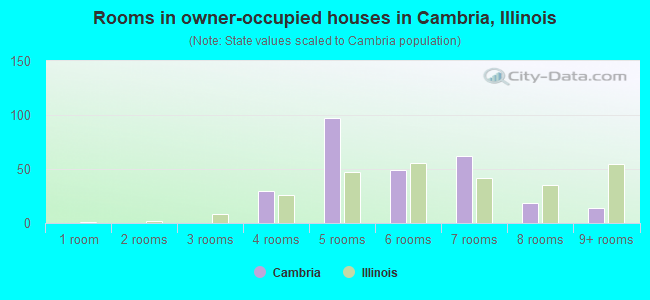
- Rooms in owner-occupied houses in Cambria, Illinois
- 01 room
- 02 rooms
- 03 rooms
- 304 rooms
- 975 rooms
- 496 rooms
- 627 rooms
- 188 rooms
- 149+ rooms
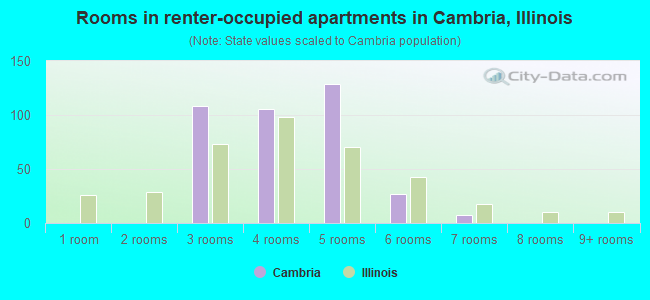
- Rooms in renter-occupied apartments in Cambria, Illinois
- 01 room
- 02 rooms
- 1083 rooms
- 1064 rooms
- 1295 rooms
- 276 rooms
- 77 rooms
- 08 rooms
- 09+ rooms
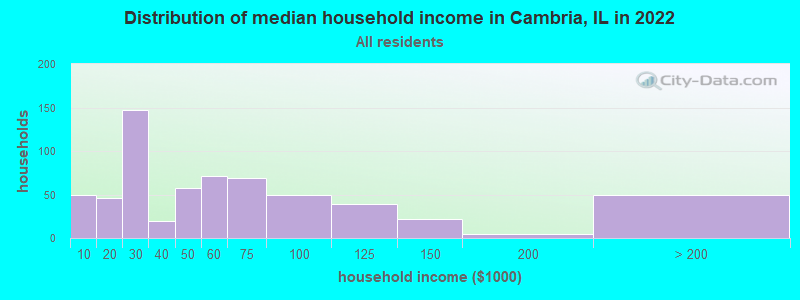
Cambria, IL household income distribution

- 49Less than $10,000
- 46$10,000 to $19,999
- 147$20,000 to $29,999
- 20$30,000 to $39,999
- 57$40,000 to $49,999
- 71$50,000 to $59,999
- 69$60,000 to $74,999
- 50$75,000 to $99,999
- 39$100,000 to $124,999
- 22$125,000 to $149,999
- 5$150,000 to $199,999
- 49$200,000 or more
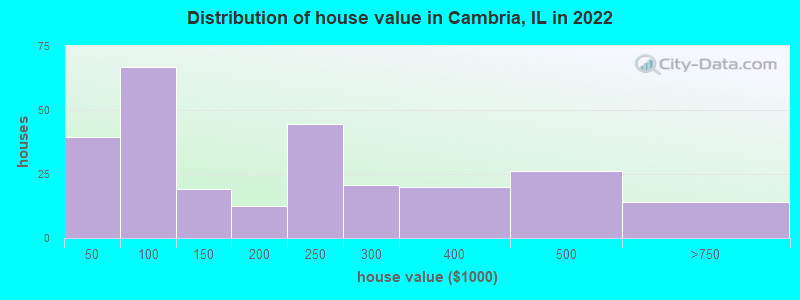
Home value of owner - occupied houses in 2022 in Cambria, IL
-
- 9$15,000 to $19,999
- 12$20,000 to $24,999
- 3$25,000 to $29,999
- 7$35,000 to $39,999
- 6$40,000 to $49,999
- 22$50,000 to $59,999
- 15$70,000 to $79,999
- 11$80,000 to $89,999
- 10$90,000 to $99,999
- 7$100,000 to $124,999
- 11$125,000 to $149,999
- 9$150,000 to $174,999
- 3$175,000 to $199,999
- 44$200,000 to $249,999
- 20$250,000 to $299,999
- 19$300,000 to $399,999
- 26$400,000 to $499,999
- 14$500,000 to $749,999
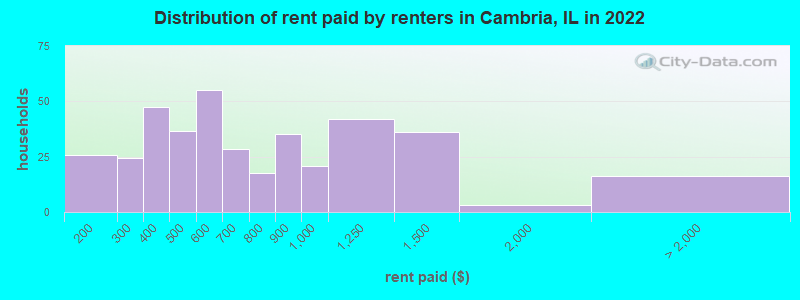
Rent paid by renters in 2022 in Cambria, IL
-
- 25$100 to $149
- 2$200 to $249
- 22$250 to $299
- 9$300 to $349
- 37$350 to $399
- 30$400 to $449
- 5$450 to $499
- 55$550 to $599
- 17$600 to $649
- 10$650 to $699
- 7$700 to $749
- 9$750 to $799
- 35$800 to $899
- 20$900 to $999
- 42$1,000 to $1,249
- 36$1,250 to $1,499
- 3$1,500 to $1,999
- 16No cash rent
Percentage of workers working in this county: 60.9%
Number of people working at home: 34 (5.9% of all workers)
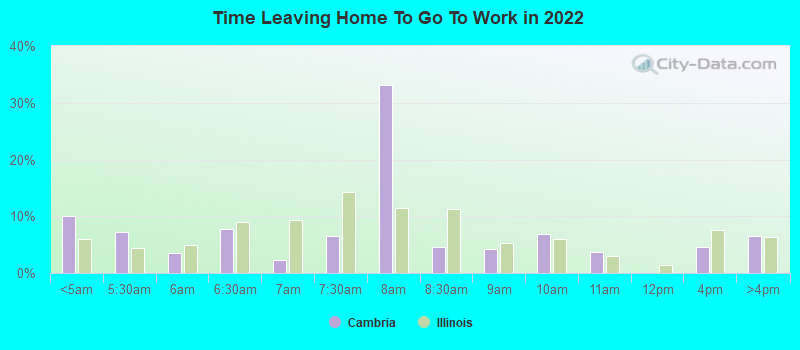
Travel time to work (commute)
- Less than 5 minutes: 12
- 5 to 9 minutes: 44
- 10 to 14 minutes: 107
- 15 to 19 minutes: 198
- 20 to 24 minutes: 94
- 25 to 29 minutes: 32
- 30 to 34 minutes: 30
- 35 to 39 minutes: 6
- 40 to 44 minutes: 0
- 45 to 59 minutes: 26
- 60 to 89 minutes: 0
- 90 or more minutes: 4
Means of transportation to work:
- Drove a car alone: 541 (88.0%)
- Carpooled: 52 (8.5%)
- Bus or trolley bus: 2 (0.3%)
- Walked: 10 (1.6%)
- Other means: 4 (0.7%)
- Worked at home: 6 (1.0%)
- Unemployment by race in 2022
- Unemployment rate for White non-Hispanic residents
- 11.4%Males
- 1.2%Females
- Unemployment rate for Black residents
- 11.9%Males
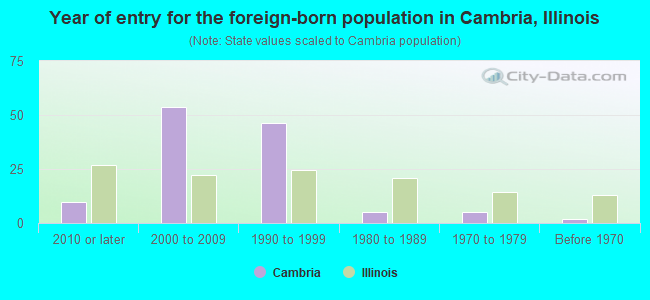
- Year of entry for the foreign-born population in Cambria, Illinois
- 102010 or later
- 542000 to 2009
- 461990 to 1999
- 51980 to 1989
- 51970 to 1979
- 2Before 1970
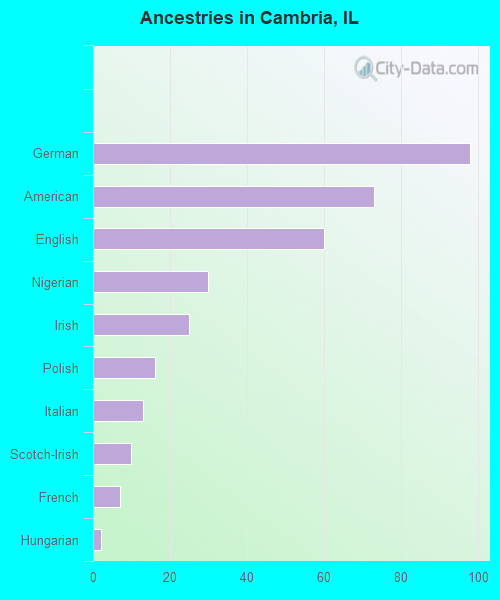
First ancestries reported:
- German: 98 (18.8%)
- American: 73 (14.0%)
- English: 60 (11.5%)
- Nigerian: 30 (5.8%)
- Irish: 25 (4.8%)
- Polish: 16 (3.1%)
- Italian: 13 (2.5%)
- Scotch-Irish: 10 (1.9%)
- French: 7 (1.3%)
- Hungarian: 2 (0.4%)
Most common places of birth for foreign-born residents (%):
| Cambria: | 51.7% (61) |
| Illinois: | 34.7% (626,958) |
| Cambria: | 26.3% (31) |
| Illinois: | 1.2% (21,186) |
| Cambria: | 12.7% (15) |
| Illinois: | 4.1% (74,364) |
| Cambria: | 4.2% (5) |
| Illinois: | 5.2% (93,003) |
| Cambria: | 3.4% (4) |
| Illinois: | 0.1% (1,432) |
Place of birth for U.S.-born residents:
- This state: 794
- Other state: 318
- Northeast: 15
- Midwest: 181
- South: 112
- West: 4
81.5% of Cambria residents lived in the same house 1 years ago.
Out of people who lived in different houses, 33.8% lived in this county.
Out of people who lived in different counties, 14.2% lived in Illinois.
| Cambria: | 81.5% |
| State average: | 88.3% |
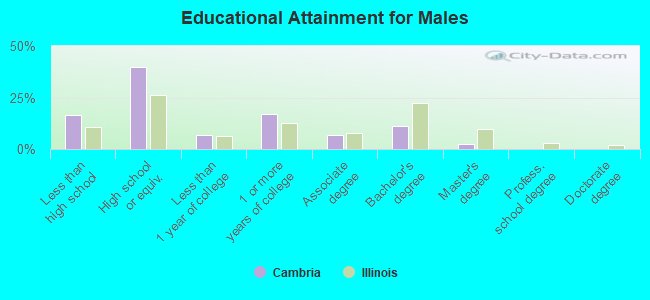
Education attainment for males 25 years and older:
- No schooling: 0
- Nursery to 4th grade: 0
- 5th and 6th grade: 0
- 7th and 8th grade: 18
- 9th grade: 3
- 10th grade: 2
- 11th grade: 33
- 12th grade, no diploma: 3
- High school graduate (or equivalency): 143
- Less than 1 year of college: 24
- Some college more than 1 year, no degree: 61
- Associate degree: 24
- Bachelor's degree: 41
- Master's degree: 8
- Professional school degree: 0
- Doctorate degree: 0
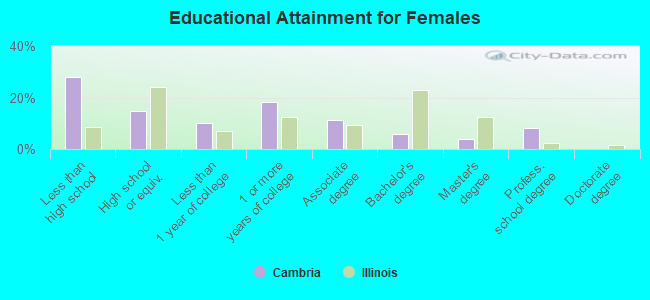
Education attainment for females 25 years and older:
- No schooling: 0
- Nursery to 4th grade: 0
- 5th and 6th grade: 59
- 7th and 8th grade: 18
- 9th grade: 0
- 10th grade: 18
- 11th grade: 52
- 12th grade, no diploma: 17
- High school graduate (or equivalency): 87
- Less than 1 year of college: 59
- Some college more than 1 year, no degree: 107
- Associate degree: 67
- Bachelor's degree: 35
- Master's degree: 23
- Professional school degree: 47
- Doctorate degree: 1
Housing units in structures:
- One, detached: 311
- One, attached: 86
- Two: 129
- 3 or 4: 64
- Mobile homes: 145
Median worth of mobile homes: $28,960
Housing units lacking complete kitchen facilities in 2022: 1.0%
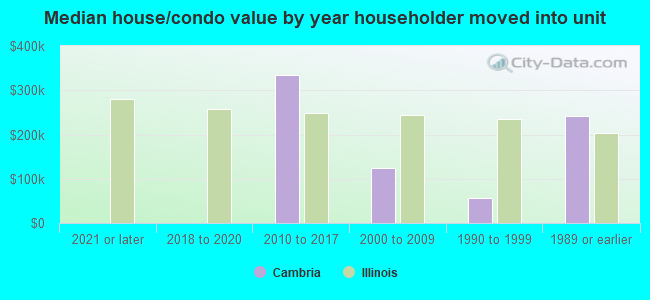
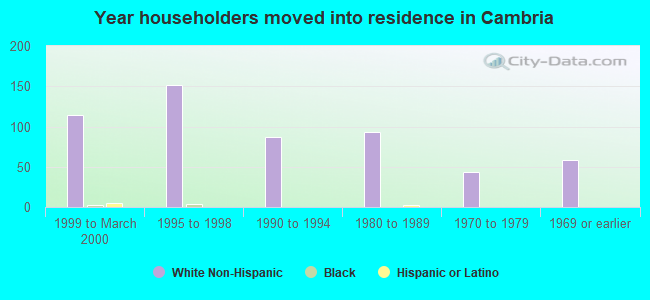
House/condo owner moved in on average 10 years ago
Renter moved in on average 2 years ago
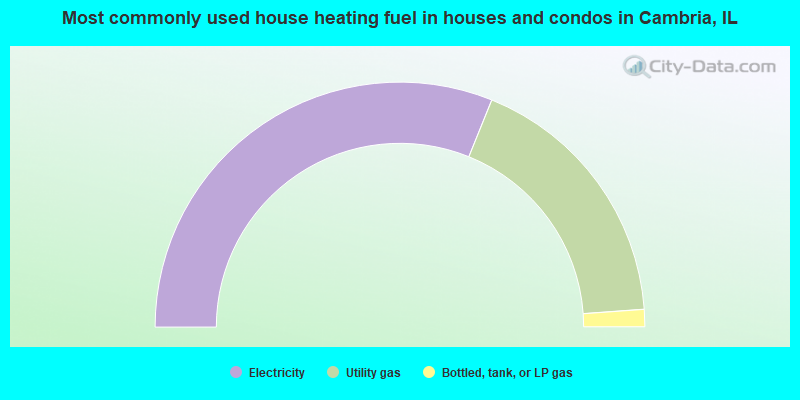
- 62.3%Electricity
- 35.5%Utility gas
- 2.3%Bottled, tank, or LP gas
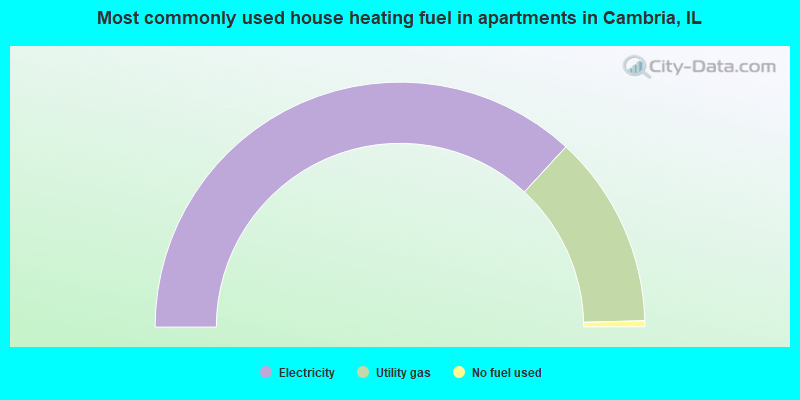
- 73.7%Electricity
- 25.5%Utility gas
- 0.8%No fuel used
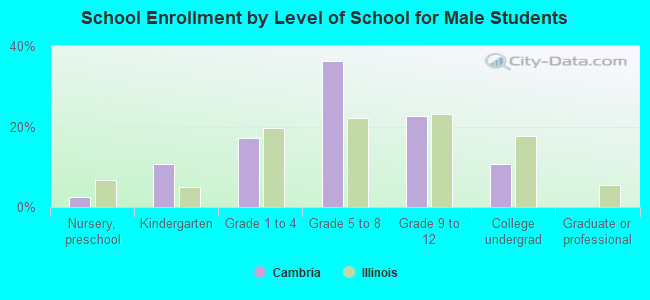
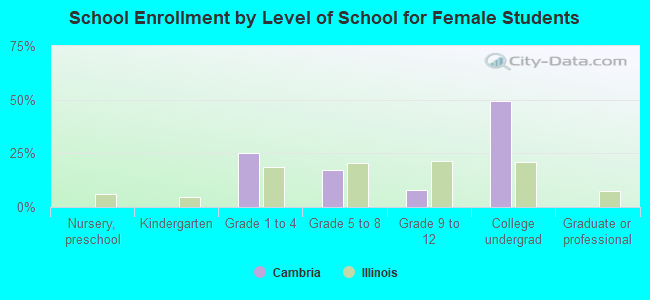
Private vs. public school enrollment:
| Here: | 1.9% |
| Illinois: | 13.3% |
| Here: | 0.0% |
| Illinois: | 9.9% |
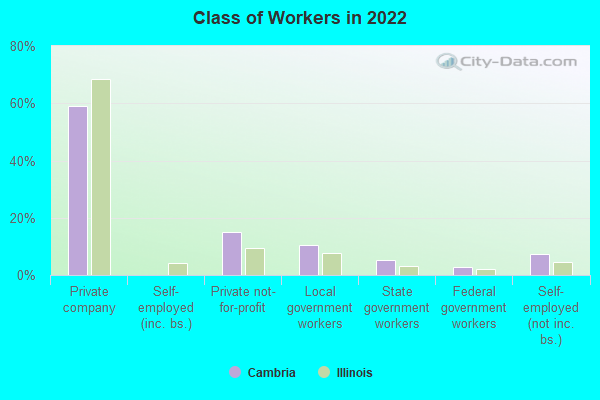
| Here: | 41.2% |
| Illinois: | 27.4% |