Housing density: 2,632 houses/condos per square mile
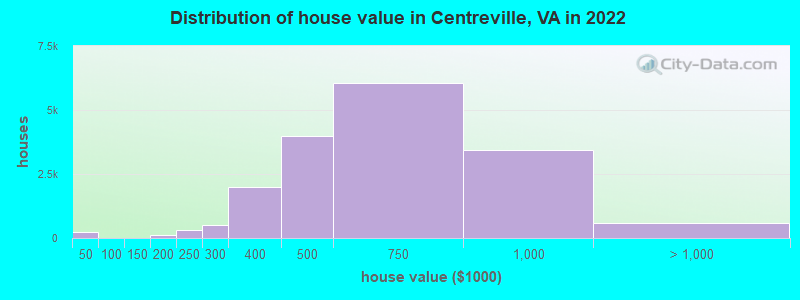
Median price asked for vacant for-sale houses and condos in 2022: $648,070.
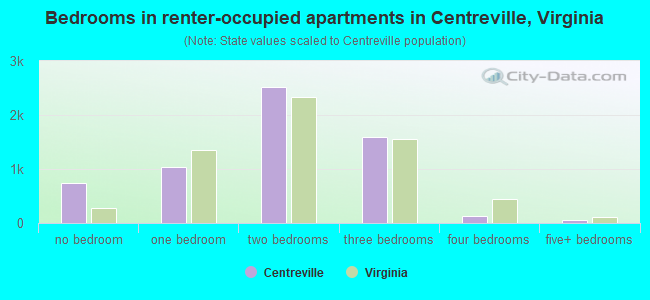
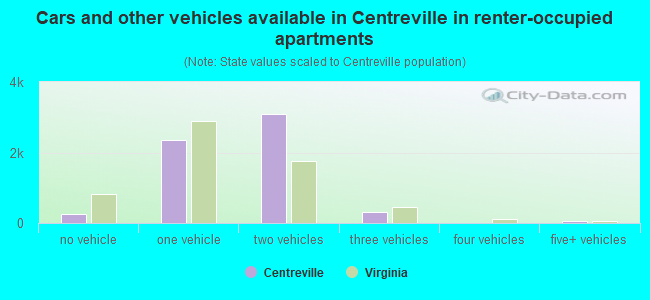
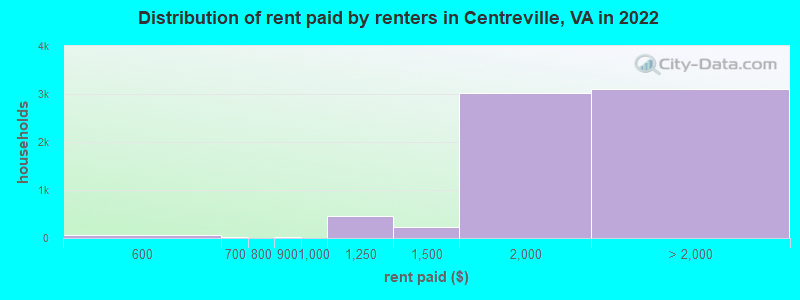
Median contract rent in 2022: $1,983 (lower quartile is $1,693, upper quartile is over $2,000)
Median rent asked for vacant for-rent units in 2022: $2,231
Median gross rent in Centreville, VA in 2022: over $2,000
Housing units in Centreville with a mortgage: 14,595 (981 second mortgage, 46 home equity loan, 728 both second mortgage and home equity loan) Houses without a mortgage: 203
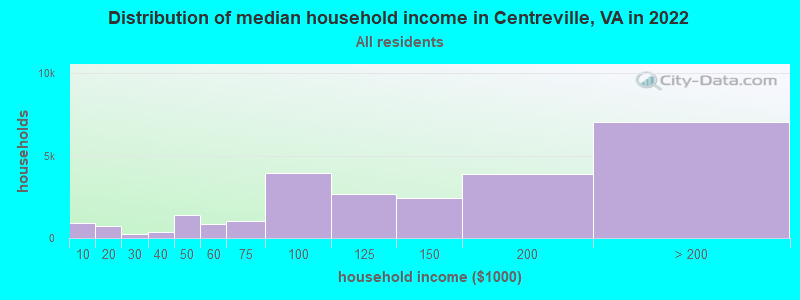
Median household income for houses/condos with a mortgage: $153,114
Median household income for apartments without a mortgage: $161,056
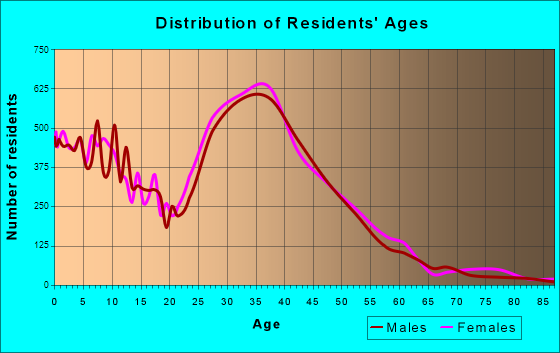
Size of family households: 7,465 2-persons, 5,395 3-persons, 3,432 4-persons, 1,864 5-persons, 202 6-persons, 388 7-or-more-persons.
Size of nonfamily households: 5,256 1-person, 1,349 2-persons, 47 3-persons.
12,818 married couples with children.
2,400 single-parent households (563 men, 1,837 women).
55.7% of residents of Centreville speak English at home.
11.9% of residents speak Spanish at home (68% speak English very well, 19% speak English well, 11% speak English not well, 2% don't speak English at all).
6.8% of residents speak other Indo-European language at home (75% speak English very well, 19% speak English well, 5% speak English not well, 1% don't speak English at all).
19.4% of residents speak Asian or Pacific Island language at home (52% speak English very well, 25% speak English well, 20% speak English not well, 2% don't speak English at all).
5.0% of residents speak other language at home (70% speak English very well, 18% speak English well, 7% speak English not well, 5% don't speak English at all).
Foreign born population: 23,195 (33.4%)
(80.1% of them are naturalized citizens)
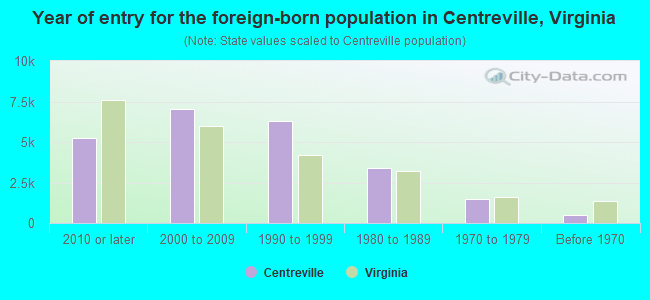
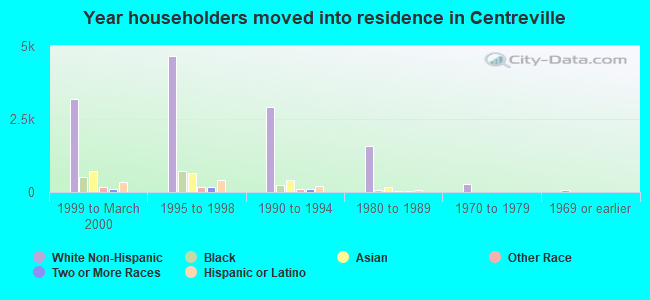
Year of entry for the foreign-born population in Centreville, Virginia
5,2712010 or later
7,0422000 to 2009
6,2701990 to 1999
3,3651980 to 1989
1,4981970 to 1979
499Before 1970
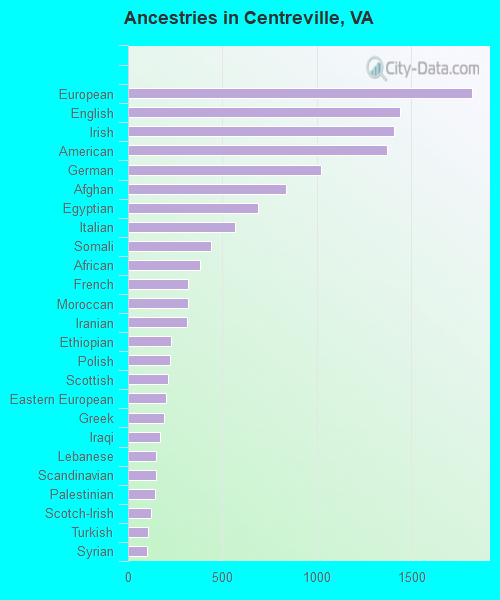
First ancestries reported:
European: 1,821 (4.6%)
English: 1,439 (3.6%)
Irish: 1,410 (3.5%)
American: 1,371 (3.4%)
German: 1,021 (2.6%)
Afghan: 835 (2.1%)
Egyptian: 691 (1.7%)
Italian: 565 (1.4%)
Somali: 440 (1.1%)
African: 383 (1.0%)
French: 320 (0.8%)
Moroccan: 319 (0.8%)
Iranian: 315 (0.8%)
Ethiopian: 228 (0.6%)
Polish: 224 (0.6%)
Scottish: 210 (0.5%)
Eastern European: 199 (0.5%)
Greek: 190 (0.5%)
Iraqi: 171 (0.4%)
Lebanese: 148 (0.4%)
Scandinavian: 146 (0.4%)
Palestinian: 142 (0.4%)
Scotch-Irish: 120 (0.3%)
Turkish: 106 (0.3%)
Syrian: 102 (0.3%)
French Canadian: 102 (0.3%)
British: 102 (0.3%)
Sierra Leonean: 95 (0.2%)
South African: 94 (0.2%)
Armenian: 86 (0.2%)
Ghanaian: 78 (0.2%)
Arab: 68 (0.2%)
Northern European: 67 (0.2%)
Ukrainian: 62 (0.2%)
Russian: 60 (0.2%)
Jamaican: 59 (0.1%)
Sudanese: 56 (0.1%)
Finnish: 56 (0.1%)
Dutch: 44 (0.1%)
Portuguese: 42 (0.1%)
Yugoslavian: 36 (0.09%)
Romanian: 31 (0.08%)
Croatian: 31 (0.08%)
Belgian: 31 (0.08%)
Serbian: 28 (0.07%)
Norwegian: 27 (0.07%)
Hungarian: 27 (0.07%)
Welsh: 20 (0.05%)
Czech: 18 (0.05%)
Austrian: 18 (0.05%)
Haitian: 18 (0.05%)
Kenyan: 17 (0.04%)
Nigerian: 17 (0.04%)
Swedish: 17 (0.04%)
Carpatho Rusyn: 16 (0.04%)
Alsatian: 16 (0.04%)
Jordanian: 12 (0.03%)
Lithuanian: 12 (0.03%)
British West Indian: 10 (0.03%)
Estonian: 9 (0.02%)
Trinidadian and Tobagonian: 9 (0.02%)
Slovak: 8 (0.02%)
Israeli: 8 (0.02%)
Danish: 7 (0.02%)
Canadian: 6 (0.02%)
German Russian: 6 (0.02%)
Pennsylvania German: 5 (0.01%)
Most common places of birth for foreign-born residents (%):
Korea
Centreville:
25.9% (6,641)
Virginia:
4.9% (52,857)
India
Centreville:
9.0% (2,294)
Virginia:
9.0% (97,830)
Peru
Centreville:
4.8% (1,218)
Virginia:
2.4% (26,366)
Vietnam
Centreville:
4.7% (1,200)
Virginia:
4.2% (45,750)
El Salvador
Centreville:
3.7% (940)
Virginia:
9.9% (107,534)
Afghanistan
Centreville:
3.6% (930)
Virginia:
1.8% (19,426)
Guatemala
Centreville:
3.3% (836)
Virginia:
3.3% (35,938)
China, excluding Hong Kong and Taiwan
Centreville:
3.1% (801)
Virginia:
3.9% (42,989)
Philippines
Centreville:
3.0% (757)
Virginia:
4.8% (52,629)
Bolivia
Centreville:
2.3% (583)
Virginia:
2.4% (25,722)
Egypt
Centreville:
2.2% (554)
Virginia:
0.9% (9,672)
Honduras
Centreville:
2.1% (532)
Virginia:
3.0% (32,892)
Nepal
Centreville:
1.8% (465)
Virginia:
0.9% (9,695)
Bangladesh
Centreville:
1.7% (445)
Virginia:
1.1% (12,049)
Ghana
Centreville:
1.7% (429)
Virginia:
1.6% (17,346)
Place of birth for U.S.-born residents:
This state: 23,410
Other state: 19,682
Northeast: 6,394
Midwest: 3,270
South: 7,262
West: 2,756
88.9% of Centreville residents lived in the same house 1 years ago. Out of people who lived in different houses, 27.6% lived in this county. Out of people who lived in different counties, 69.1% lived in Virginia.
Centreville:
88.9%
State average:
86.6%
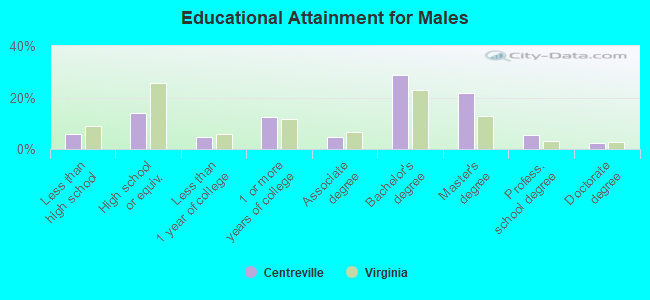
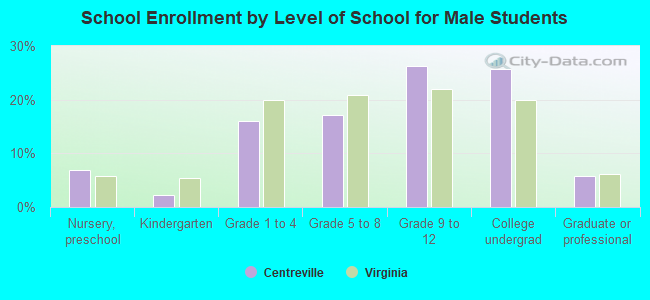
Education attainment for males 25 years and older:
No schooling: 217
Nursery to 4th grade: 0
5th and 6th grade: 425
7th and 8th grade: 111
9th grade: 82
10th grade: 98
11th grade: 117
12th grade, no diploma: 305
High school graduate (or equivalency): 3,320
Less than 1 year of college: 1,136
Some college more than 1 year, no degree: 2,961
Associate degree: 1,125
Bachelor's degree: 6,760
Master's degree: 5,093
Professional school degree: 1,280
Doctorate degree: 514
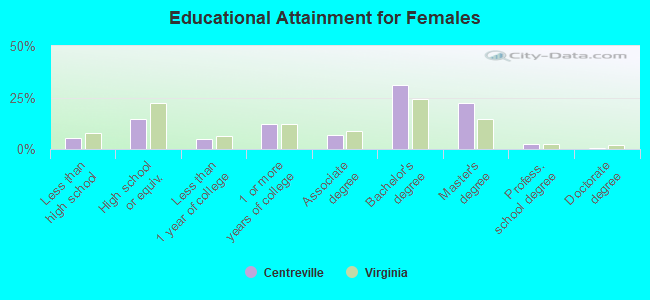
Education attainment for females 25 years and older:
No schooling: 292
Nursery to 4th grade: 0
5th and 6th grade: 184
7th and 8th grade: 113
9th grade: 261
10th grade: 0
11th grade: 291
12th grade, no diploma: 187
High school graduate (or equivalency): 3,694
Less than 1 year of college: 1,199
Some college more than 1 year, no degree: 3,030
Associate degree: 1,710
Bachelor's degree: 7,891
Master's degree: 5,684
Professional school degree: 570
Doctorate degree: 100
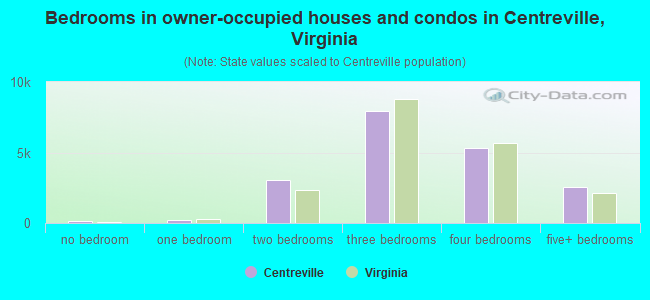
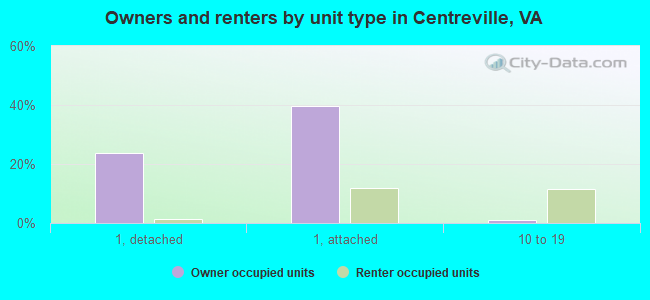
Housing units in structures:
One, detached: 9,318
One, attached: 10,960
Two: 519
3 or 4: 408
5 to 9: 1,372
10 to 19: 2,271
20 to 49: 156
50 or more: 609
Housing units lacking complete plumbing facilities in 2022: 0.5%
Housing units lacking complete kitchen facilities in 2022: 0.4%
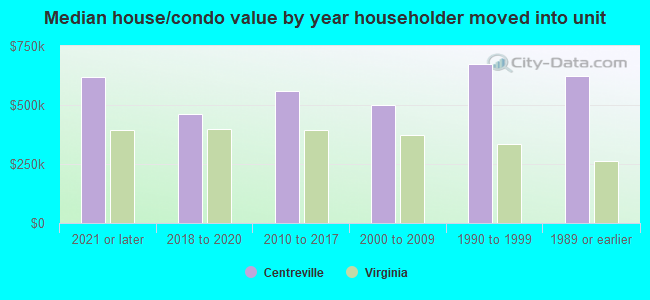
House/condo owner moved in on average 10 years ago