Charlestown, IN (Indiana) Houses and Residents
| Charlestown: | $206,877 |
| Indiana: | $208,700 |
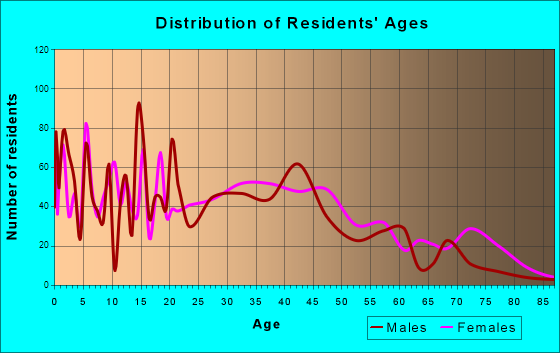
Total population: 8,054 (Urban population: 5,988 (all inside urban clusters), Rural population: 50 (all nonfarm))
Houses: 3,491 (3,200 occupied: 2,400 owner occupied, 894 renter occupied)
| % of renters here: | 27% |
| State: | 29% |
Housing density: 1,497 houses/condos per square mile
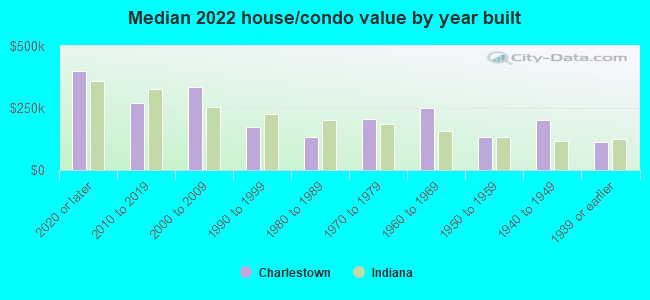
Median price asked for vacant for-sale houses and condos in 2022: $350,816.
Median contract rent in 2022: $584 (lower quartile is $360, upper quartile is $971)
Median rent asked for vacant for-rent units in 2022: $5,143
Median gross rent in Charlestown, IN in 2022: $768
Housing units in Charlestown with a mortgage: 1,768 (70 second mortgage, 0 home equity loan, 75 both second mortgage and home equity loan)
Houses without a mortgage: 255
Median household income for houses/condos with a mortgage: $89,300
Median household income for apartments without a mortgage: $48,259
Median monthly housing costs: $968
Compare current foreclosures in Charlestown, IN:
| Photo | Address | Area | Beds / Baths | Price | Details |
|---|---|---|---|---|---|

|
#1
Salem Noble Rd
Charlestown, IN 47111
|
1,212 sq. feet
|
1 baths 3 beds |
show details | |

|
#2
Hillside Cir
Charlestown, IN 47111
|
1,322 sq. feet
|
2 baths 3 beds |
show details | |

|
#3
Lisa Ln
Charlestown, IN 47111
|
1,102 sq. feet
|
1 baths 3 beds |
show details | |

|
#4
Main St
Charlestown, IN 47111
|
1,264 sq. feet
|
1 baths 3 beds |
show details | |

|
#5
Lisa Ln
Charlestown, IN 47111
|
875 sq. feet
|
1 baths 2 beds |
show details | |

|
#6
Sunset Loop
Charlestown, IN 47111
|
1,472 sq. feet
|
2 baths 3 beds |
show details | |

|
#7
Saddle Dr
Charlestown, IN 47111
|
1,377 sq. feet
|
1 baths 3 beds |
show details | |

|
#8
Oriole Dr
Charlestown, IN 47111
|
959 sq. feet
|
1 baths 3 beds |
show details | |

|
#9
Bohart Ln
Charlestown, IN 47111
|
750 sq. feet
|
2 baths 2 beds |
show details | |

|
#10
Crescent Rd
Charlestown, IN 47111
|
616 sq. feet
|
2 baths 4 beds |
show details |
| Photo | Address | Area | Beds / Baths | Price | Details |
|---|---|---|---|---|---|

|
#11
Larue Ct
Charlestown, IN 47111
|
1,152 sq. feet
|
2 baths 3 beds |
show details | |

|
#12
Bohart Ln
Charlestown, IN 47111
|
1,080 sq. feet
|
1 baths 3 beds |
show details | |

|
#13
Monroe St
Charlestown, IN 47111
|
1,123 sq. feet
|
1 baths 2 beds |
show details | |

|
#14
Orchard Walk
Charlestown, IN 47111
|
2,645 sq. feet
|
3 baths 3 beds |
show details | |

|
#15
Bohart Ln
Charlestown, IN 47111
|
1,388 sq. feet
|
1 baths 3 beds |
show details | |

|
#16
Hidden River Trce
Charlestown, IN 47111
|
2,402 sq. feet
|
2 baths 3 beds |
show details | |

|
#17
Lake Forest Dr
Charlestown, IN 47111
|
2,176 sq. feet
|
2 baths 2 beds |
show details | |

|
#18
Aberdeen Ln
Charlestown, IN 47111
|
1,842 sq. feet
|
2 baths 3 beds |
show details | |

|
#19
Greenbrier Ct
Charlestown, IN 47111
|
1,872 sq. feet
|
2 baths 3 beds |
show details | |

|
#20
Whitsett Way
Charlestown, IN 47111
|
1,026 sq. feet
|
1 baths 3 beds |
show details |
| Photo | Address | Area | Beds / Baths | Price | Details |
|---|---|---|---|---|---|

|
#21
Rosewood Dr
Charlestown, IN 47111
|
- sq. feet
|
2 baths 3 beds |
show details | |

|
#22
Brentview Ct
Charlestown, IN 47111
|
1,300 sq. feet
|
1 baths - beds |
show details | |

|
#23
Hidden River Trce
Charlestown, IN 47111
|
3,200 sq. feet
|
3 baths - beds |
show details | |

|
#24
Caleigh Dr
Charlestown, IN 47111
|
1,575 sq. feet
|
2 baths - beds |
show details | |

|
#25
Jackson Way
Charlestown, IN 47111
|
- sq. feet
|
- baths - beds |
show details | |

|
#26
21st Century Dr
Charlestown, IN 47111
|
- sq. feet
|
- baths - beds |
show details | |

|
#27
Woodridge Dr
Charlestown, IN 47111
|
- sq. feet
|
- baths - beds |
show details | |

|
#28
Hawthorne Gln
Charlestown, IN 47111
|
- sq. feet
|
- baths - beds |
show details | |

|
#29
Harmony Ln
Charlestown, IN 47111
|
- sq. feet
|
- baths - beds |
show details | |

|
#30
Harmony Ln
Charlestown, IN 47111
|
- sq. feet
|
- baths - beds |
show details |
| Photo | Address | Area | Beds / Baths | Price | Details |
|---|---|---|---|---|---|

|
#31
Woodridge Dr
Charlestown, IN 47111
|
- sq. feet
|
- baths - beds |
show details | |

|
#32
Whitsett Way
Charlestown, IN 47111
|
- sq. feet
|
- baths - beds |
show details | |

|
#33
Main St # 214
Charlestown, IN 47111
|
- sq. feet
|
- baths - beds |
show details | |

|
#34
Broadmoor Ave
Charlestown, IN 47111
|
- sq. feet
|
- baths - beds |
show details | |

|
#35
Harmony Ln
Charlestown, IN 47111
|
- sq. feet
|
- baths - beds |
show details | |

|
#36
Jillian Dr
Charlestown, IN 47111
|
- sq. feet
|
- baths - beds |
show details | |

|
#37
Harmony Cir
Charlestown, IN 47111
|
- sq. feet
|
- baths - beds |
show details | |

|
#38
Jackson Way
Charlestown, IN 47111
|
- sq. feet
|
- baths - beds |
show details | |

|
#39
Decker Ln
Charlestown, IN 47111
|
- sq. feet
|
- baths 3 beds |
show details | |

|
#40
Delta Dr
Charlestown, IN 47111
|
- sq. feet
|
- baths - beds |
show details |
| Photo | Address | Area | Beds / Baths | Price | Details |
|---|---|---|---|---|---|

|
#41
Farming Way
Charlestown, IN 47111
|
- sq. feet
|
- baths - beds |
show details | |

|
#42
Halcyon Rd
Charlestown, IN 47111
|
- sq. feet
|
- baths - beds |
show details | |

|
#43
Limestone Creek Dr
Charlestown, IN 47111
|
- sq. feet
|
- baths - beds |
show details | |

|
#44
Market St
Charlestown, IN 47111
|
- sq. feet
|
- baths 3 beds |
show details | |

|
#45
Miners Pt
Charlestown, IN 47111
|
- sq. feet
|
- baths - beds |
show details | |

|
#46
Kenwood Ave
Charlestown, IN 47111
|
- sq. feet
|
- baths - beds |
show details | |

|
#47
Main St
Charlestown, IN 47111
|
- sq. feet
|
- baths - beds |
show details | |

|
#48
Marion Martin Rd
Charlestown, IN 47111
|
- sq. feet
|
- baths - beds |
show details | |

|
#49
Poplar Dr
Charlestown, IN 47111
|
- sq. feet
|
- baths - beds |
show details | |

|
Check over 1 million property listings on Foreclosure.com!
|
browse all offers | |||

Latest news about housing in Charlestown, IN collected exclusively by city-data.com from local newspapers, TV, and radio stations


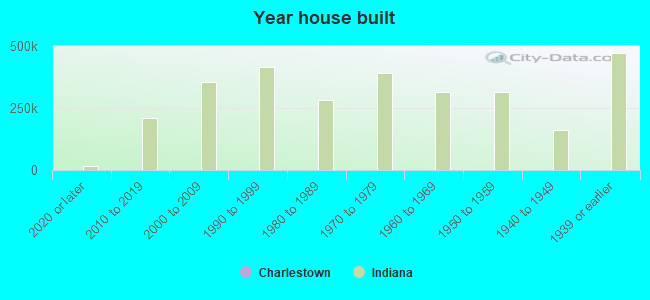
Median year apartment built: 1977
Household type by relationship:
Households: 8,166- Male householders: 1,491 (387 living alone), Female householders: 1,629 (530 living alone)
1,288 spouses (1,288 opposite-sex spouses), 357 unmarried partners, (357 opposite-sex unmarried partners), 2,641 children (2,179 natural, 17 adopted, 444 stepchildren), 151 grandchildren, 31 brothers or sisters, 16 parents, 11 foster children, 307 other relatives, 222 non-relatives
- In group quarters: 17
Size of family households: 917 2-persons, 610 3-persons, 294 4-persons, 101 5-persons, 145 6-persons, 18 7-or-more-persons.
Size of nonfamily households: 1,050 1-person, 177 2-persons.
618 married couples with children.
1,209 single-parent households (428 men, 781 women).
92.6% of residents of Charlestown speak English at home.
4.9% of residents speak Spanish at home (33% speak English very well, 17% speak English well, 47% speak English not well, 3% don't speak English at all).
1.0% of residents speak other Indo-European language at home (100% speak English very well).
0.4% of residents speak Asian or Pacific Island language at home (47% speak English very well, 53% speak English well).
1.1% of residents speak other language at home (100% speak English well).
Foreign born population: 225 (2.8%)
(36.4% of them are naturalized citizens)
| Here: | 5.8 |
| State: | 6.6 |
| Here: | 3.9 |
| State: | 4.3 |
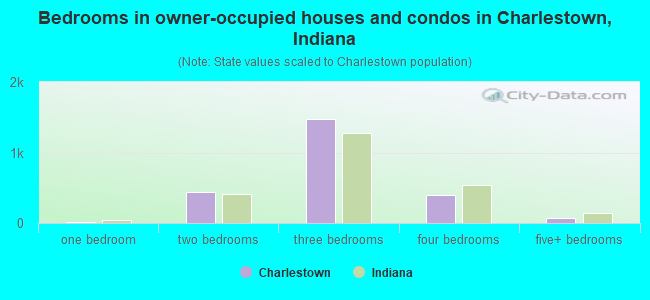
- Bedrooms in owner-occupied houses and condos in Charlestown, Indiana
- 0no bedroom
- 91 bedroom
- 4422 bedrooms
- 1,4733 bedrooms
- 4044 bedrooms
- 735+ bedrooms
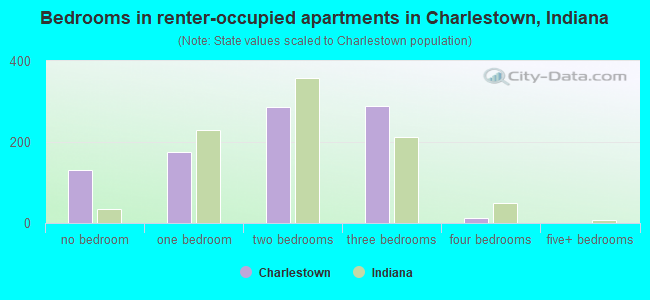
- Bedrooms in renter-occupied apartments in Charlestown, Indiana
- 130no bedroom
- 1761 bedroom
- 2872 bedrooms
- 2893 bedrooms
- 124 bedrooms
- 05+ bedrooms
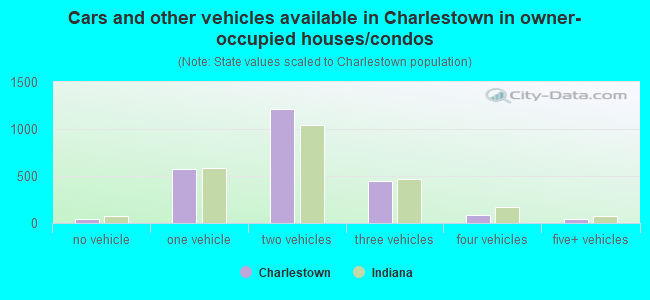
- Cars and other vehicles available in Charlestown in owner-occupied houses/condos
- 40no vehicle
- 5761 vehicle
- 1,2162 vehicles
- 4473 vehicles
- 844 vehicles
- 385+ vehicles
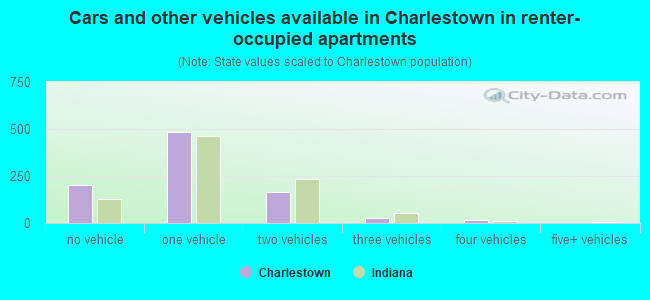
- Cars and other vehicles available in Charlestown in renter-occupied apartments
- 202no vehicle
- 4831 vehicle
- 1632 vehicles
- 293 vehicles
- 174 vehicles
- 05+ vehicles
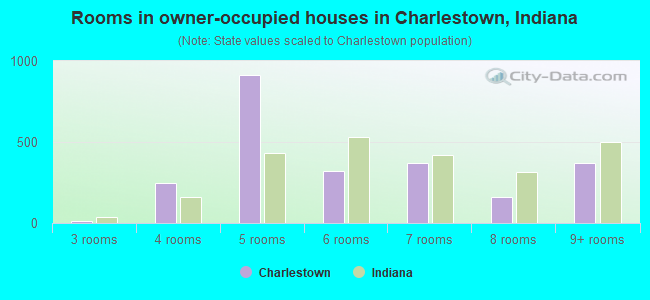
- Rooms in owner-occupied houses in Charlestown, Indiana
- 01 room
- 02 rooms
- 113 rooms
- 2484 rooms
- 9115 rooms
- 3246 rooms
- 3717 rooms
- 1638 rooms
- 3719+ rooms
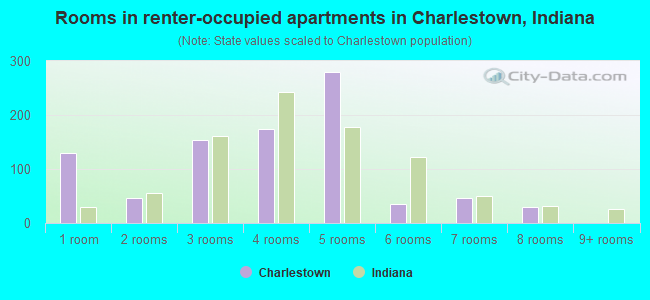
- Rooms in renter-occupied apartments in Charlestown, Indiana
- 1301 room
- 462 rooms
- 1533 rooms
- 1754 rooms
- 2795 rooms
- 366 rooms
- 467 rooms
- 298 rooms
- 09+ rooms
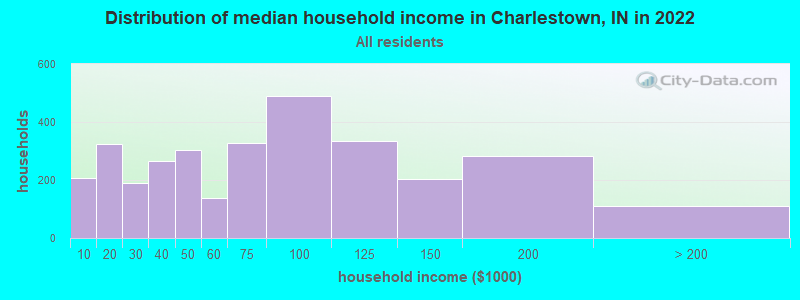
Charlestown, IN household income distribution

- 208Less than $10,000
- 323$10,000 to $19,999
- 190$20,000 to $29,999
- 267$30,000 to $39,999
- 302$40,000 to $49,999
- 139$50,000 to $59,999
- 327$60,000 to $74,999
- 489$75,000 to $99,999
- 333$100,000 to $124,999
- 202$125,000 to $149,999
- 282$150,000 to $199,999
- 109$200,000 or more
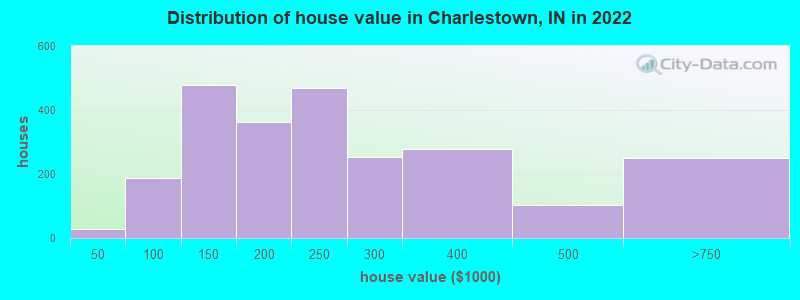
Home value of owner - occupied houses in 2022 in Charlestown, IN
-
- 10Less than $10,000
- 4$10,000 to $14,999
- 7$25,000 to $29,999
- 7$35,000 to $39,999
- 92$50,000 to $59,999
- 14$70,000 to $79,999
- 11$80,000 to $89,999
- 67$90,000 to $99,999
- 89$100,000 to $124,999
- 387$125,000 to $149,999
- 214$150,000 to $174,999
- 148$175,000 to $199,999
- 469$200,000 to $249,999
- 253$250,000 to $299,999
- 277$300,000 to $399,999
- 102$400,000 to $499,999
- 251$500,000 to $749,999
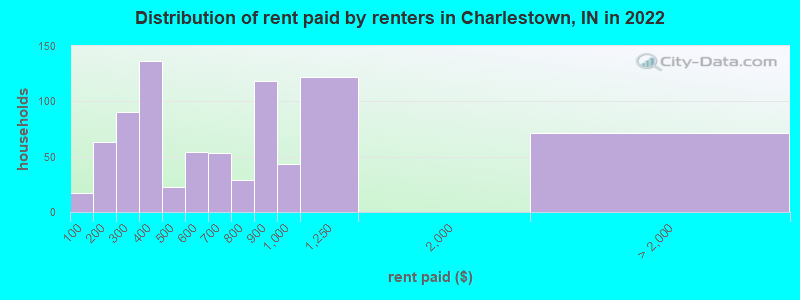
Rent paid by renters in 2022 in Charlestown, IN
-
- 17Less than $100
- 16$100 to $149
- 46$150 to $199
- 81$200 to $249
- 8$250 to $299
- 18$300 to $349
- 117$350 to $399
- 22$450 to $499
- 40$500 to $549
- 13$550 to $599
- 41$600 to $649
- 11$650 to $699
- 28$750 to $799
- 117$800 to $899
- 42$900 to $999
- 121$1,000 to $1,249
- 70No cash rent
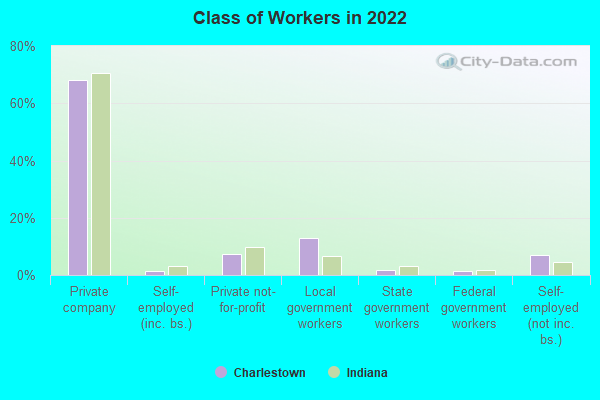
Percentage of workers working in this county: 65.6%
Number of people working at home: 221 (5.7% of all workers)
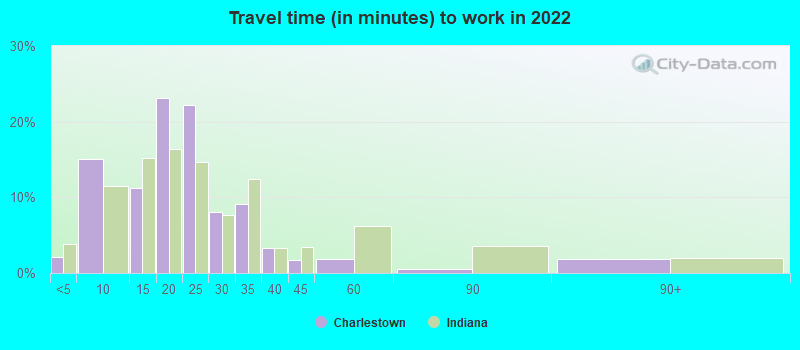
Travel time to work (commute)
- Less than 5 minutes: 51
- 5 to 9 minutes: 339
- 10 to 14 minutes: 366
- 15 to 19 minutes: 330
- 20 to 24 minutes: 1,164
- 25 to 29 minutes: 446
- 30 to 34 minutes: 789
- 35 to 39 minutes: 60
- 40 to 44 minutes: 98
- 45 to 59 minutes: 41
- 60 to 89 minutes: 115
- 90 or more minutes: 0
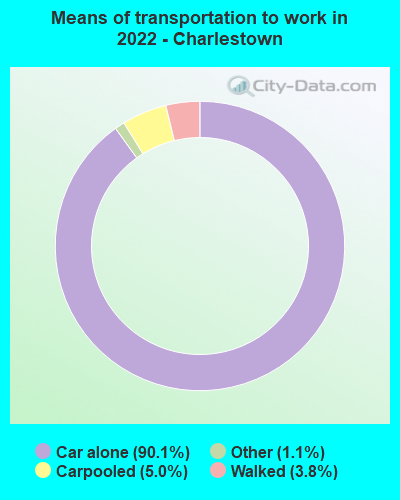
Means of transportation to work:
- Drove a car alone: 1,769 (79.9%)
- Carpooled: 109 (4.9%)
- Taxi: 25 (1.1%)
- Walked: 75 (3.4%)
- Worked at home: 221 (10.0%)
- Unemployment by race in 2022
- Unemployment rate for White non-Hispanic residents
- 1.5%Males
- 1.8%Females
- Unemployment rate for two or more race residents
- 8.1%Females
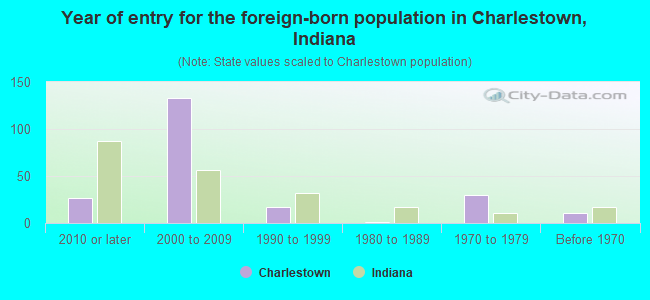
- Year of entry for the foreign-born population in Charlestown, Indiana
- 272010 or later
- 1332000 to 2009
- 171990 to 1999
- 11980 to 1989
- 301970 to 1979
- 11Before 1970
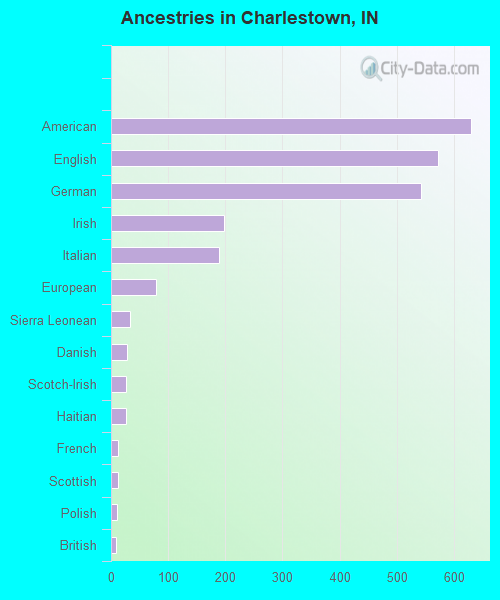
First ancestries reported:
- American: 630 (19.7%)
- English: 573 (17.9%)
- German: 543 (17.0%)
- Irish: 198 (6.2%)
- Italian: 189 (5.9%)
- European: 78 (2.4%)
- Sierra Leonean: 33 (1.0%)
- Danish: 28 (0.9%)
- Scotch-Irish: 27 (0.8%)
- Haitian: 27 (0.8%)
- French: 13 (0.4%)
- Scottish: 12 (0.4%)
- Polish: 10 (0.3%)
- British: 8 (0.2%)
Most common places of birth for foreign-born residents (%):
| Charlestown: | 20.9% (46) |
| Indiana: | 2.2% (8,253) |
| Charlestown: | 20.5% (45) |
| Indiana: | 27.0% (101,996) |
| Charlestown: | 18.6% (41) |
| Indiana: | 0.1% (395) |
| Charlestown: | 6.8% (15) |
| Indiana: | 2.0% (7,653) |
| Charlestown: | 5.0% (11) |
| Indiana: | 2.1% (7,834) |
| Charlestown: | 3.6% (8) |
| Indiana: | 0.3% (1,173) |
Place of birth for U.S.-born residents:
- This state: 4,368
- Other state: 3,530
- Northeast: 145
- Midwest: 616
- South: 2,261
- West: 617
79.3% of Charlestown residents lived in the same house 1 years ago.
Out of people who lived in different houses, 37.1% lived in this county.
Out of people who lived in different counties, 3.3% lived in Indiana.
| Charlestown: | 79.3% |
| State average: | 87.1% |
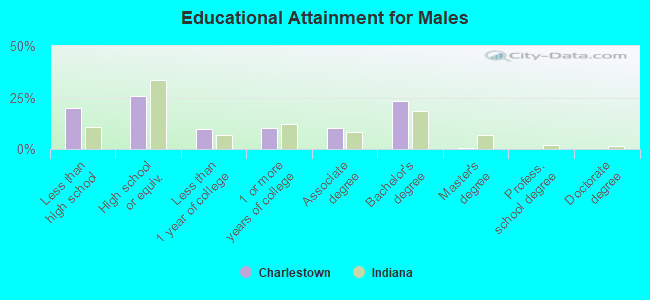
Education attainment for males 25 years and older:
- No schooling: 73
- Nursery to 4th grade: 0
- 5th and 6th grade: 7
- 7th and 8th grade: 27
- 9th grade: 16
- 10th grade: 132
- 11th grade: 59
- 12th grade, no diploma: 185
- High school graduate (or equivalency): 649
- Less than 1 year of college: 245
- Some college more than 1 year, no degree: 255
- Associate degree: 263
- Bachelor's degree: 593
- Master's degree: 18
- Professional school degree: 0
- Doctorate degree: 0
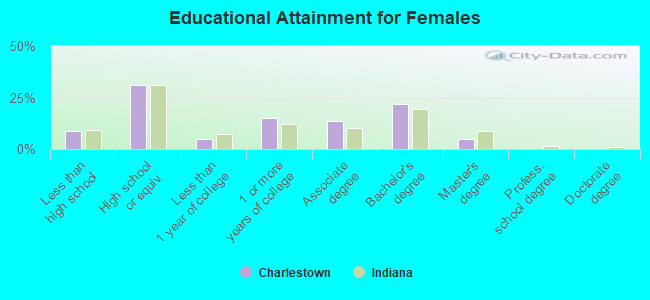
Education attainment for females 25 years and older:
- No schooling: 41
- Nursery to 4th grade: 0
- 5th and 6th grade: 29
- 7th and 8th grade: 37
- 9th grade: 19
- 10th grade: 0
- 11th grade: 109
- 12th grade, no diploma: 25
- High school graduate (or equivalency): 946
- Less than 1 year of college: 155
- Some college more than 1 year, no degree: 455
- Associate degree: 414
- Bachelor's degree: 672
- Master's degree: 152
- Professional school degree: 0
- Doctorate degree: 6
Housing units in structures:
- One, detached: 2,610
- One, attached: 249
- Two: 148
- 3 or 4: 94
- 5 to 9: 91
- 20 to 49: 199
- 50 or more: 83
- Mobile homes: 13
Housing units lacking complete kitchen facilities in 2022: 8.4%
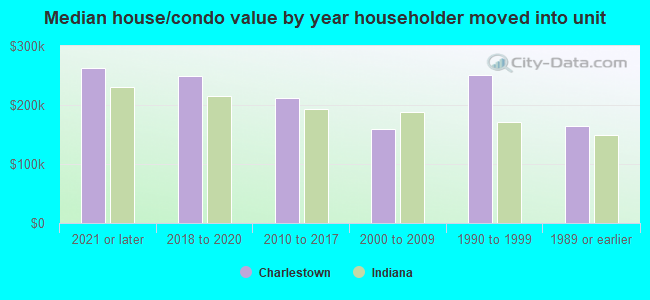
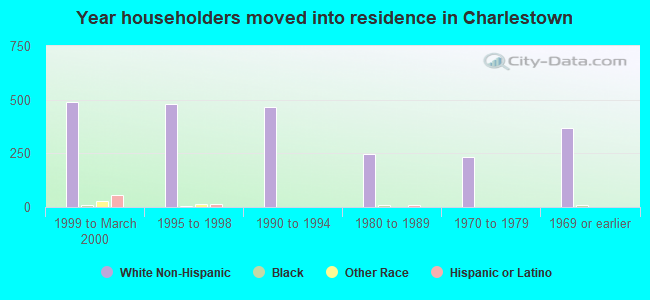
House/condo owner moved in on average 8 years ago
Renter moved in on average 1 years ago
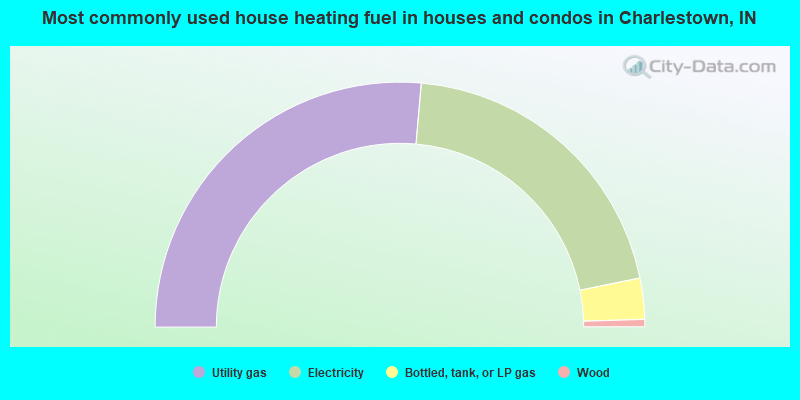
- 52.8%Utility gas
- 40.8%Electricity
- 5.4%Bottled, tank, or LP gas
- 1.0%Wood
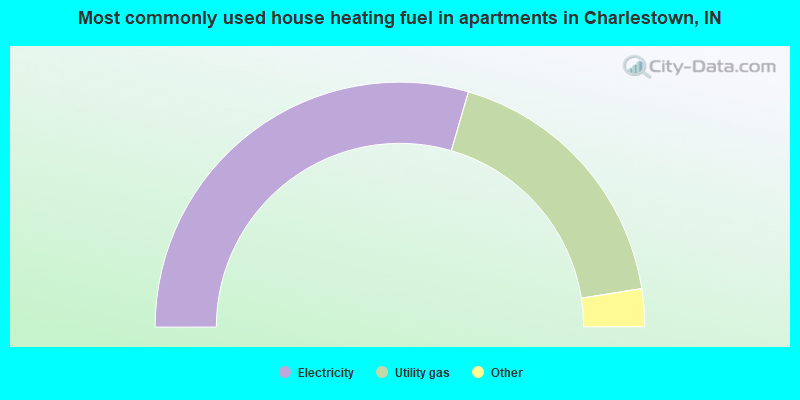
- 59.1%Electricity
- 36.0%Utility gas
- 3.1%No fuel used
- 1.8%Bottled, tank, or LP gas
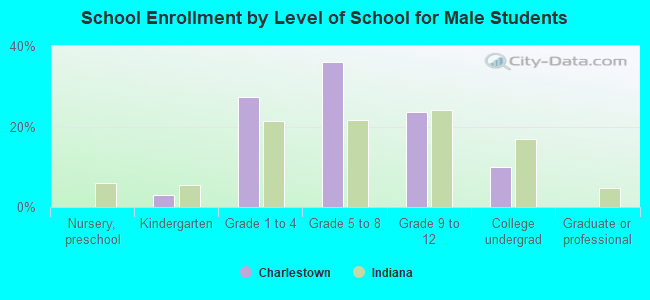
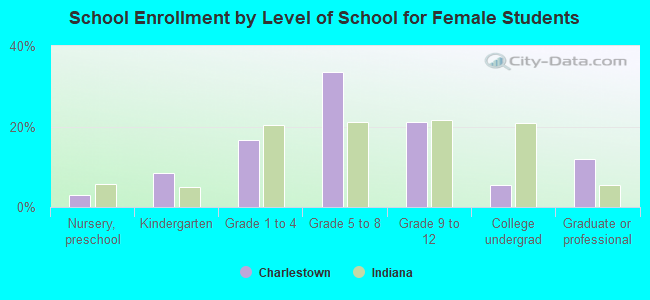
Private vs. public school enrollment:
| Here: | 4.7% |
| Indiana: | 14.9% |
| Here: | 16.0% |
| Indiana: | 11.4% |
| Here: | 0.0% |
| Indiana: | 22.3% |