Chenoa, IL (Illinois) Houses and Residents
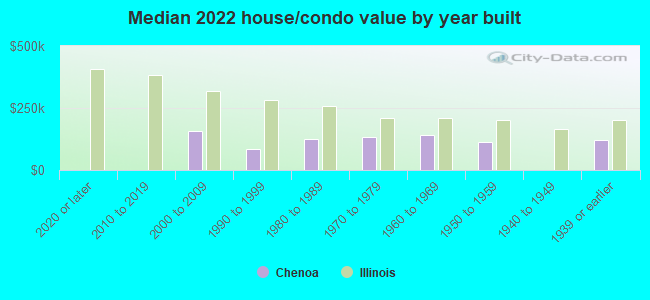
| Chenoa: | $121,146 |
| Illinois: | $251,600 |
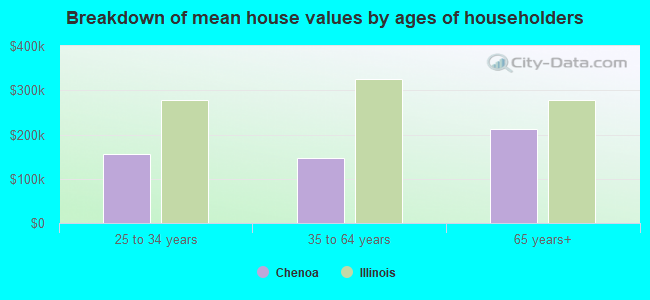
Mean price in 2022:
Detached houses: $114,018
Here: $114,018 State: $310,164 Mobile homes: $48,505
Here: $48,505 State: $78,855
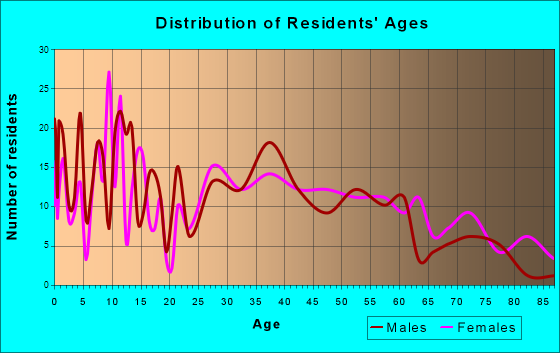
Total population: 1,777 (Urban population: 0, Rural population: 1,855 (all nonfarm))
Houses: 752 (625 occupied: 509 owner occupied, 115 renter occupied)
| % of renters here: | 18% |
| State: | 33% |
Housing density: 600 houses/condos per square mile
Median price asked for vacant for-sale houses and condos in 2022: $183,266.
Median contract rent in 2022: $623 (lower quartile is $567, upper quartile is $642)
Median rent asked for vacant for-rent units in 2022: $2,639
Median gross rent in Chenoa, IL in 2022: $846
Housing units in Chenoa with a mortgage: 299 (19 second mortgage, 0 home equity loan, 15 both second mortgage and home equity loan)
Houses without a mortgage: 11
Median household income for houses/condos with a mortgage: $68,929
Median household income for apartments without a mortgage: $57,868
Median monthly housing costs: $835
Compare current foreclosures near Chenoa, IL:
| Photo | Address | Area | Beds / Baths | Price | Details |
|---|---|---|---|---|---|

|
#1
E 3000 North Rd
Chenoa, IL 61726
|
1,898 sq. feet
|
1 baths - beds |
show details | |

|
#2
E 1st St
El Paso, IL 61738
|
1,930 sq. feet
|
3 baths 6 beds |
show details | |

|
#3
E Oak St
Fairbury, IL 61739
|
1,786 sq. feet
|
1 baths 2 beds |
show details | |

|
#4
W Monroe St
Towanda, IL 61776
|
1,163 sq. feet
|
1 baths - beds |
show details | |

|
#5
N Jackson St
Flanagan, IL 61740
|
1,970 sq. feet
|
2 baths 4 beds |
show details | |

|
#6
E Howard St
Pontiac, IL 61764
|
768 sq. feet
|
- baths 2 beds |
show details | |

|
#7
E North St
Forrest, IL 61741
|
1,480 sq. feet
|
- baths 3 beds |
show details | |

|
#8
E North St
Colfax, IL 61728
|
1,296 sq. feet
|
2 baths - beds |
show details | |

|
#9
N Monroe St
Flanagan, IL 61740
|
1,248 sq. feet
|
- baths 3 beds |
show details | |

|
#10
S Jackson St
Flanagan, IL 61740
|
2,596 sq. feet
|
- baths 5 beds |
show details |
| Photo | Address | Area | Beds / Baths | Price | Details |
|---|---|---|---|---|---|

|
#11
N Walnut St
Pontiac, IL 61764
|
1,188 sq. feet
|
- baths 3 beds |
show details | |

|
#12
N 1000 East Rd
Pontiac, IL 61764
|
1,740 sq. feet
|
- baths 3 beds |
show details | |

|
#13
N Main St
Pontiac, IL 61764
|
2,409 sq. feet
|
- baths 3 beds |
show details | |

|
#14
E Ash St
Fairbury, IL 61739
|
1,852 sq. feet
|
- baths 3 beds |
show details | |

|
#15
E Payson St
Pontiac, IL 61764
|
1,641 sq. feet
|
- baths 3 beds |
show details | |

|
#16
Rainbow Bridge Rd
Lexington, IL 61753
|
1,036 sq. feet
|
1 baths - beds |
show details | |

|
#17
W Walnut St
Lexington, IL 61753
|
956 sq. feet
|
1 baths - beds |
show details | |

|
#18
N Ford St
Gridley, IL 61744
|
864 sq. feet
|
1 baths - beds |
show details | |

|
#19
Livingston St
Gridley, IL 61744
|
1,381 sq. feet
|
1 baths - beds |
show details | |

|
#20
W Livingston St
Pontiac, IL 61764
|
1,260 sq. feet
|
- baths 2 beds |
show details |
| Photo | Address | Area | Beds / Baths | Price | Details |
|---|---|---|---|---|---|

|
#21
N East St
Hudson, IL 61748
|
1,294 sq. feet
|
1 baths - beds |
show details | |

|
#22
W Humiston St
Pontiac, IL 61764
|
1,038 sq. feet
|
- baths 3 beds |
show details | |

|
#23
1/2 S Mill St
Pontiac, IL 61764
|
- sq. feet
|
- baths - beds |
show details | |

|
#24
W North St # 1
Pontiac, IL 61764
|
- sq. feet
|
- baths - beds |
show details | |

|
#25
N Lee St
Lexington, IL 61753
|
- sq. feet
|
- baths - beds |
show details | |

|
#26
W Lorraine St
Forrest, IL 61741
|
- sq. feet
|
- baths - beds |
show details | |

|
#27
N. 3300 East Road
Arrowsmith, IL 61722
|
- sq. feet
|
- baths - beds |
show details | |

|
#28
S Sycamore St
El Paso, IL 61738
|
- sq. feet
|
- baths - beds |
show details | |

|
#29
W Front St Apt F
El Paso, IL 61738
|
- sq. feet
|
- baths - beds |
show details | |

|
#30
E 2300 North Rd
Hudson, IL 61748
|
- sq. feet
|
- baths - beds |
show details |
| Photo | Address | Area | Beds / Baths | Price | Details |
|---|---|---|---|---|---|

|
#31
N Aurora St Apt 1a
Pontiac, IL 61764
|
- sq. feet
|
- baths - beds |
show details | |

|
#32
E 1875 North Rd
Pontiac, IL 61764
|
1,624 sq. feet
|
- baths - beds |
show details | |

|
#33
N Grove St
Colfax, IL 61728
|
- sq. feet
|
- baths - beds |
show details | |

|
#34
Vermillion Est
Pontiac, IL 61764
|
- sq. feet
|
- baths - beds |
show details | |

|
#35
N Center St
Gridley, IL 61744
|
- sq. feet
|
- baths - beds |
show details | |

|
#36
N Jackson St
Flanagan, IL 61740
|
- sq. feet
|
- baths - beds |
show details | |

|
#37
S Main St
Flanagan, IL 61740
|
- sq. feet
|
- baths - beds |
show details | |

|
#38
Anvil Dr
Lexington, IL 61753
|
- sq. feet
|
- baths - beds |
show details | |

|
#39
N Lovejoy St
El Paso, IL 61738
|
- sq. feet
|
- baths - beds |
show details | |

|
#40
W Lincoln Ave
Pontiac, IL 61764
|
- sq. feet
|
- baths - beds |
show details |
| Photo | Address | Area | Beds / Baths | Price | Details |
|---|---|---|---|---|---|

|
Check over 1 million property listings on Foreclosure.com!
|
browse all offers | |||
| Photo | Address | Area | Beds / Baths | Price | Details |
|---|

Latest news about housing in Chenoa, IL collected exclusively by city-data.com from local newspapers, TV, and radio stations

 | Spoon River scenic drive? (13 replies) |
| Help needed---search for old family friends within an hour or less drive of Peoria... (20 replies) |
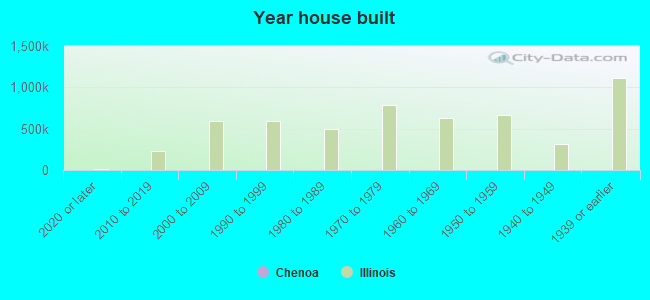
Median year apartment built: 1960
Household type by relationship:
Households: 1,550- Male householders: 308 (88 living alone), Female householders: 312 (62 living alone)
343 spouses (333 opposite-sex spouses), 24 unmarried partners, (24 opposite-sex unmarried partners), 442 children (353 natural, 65 adopted, 22 stepchildren), 21 grandchildren, 0 brothers or sisters, 17 parents, 0 foster children, 38 other relatives, 38 non-relatives
Size of family households: 265 2-persons, 101 3-persons, 27 4-persons, 29 5-persons, 21 6-persons, 2 7-or-more-persons.
Size of nonfamily households: 169 1-person, 10 2-persons, 3 5-persons.
155 married couples with children.
134 single-parent households (10 men, 124 women).
96.9% of residents of Chenoa speak English at home.
1.5% of residents speak Spanish at home (100% speak English very well).
0.9% of residents speak other Indo-European language at home (69% speak English very well, 31% speak English well).
0.3% of residents speak Asian or Pacific Island language at home (100% speak English very well).
Foreign born population: 13 (0.8%)
(100.0% of them are naturalized citizens)
| Here: | 6.5 |
| State: | 6.4 |
| Here: | 4.2 |
| State: | 4.1 |
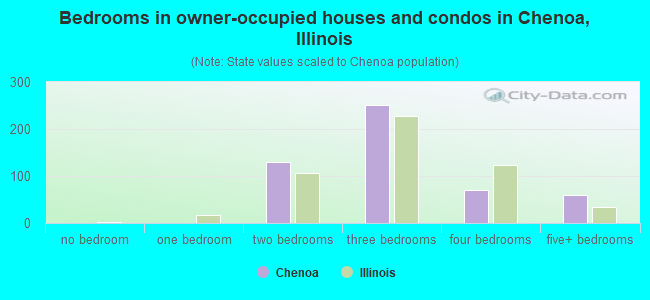
- Bedrooms in owner-occupied houses and condos in Chenoa, Illinois
- 0no bedroom
- 01 bedroom
- 1292 bedrooms
- 2513 bedrooms
- 704 bedrooms
- 595+ bedrooms
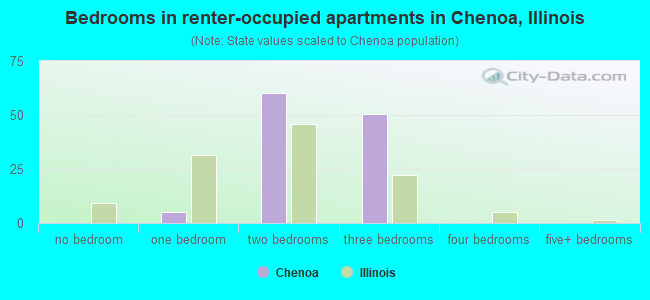
- Bedrooms in renter-occupied apartments in Chenoa, Illinois
- 0no bedroom
- 51 bedroom
- 602 bedrooms
- 503 bedrooms
- 04 bedrooms
- 05+ bedrooms
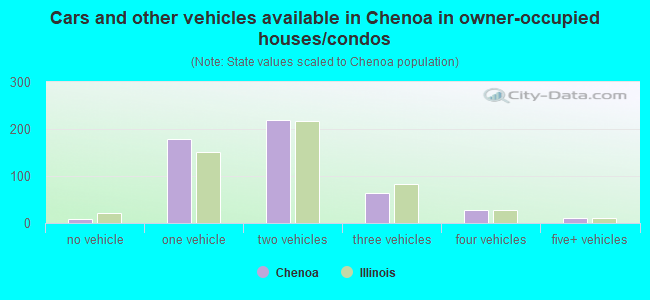
- Cars and other vehicles available in Chenoa in owner-occupied houses/condos
- 9no vehicle
- 1781 vehicle
- 2202 vehicles
- 643 vehicles
- 274 vehicles
- 115+ vehicles
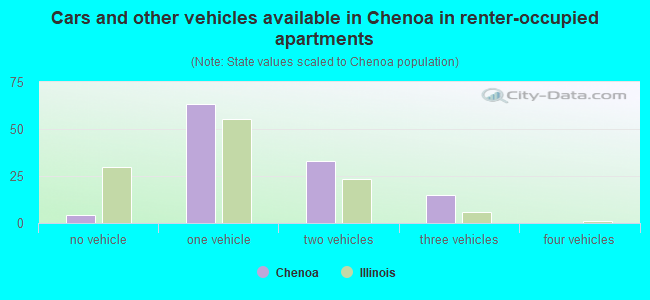
- Cars and other vehicles available in Chenoa in renter-occupied apartments
- 4no vehicle
- 631 vehicle
- 332 vehicles
- 153 vehicles
- 04 vehicles
- 05+ vehicles
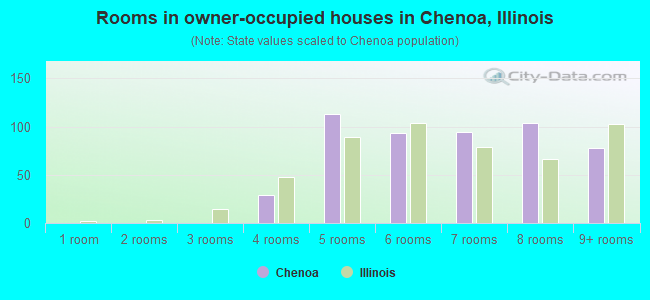
- Rooms in owner-occupied houses in Chenoa, Illinois
- 01 room
- 02 rooms
- 03 rooms
- 294 rooms
- 1135 rooms
- 936 rooms
- 947 rooms
- 1048 rooms
- 789+ rooms
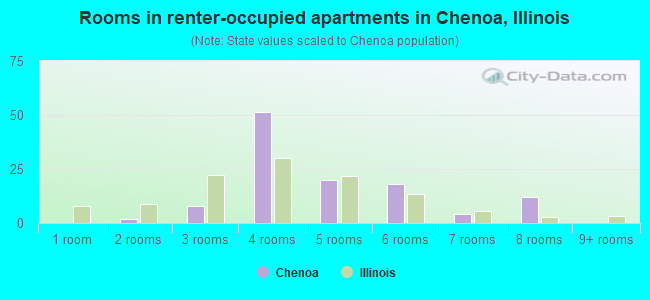
- Rooms in renter-occupied apartments in Chenoa, Illinois
- 01 room
- 22 rooms
- 83 rooms
- 514 rooms
- 205 rooms
- 186 rooms
- 47 rooms
- 128 rooms
- 09+ rooms
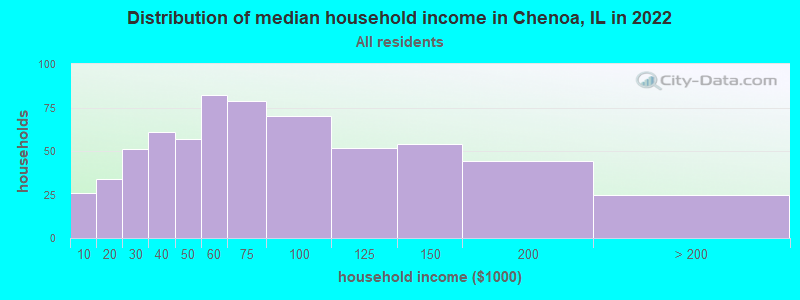
Chenoa, IL household income distribution

- 26Less than $10,000
- 34$10,000 to $19,999
- 51$20,000 to $29,999
- 61$30,000 to $39,999
- 57$40,000 to $49,999
- 82$50,000 to $59,999
- 79$60,000 to $74,999
- 70$75,000 to $99,999
- 52$100,000 to $124,999
- 54$125,000 to $149,999
- 44$150,000 to $199,999
- 25$200,000 or more
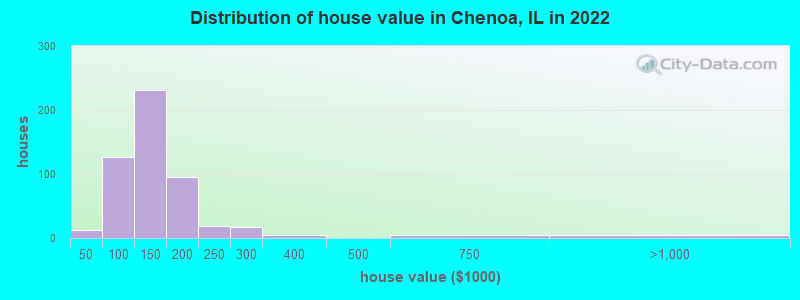
Home value of owner - occupied houses in 2022 in Chenoa, IL
-
- 0$10,000 to $14,999
- 2$20,000 to $24,999
- 4$25,000 to $29,999
- 1$35,000 to $39,999
- 3$40,000 to $49,999
- 30$50,000 to $59,999
- 24$60,000 to $69,999
- 3$70,000 to $79,999
- 25$80,000 to $89,999
- 39$90,000 to $99,999
- 136$100,000 to $124,999
- 95$125,000 to $149,999
- 66$150,000 to $174,999
- 29$175,000 to $199,999
- 19$200,000 to $249,999
- 16$250,000 to $299,999
- 4$300,000 to $399,999
- 4$500,000 to $749,999
- 5$750,000 to $999,999
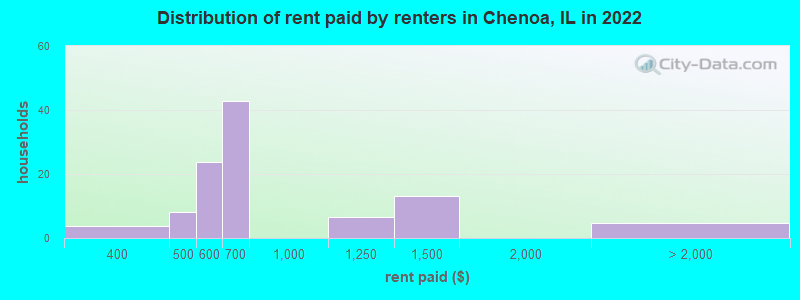
Rent paid by renters in 2022 in Chenoa, IL
-
- 3$350 to $399
- 8$450 to $499
- 12$500 to $549
- 11$550 to $599
- 29$600 to $649
- 13$650 to $699
- 6$1,000 to $1,249
- 13$1,250 to $1,499
- 4No cash rent
Percentage of workers working in this county: 51.6%
Number of people working at home: 54 (7.4% of all workers)
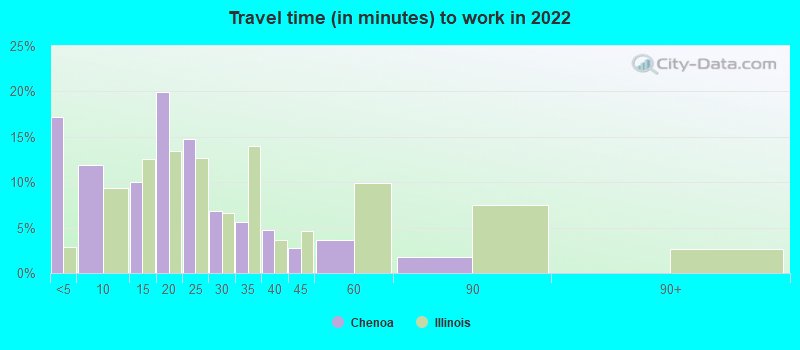
Travel time to work (commute)
- Less than 5 minutes: 61
- 5 to 9 minutes: 41
- 10 to 14 minutes: 41
- 15 to 19 minutes: 147
- 20 to 24 minutes: 77
- 25 to 29 minutes: 33
- 30 to 34 minutes: 113
- 35 to 39 minutes: 16
- 40 to 44 minutes: 10
- 45 to 59 minutes: 32
- 60 to 89 minutes: 90
- 90 or more minutes: 8
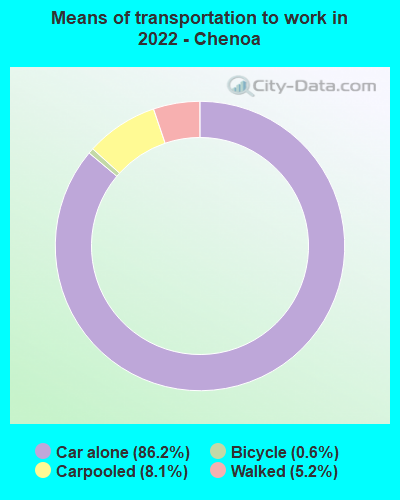
Means of transportation to work:
- Drove a car alone: 287 (73.2%)
- Carpooled: 22 (5.6%)
- Bicycle: 3 (0.8%)
- Walked: 16 (4.1%)
- Worked at home: 54 (13.8%)
- Unemployment by race in 2022
- Unemployment rate for White non-Hispanic residents
- 2.4%Males
- 1.9%Females
- Unemployment rate for Black residents
- 100.0%Males
- 55.5%Females
- Unemployment rate for Hispanic or Latino residents
- 25.1%Males
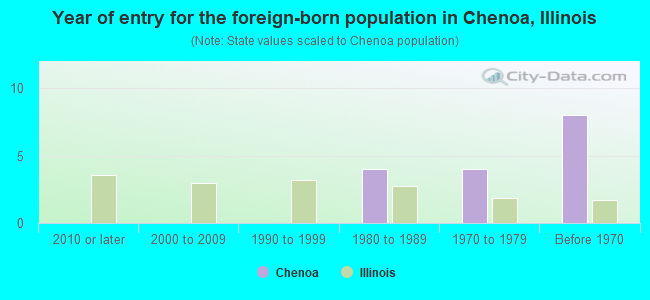
- Year of entry for the foreign-born population in Chenoa, Illinois
- 02010 or later
- 02000 to 2009
- 01990 to 1999
- 41980 to 1989
- 41970 to 1979
- 8Before 1970
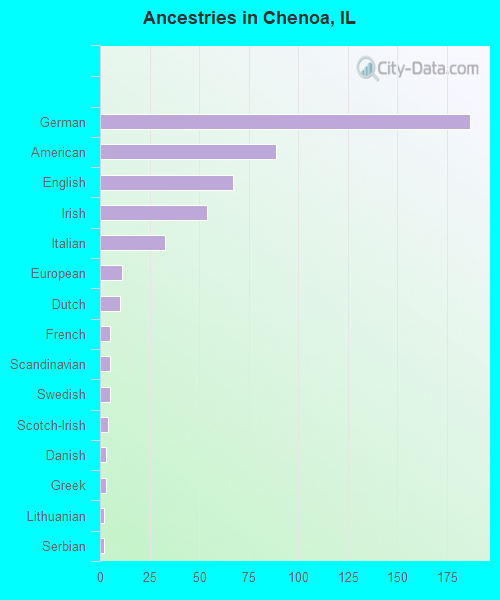
First ancestries reported:
- German: 187 (28.7%)
- American: 89 (13.7%)
- English: 67 (10.3%)
- Irish: 54 (8.3%)
- Italian: 33 (5.1%)
- European: 11 (1.7%)
- Dutch: 10 (1.5%)
- French: 5 (0.8%)
- Scandinavian: 5 (0.8%)
- Swedish: 5 (0.8%)
- Scotch-Irish: 4 (0.6%)
- Danish: 3 (0.5%)
- Greek: 3 (0.5%)
- Lithuanian: 2 (0.3%)
- Serbian: 2 (0.3%)
Most common places of birth for foreign-born residents (%):
| Chenoa: | 60.0% (9) |
| Illinois: | 9.2% (166,409) |
| Chenoa: | 26.7% (4) |
| Illinois: | 0.6% (10,720) |
| Chenoa: | 13.3% (2) |
| Illinois: | 1.0% (18,753) |
Place of birth for U.S.-born residents:
- This state: 1,249
- Other state: 296
- Northeast: 8
- Midwest: 113
- South: 122
- West: 33
91.2% of Chenoa residents lived in the same house 1 years ago.
Out of people who lived in different houses, 31.2% lived in this county.
Out of people who lived in different counties, 82.9% lived in Illinois.
| Chenoa: | 91.2% |
| State average: | 88.3% |
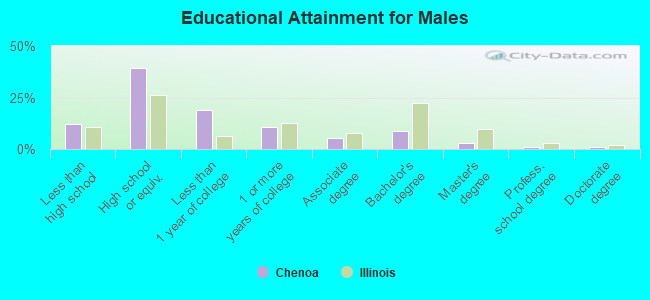
Education attainment for males 25 years and older:
- No schooling: 11
- Nursery to 4th grade: 3
- 5th and 6th grade: 0
- 7th and 8th grade: 5
- 9th grade: 10
- 10th grade: 0
- 11th grade: 13
- 12th grade, no diploma: 14
- High school graduate (or equivalency): 181
- Less than 1 year of college: 87
- Some college more than 1 year, no degree: 49
- Associate degree: 24
- Bachelor's degree: 41
- Master's degree: 13
- Professional school degree: 4
- Doctorate degree: 5
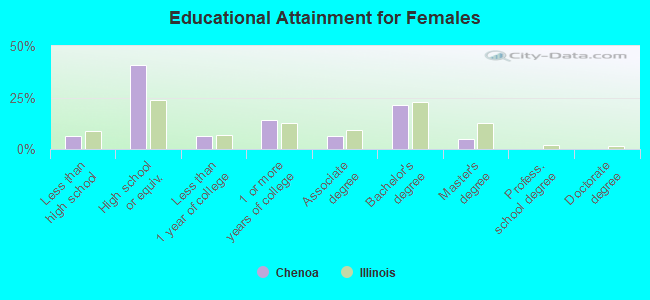
Education attainment for females 25 years and older:
- No schooling: 11
- Nursery to 4th grade: 0
- 5th and 6th grade: 0
- 7th and 8th grade: 0
- 9th grade: 10
- 10th grade: 3
- 11th grade: 6
- 12th grade, no diploma: 3
- High school graduate (or equivalency): 214
- Less than 1 year of college: 34
- Some college more than 1 year, no degree: 74
- Associate degree: 32
- Bachelor's degree: 113
- Master's degree: 25
- Professional school degree: 0
- Doctorate degree: 0
Housing units in structures:
- One, detached: 633
- One, attached: 38
- Two: 14
- 3 or 4: 17
- 5 to 9: 12
- 10 to 19: 15
- Mobile homes: 22
Median worth of mobile homes: $66,702
Housing units lacking complete kitchen facilities in 2022: 3.9%
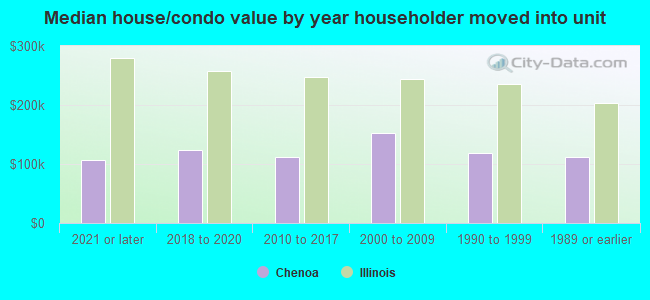
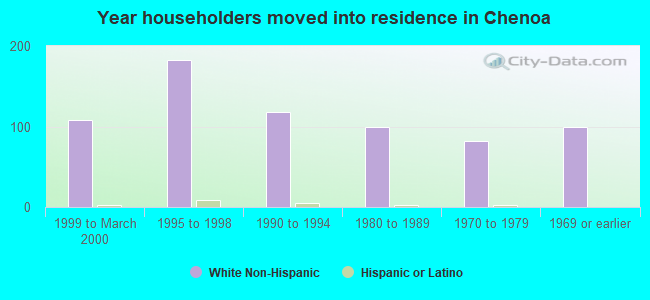
House/condo owner moved in on average 10 years ago
Renter moved in on average 4 years ago
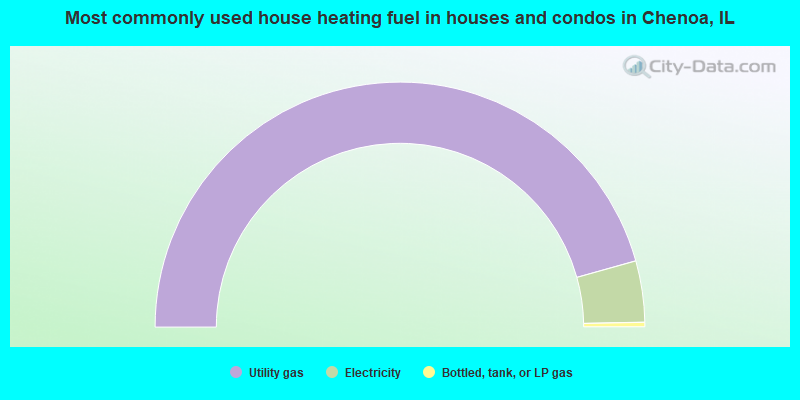
- 91.3%Utility gas
- 8.1%Electricity
- 0.6%Bottled, tank, or LP gas
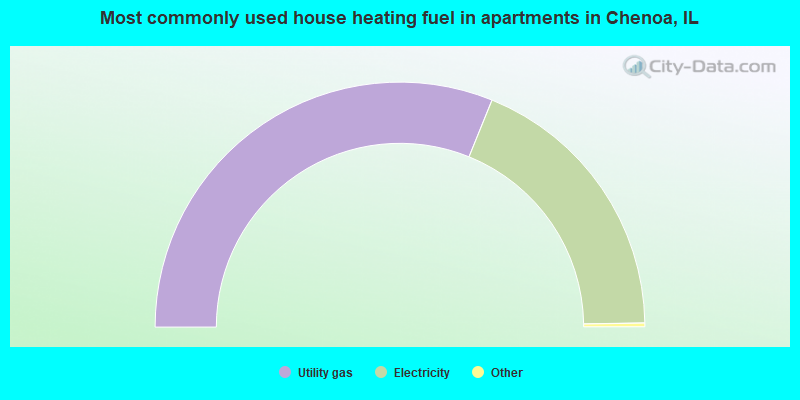
- 62.6%Utility gas
- 37.4%Electricity
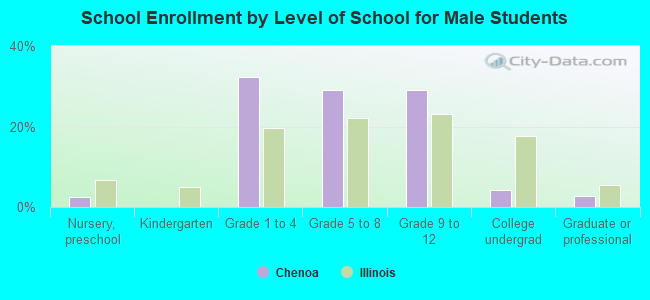
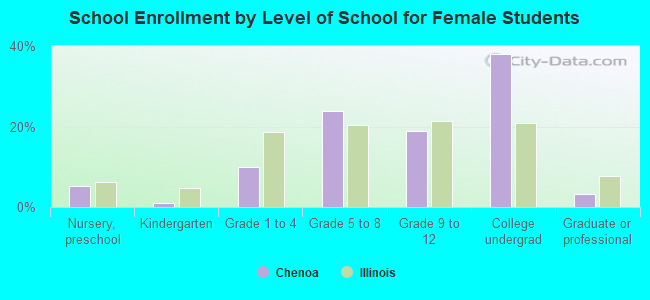
Private vs. public school enrollment:
| Here: | 7.3% |
| Illinois: | 13.3% |
| Here: | 12.3% |
| Illinois: | 9.9% |
| Here: | 8.0% |
| Illinois: | 27.4% |