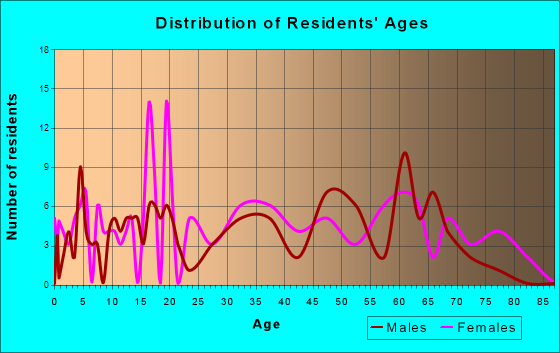
Chesapeake City, MD (Maryland) Houses and Residents
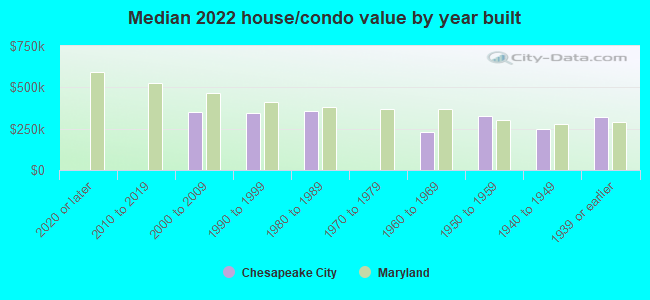
| Chesapeake City: | $339,010 |
| Maryland: | $398,100 |
Total population: 690 (Urban population: 0, Rural population: 763 (all nonfarm))
Houses: 474 (418 occupied: 336 owner occupied, 92 renter occupied)
| % of renters here: | 21% |
| State: | 32% |
Housing density: 839 houses/condos per square mile
Median price asked for vacant for-sale houses and condos in 2022: $1,930,678.
Median contract rent in 2022: $892 (lower quartile is $451, upper quartile is $984)
Median rent asked for vacant for-rent units in 2022: $3,169
Median gross rent in Chesapeake City, MD in 2022: $996
Housing units in Chesapeake City with a mortgage: 238 (30 second mortgage, 0 home equity loan, 18 both second mortgage and home equity loan)
Houses without a mortgage: 1
Median household income for houses/condos with a mortgage: $88,950
Median household income for apartments without a mortgage: $70,325
Median monthly housing costs: $1,195
Compare current foreclosures near Chesapeake City, MD:
| Photo | Address | Area | Beds / Baths | Price | Details |
|---|---|---|---|---|---|

|
#1
Biddle St
Chesapeake City, MD 21915
|
1,200 sq. feet
|
1 baths - beds |
show details | |

|
#2
Flint Hill Rd
Landenberg, PA 19350
|
960 sq. feet
|
1 baths 2 beds |
$75,282
|
show details |

|
#3
E Old Philadelphia Rd
Elkton, MD 21921
|
2,570 sq. feet
|
5 baths 4 beds |
show details | |

|
#4
Jefferson Ave
New Castle, DE 19720
|
1,152 sq. feet
|
1 baths 3 beds |
show details | |

|
#5
Media Rd
Oxford, PA 19363
|
1,155 sq. feet
|
1 baths 2 beds |
show details | |

|
#6
Merion Ct
Elkton, MD 21921
|
2,014 sq. feet
|
3 baths 3 beds |
show details | |

|
#7
Rossini Ln
Middletown, DE 19709
|
- sq. feet
|
2 baths 3 beds |
show details | |

|
#8
Rocky Glen Rd
Oxford, PA 19363
|
2,191 sq. feet
|
2 baths 4 beds |
show details | |

|
#9
Kimbelot Ln
Landenberg, PA 19350
|
2,282 sq. feet
|
2 baths 4 beds |
show details | |

|
#10
Armitage Ct
Lincoln University, PA 19352
|
2,436 sq. feet
|
1 baths 4 beds |
show details |
| Photo | Address | Area | Beds / Baths | Price | Details |
|---|---|---|---|---|---|

|
#11
Stockton Dr
New Castle, DE 19720
|
- sq. feet
|
1 baths 4 beds |
show details | |

|
#12
Post Rd
Port Deposit, MD 21904
|
1,306 sq. feet
|
1 baths - beds |
show details | |

|
#13
Media Rd
Oxford, PA 19363
|
1,155 sq. feet
|
1 baths 2 beds |
show details | |

|
#14
Elbow Ln
Landenberg, PA 19350
|
2,030 sq. feet
|
2 baths 4 beds |
show details | |

|
#15
Edjil Dr
Newark, DE 19713
|
- sq. feet
|
2 baths 4 beds |
show details | |

|
#16
Appleton Rd
Elkton, MD 21921
|
1,936 sq. feet
|
1 baths - beds |
show details | |

|
#17
Dillon Dr
New Castle, DE 19720
|
- sq. feet
|
1 baths 2 beds |
show details | |

|
#18
S Gerald Dr
Newark, DE 19713
|
- sq. feet
|
1 baths 3 beds |
show details | |

|
#19
Jacobsen Dr # 25
Newark, DE 19702
|
- sq. feet
|
2 baths 3 beds |
show details | |

|
#20
Tweedsmere Dr
Townsend, DE 19734
|
- sq. feet
|
2 baths 4 beds |
show details |
| Photo | Address | Area | Beds / Baths | Price | Details |
|---|---|---|---|---|---|

|
#21
Sonant Dr
Newark, DE 19713
|
- sq. feet
|
1 baths 3 beds |
show details | |

|
#22
Carleton Ct
New Castle, DE 19720
|
- sq. feet
|
1 baths 3 beds |
show details | |

|
#23
Bynum Pl
Bear, DE 19701
|
- sq. feet
|
2 baths 4 beds |
show details | |

|
#24
Nursery Dr
Bear, DE 19701
|
- sq. feet
|
2 baths 4 beds |
show details | |

|
#25
Joseph Biggs Memorial Hwy
North East, MD 21901
|
2,028 sq. feet
|
1 baths - beds |
show details | |

|
#26
Harpers Pl
Bear, DE 19701
|
- sq. feet
|
1 baths 3 beds |
show details | |

|
#27
Trevett Blvd
Newark, DE 19702
|
- sq. feet
|
1 baths 3 beds |
show details | |

|
#28
Lake Dr
Bear, DE 19701
|
- sq. feet
|
2 baths 3 beds |
show details | |

|
#29
Channing Dr
Bear, DE 19701
|
- sq. feet
|
1 baths 3 beds |
show details | |

|
#30
Channing Dr
Bear, DE 19701
|
- sq. feet
|
1 baths 3 beds |
show details |
| Photo | Address | Area | Beds / Baths | Price | Details |
|---|---|---|---|---|---|

|
#31
Shue Dr
Newark, DE 19713
|
- sq. feet
|
1 baths 3 beds |
show details | |

|
#32
Newton Dr
Bear, DE 19701
|
- sq. feet
|
2 baths 3 beds |
show details | |

|
#33
Jacobsen Dr
Newark, DE 19702
|
- sq. feet
|
3 baths 3 beds |
show details | |

|
#34
Avonbridge Dr
Townsend, DE 19734
|
- sq. feet
|
3 baths 4 beds |
show details | |

|
#35
S Dillwyn Rd
Newark, DE 19711
|
- sq. feet
|
1 baths 3 beds |
show details | |

|
#36
Layton Dr
New Castle, DE 19720
|
- sq. feet
|
2 baths 4 beds |
show details | |

|
#37
Karen Ct
New Castle, DE 19720
|
- sq. feet
|
2 baths 3 beds |
show details | |

|
#38
Malcolm Forest Rd
New Castle, DE 19720
|
- sq. feet
|
2 baths 4 beds |
show details | |

|
#39
Winburne Dr
New Castle, DE 19720
|
- sq. feet
|
1 baths 4 beds |
show details | |

|
#40
Quindome Dr
New Castle, DE 19720
|
- sq. feet
|
2 baths 3 beds |
show details |
| Photo | Address | Area | Beds / Baths | Price | Details |
|---|---|---|---|---|---|

|
#41
Union Church Rd
Townsend, DE 19734
|
- sq. feet
|
2 baths 3 beds |
show details | |

|
#42
Evlon Ct
New Castle, DE 19720
|
- sq. feet
|
2 baths 3 beds |
show details | |

|
#43
Calvary Ln
Rising Sun, MD 21911
|
1,500 sq. feet
|
2 baths - beds |
show details | |

|
#44
Schafer Blvd
New Castle, DE 19720
|
- sq. feet
|
1 baths 3 beds |
show details | |

|
#45
Odessa Way
Newark, DE 19711
|
- sq. feet
|
2 baths 4 beds |
show details | |

|
#46
Browns Ln
Newark, DE 19702
|
- sq. feet
|
3 baths 5 beds |
show details | |

|
#47
Cavallero Ct
New Castle, DE 19720
|
- sq. feet
|
2 baths 3 beds |
show details | |

|
#48
Old Forge Rd
New Castle, DE 19720
|
- sq. feet
|
1 baths 2 beds |
show details | |

|
#49
Harlequin Dr
New Castle, DE 19720
|
- sq. feet
|
2 baths 3 beds |
show details | |

|
Check over 1 million property listings on Foreclosure.com!
|
browse all offers | |||


 | What's your favorite Maryland town and why? (47 replies) |
| Looking to possibly buy home in Chesapeake City or Elkton MD (13 replies) |
| Possible Relocation from Dayton, OH to Elkton, MD (4 replies) |
| Eastern Shore VA Healthcare (1 reply) |
| How do you like living in Maryland? (141 replies) |
| Advice on Cecil/Hartford County living (5 replies) |
Median year apartment built: 1959
Household type by relationship:
Households: 809- Male householders: 175 (74 living alone), Female householders: 242 (112 living alone)
160 spouses (160 opposite-sex spouses), 17 unmarried partners, (17 opposite-sex unmarried partners), 150 children (150 natural, 0 adopted, 0 stepchildren), 13 grandchildren, 0 brothers or sisters, 7 parents, 0 foster children, 13 other relatives, 13 non-relatives
- In group quarters: 16
Size of family households: 151 2-persons, 36 3-persons, 25 4-persons, 6 5-persons, 5 7-or-more-persons.
Size of nonfamily households: 163 1-person, 16 2-persons.
9 married couples with children.
97 single-parent households (0 men, 97 women).
93.5% of residents of Chesapeake City speak English at home.
5.4% of residents speak Spanish at home (36% speak English very well, 64% speak English well).
0.3% of residents speak other Indo-European language at home (100% don't speak English at all).
0.6% of residents speak other language at home (60% speak English well, 40% speak English not well).
Foreign born population: 41 (5.1%)
(97.6% of them are naturalized citizens)
| Here: | 6.8 |
| State: | 7.3 |
| Here: | 3.2 |
| State: | 4.2 |
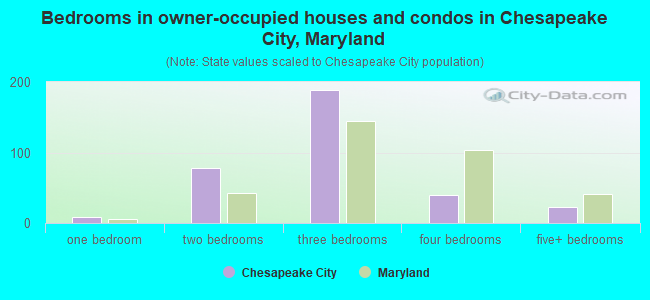
- Bedrooms in owner-occupied houses and condos in Chesapeake City, Maryland
- 0no bedroom
- 81 bedroom
- 782 bedrooms
- 1883 bedrooms
- 404 bedrooms
- 225+ bedrooms
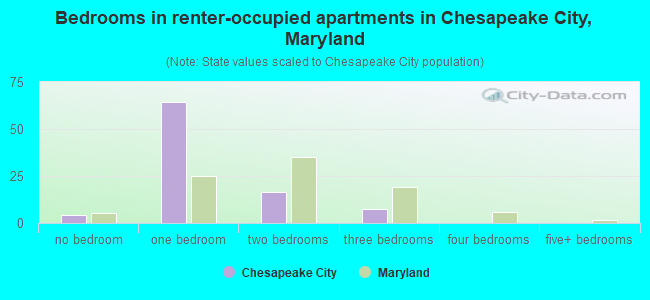
- Bedrooms in renter-occupied apartments in Chesapeake City, Maryland
- 4no bedroom
- 641 bedroom
- 172 bedrooms
- 73 bedrooms
- 04 bedrooms
- 05+ bedrooms
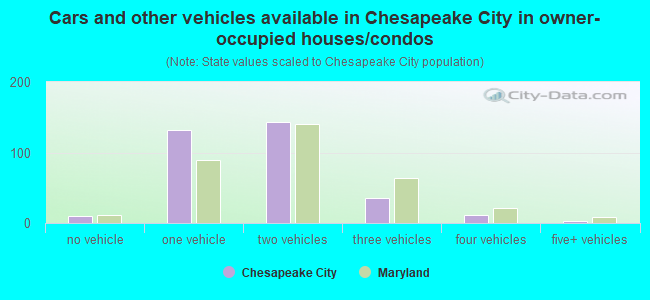
- Cars and other vehicles available in Chesapeake City in owner-occupied houses/condos
- 10no vehicle
- 1321 vehicle
- 1432 vehicles
- 353 vehicles
- 124 vehicles
- 35+ vehicles
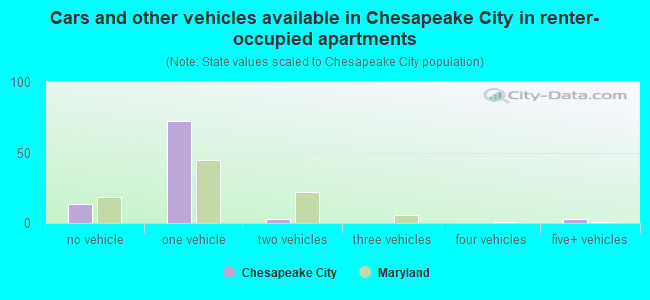
- Cars and other vehicles available in Chesapeake City in renter-occupied apartments
- 13no vehicle
- 721 vehicle
- 32 vehicles
- 03 vehicles
- 04 vehicles
- 35+ vehicles
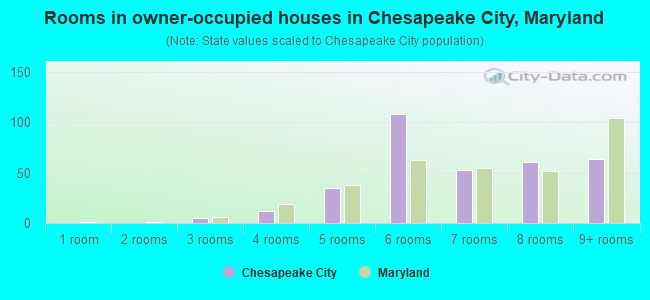
- Rooms in owner-occupied houses in Chesapeake City, Maryland
- 01 room
- 02 rooms
- 53 rooms
- 124 rooms
- 355 rooms
- 1086 rooms
- 537 rooms
- 608 rooms
- 639+ rooms
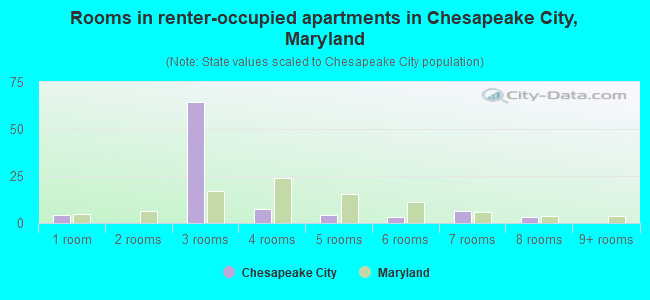
- Rooms in renter-occupied apartments in Chesapeake City, Maryland
- 41 room
- 02 rooms
- 643 rooms
- 74 rooms
- 45 rooms
- 36 rooms
- 67 rooms
- 38 rooms
- 09+ rooms
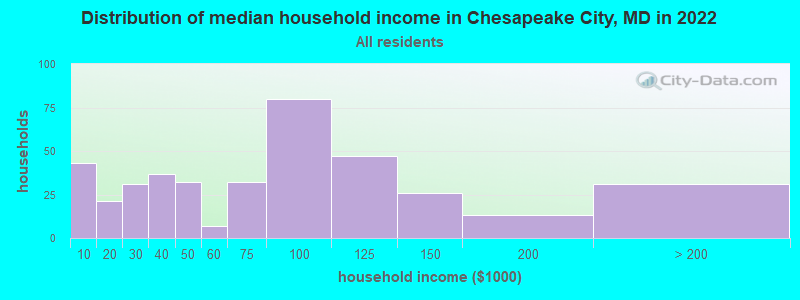
Chesapeake City, MD household income distribution

- 43Less than $10,000
- 21$10,000 to $19,999
- 31$20,000 to $29,999
- 37$30,000 to $39,999
- 32$40,000 to $49,999
- 7$50,000 to $59,999
- 32$60,000 to $74,999
- 80$75,000 to $99,999
- 47$100,000 to $124,999
- 26$125,000 to $149,999
- 13$150,000 to $199,999
- 31$200,000 or more
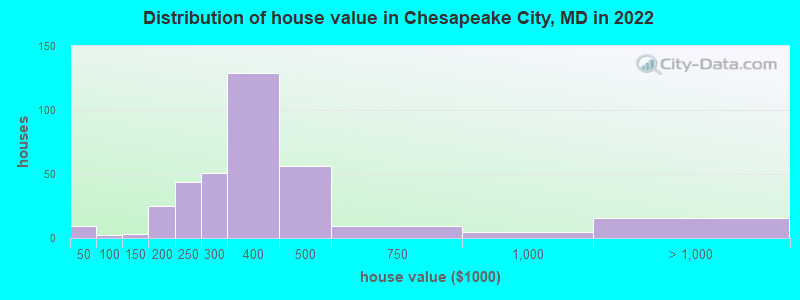
Home value of owner - occupied houses in 2022 in Chesapeake City, MD
-
- 6$15,000 to $19,999
- 1$25,000 to $29,999
- 1$35,000 to $39,999
- 1$90,000 to $99,999
- 2$100,000 to $124,999
- 16$150,000 to $174,999
- 7$175,000 to $199,999
- 43$200,000 to $249,999
- 50$250,000 to $299,999
- 128$300,000 to $399,999
- 56$400,000 to $499,999
- 8$500,000 to $749,999
- 4$750,000 to $999,999
- 16$1,000,000 to $1,499,999
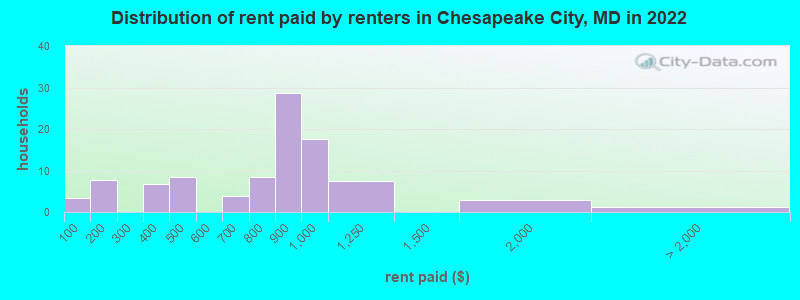
Rent paid by renters in 2022 in Chesapeake City, MD
-
- 3Less than $100
- 2$100 to $149
- 5$150 to $199
- 3$300 to $349
- 3$350 to $399
- 8$400 to $449
- 3$600 to $649
- 8$700 to $749
- 28$800 to $899
- 17$900 to $999
- 7$1,000 to $1,249
- 2$1,500 to $1,999
- 1No cash rent
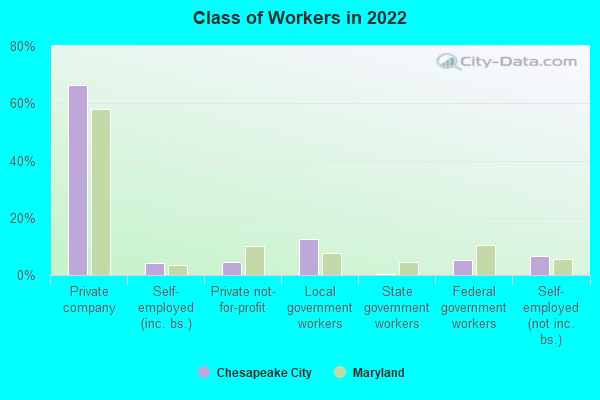
Percentage of workers working in this county: 71.5%
Number of people working at home: 80 (21.0% of all workers)
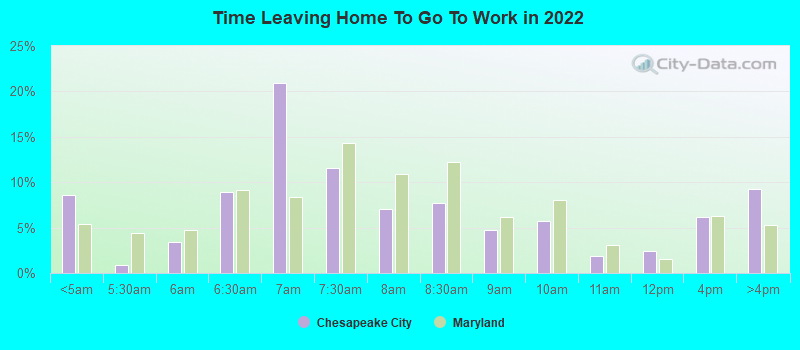
Travel time to work (commute)
- Less than 5 minutes: 12
- 5 to 9 minutes: 35
- 10 to 14 minutes: 34
- 15 to 19 minutes: 20
- 20 to 24 minutes: 21
- 25 to 29 minutes: 35
- 30 to 34 minutes: 49
- 35 to 39 minutes: 16
- 40 to 44 minutes: 21
- 45 to 59 minutes: 16
- 60 to 89 minutes: 24
- 90 or more minutes: 12
Means of transportation to work:
- Drove a car alone: 314 (83.5%)
- Carpooled: 28 (7.4%)
- Walked: 11 (2.9%)
- Worked at home: 23 (6.1%)
- Unemployment by race in 2022
- Unemployment rate for White non-Hispanic residents
- 1.9%Females
- Unemployment rate for two or more race residents
- 50.4%Males
- Unemployment rate for Hispanic or Latino residents
- 35.9%Males
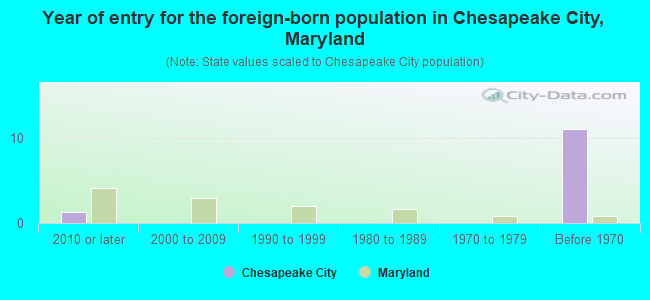
- Year of entry for the foreign-born population in Chesapeake City, Maryland
- 12010 or later
- 02000 to 2009
- 01990 to 1999
- 01980 to 1989
- 01970 to 1979
- 11Before 1970
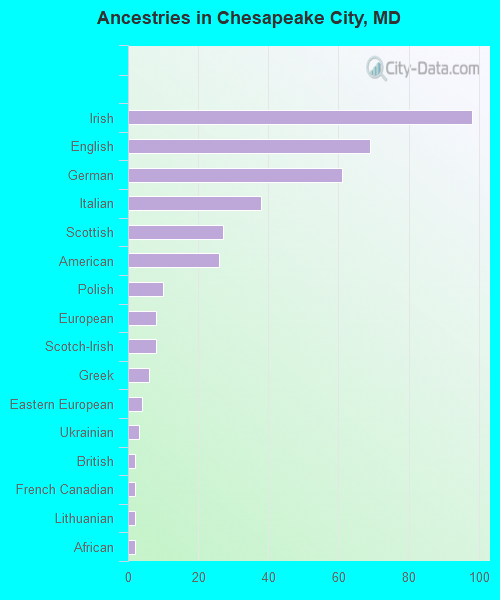
First ancestries reported:
- Irish: 98 (21.2%)
- English: 69 (14.9%)
- German: 61 (13.2%)
- Italian: 38 (8.2%)
- Scottish: 27 (5.8%)
- American: 26 (5.6%)
- Polish: 10 (2.2%)
- European: 8 (1.7%)
- Scotch-Irish: 8 (1.7%)
- Greek: 6 (1.3%)
- Eastern European: 4 (0.9%)
- Ukrainian: 3 (0.6%)
- British: 2 (0.4%)
- French Canadian: 2 (0.4%)
- Lithuanian: 2 (0.4%)
- African: 2 (0.4%)
Most common places of birth for foreign-born residents (%):
| Chesapeake City: | 62.8% (27) |
| Maryland: | 3.5% (34,065) |
| Chesapeake City: | 30.2% (13) |
| Maryland: | 0.3% (3,238) |
| Chesapeake City: | 2.3% (1) |
| Maryland: | 4.6% (44,825) |
Place of birth for U.S.-born residents:
- This state: 236
- Other state: 520
- Northeast: 249
- Midwest: 9
- South: 258
- West: 6
96.3% of Chesapeake City residents lived in the same house 1 years ago.
Out of people who lived in different houses, 23.3% lived in this county.
Out of people who lived in different counties, 13.6% lived in Maryland.
| Chesapeake City: | 96.3% |
| State average: | 88.5% |
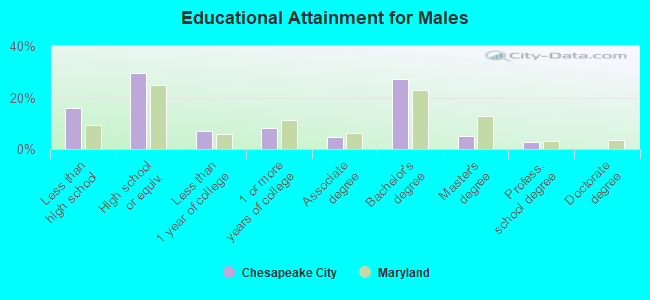
Education attainment for males 25 years and older:
- No schooling: 0
- Nursery to 4th grade: 0
- 5th and 6th grade: 12
- 7th and 8th grade: 0
- 9th grade: 24
- 10th grade: 1
- 11th grade: 1
- 12th grade, no diploma: 8
- High school graduate (or equivalency): 85
- Less than 1 year of college: 20
- Some college more than 1 year, no degree: 23
- Associate degree: 13
- Bachelor's degree: 78
- Master's degree: 15
- Professional school degree: 8
- Doctorate degree: 0
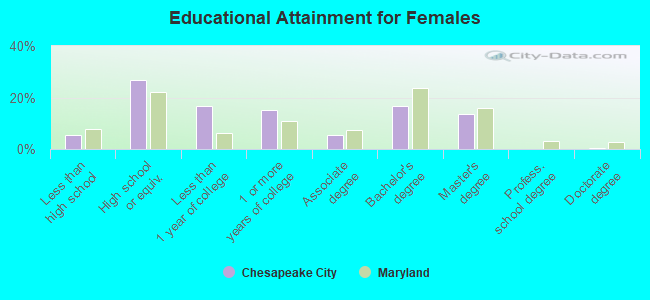
Education attainment for females 25 years and older:
- No schooling: 0
- Nursery to 4th grade: 0
- 5th and 6th grade: 0
- 7th and 8th grade: 12
- 9th grade: 1
- 10th grade: 2
- 11th grade: 4
- 12th grade, no diploma: 1
- High school graduate (or equivalency): 100
- Less than 1 year of college: 62
- Some college more than 1 year, no degree: 57
- Associate degree: 21
- Bachelor's degree: 62
- Master's degree: 51
- Professional school degree: 0
- Doctorate degree: 1
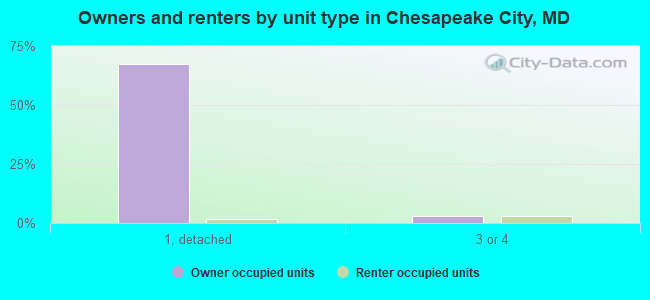
Housing units in structures:
- One, detached: 325
- One, attached: 40
- Two: 12
- 3 or 4: 38
- 5 to 9: 24
- 20 to 49: 30
- Mobile homes: 4
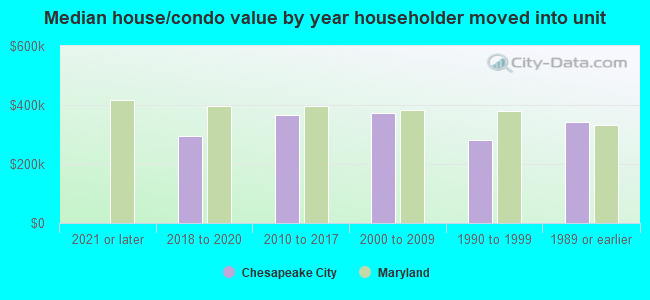
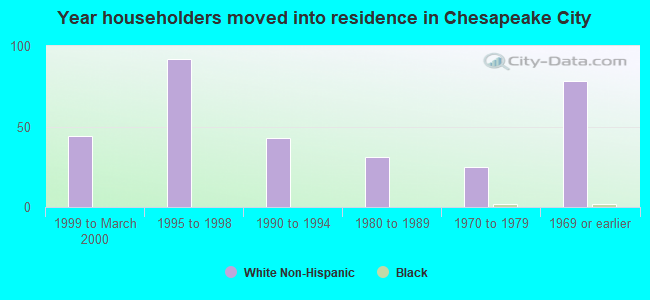
House/condo owner moved in on average 10 years ago
Renter moved in on average 3 years ago
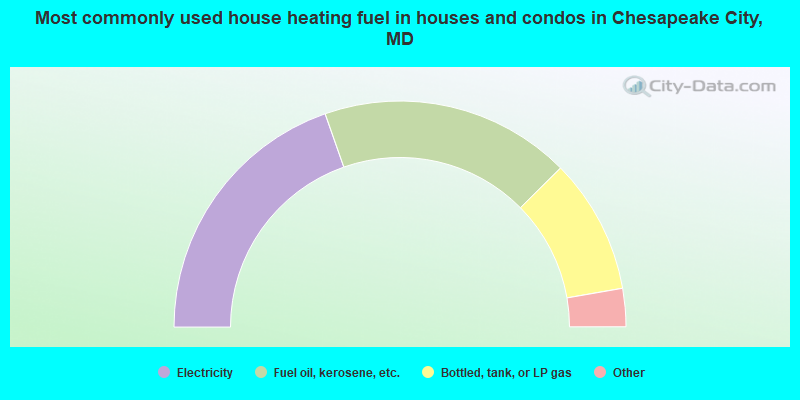
- 39.4%Electricity
- 36.0%Fuel oil, kerosene, etc.
- 19.4%Bottled, tank, or LP gas
- 2.8%Other fuel
- 1.5%Solar energy
- 0.9%Utility gas
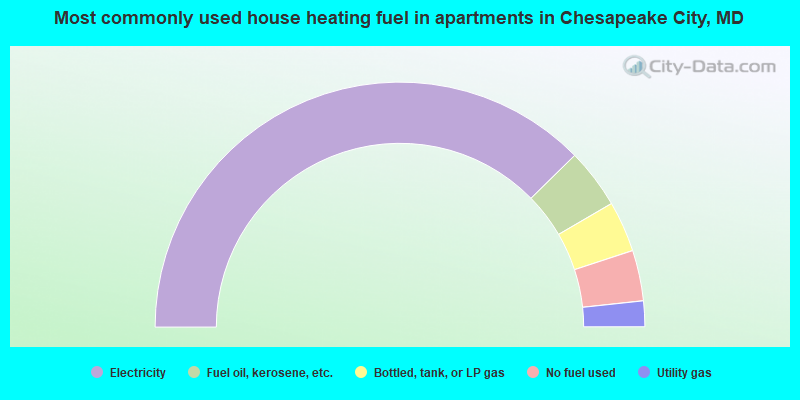
- 75.3%Electricity
- 7.9%Fuel oil, kerosene, etc.
- 6.7%Bottled, tank, or LP gas
- 6.7%No fuel used
- 3.4%Utility gas
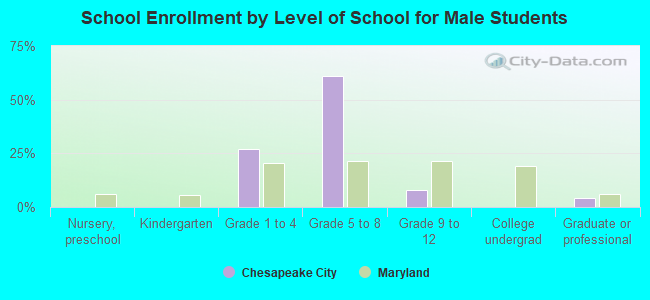
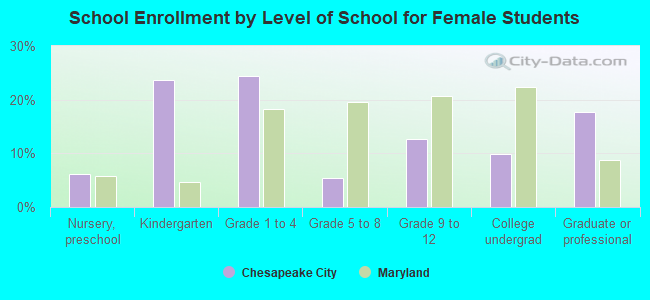
Private vs. public school enrollment:
| Here: | 0.0% |
| Maryland: | 15.2% |
| Here: | 0.0% |
| Maryland: | 14.4% |
| Here: | 0.0% |
| Maryland: | 20.2% |