Housing density: 290 houses/condos per square mile
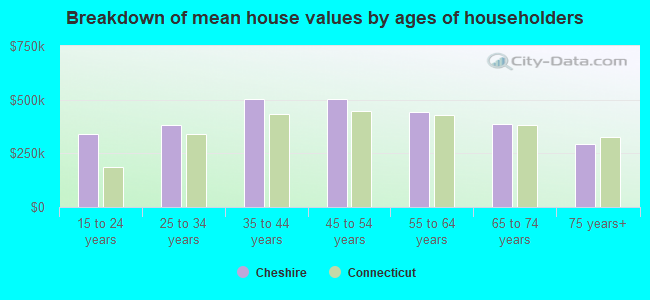
Median price asked for vacant for-sale houses and condos in 2022 in this county: $371,867.
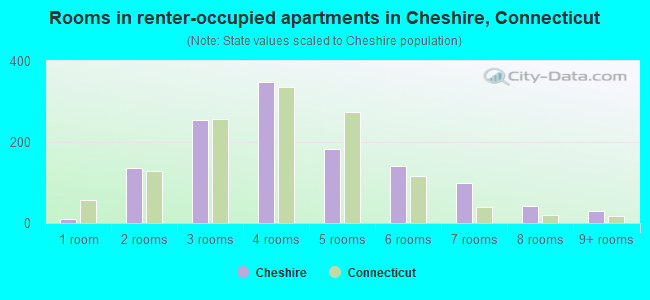
Median contract rent in 2022: $1,394 (lower quartile is $948, upper quartile is $1,828)
Median rent asked for vacant for-rent units in 2022: $1,658
Median gross rent in Cheshire, CT in 2022: $1,593
Housing units in Cheshire with a mortgage: 5,635 (523 second mortgage, 1,045 home equity loan, 26 both second mortgage and home equity loan) Houses without a mortgage: 1,657
In family households: 686,398 (135,155 male householders, 80,594 female householders)
152,067 spouses, 248,015 children (234,078 natural, 5,289 adopted, 8,648 stepchildren), 16,153 grandchildren, 8,819 brothers or sisters, 9,694 parents, foster children, 10,947 other relatives, 19,201 non-relatives
In nonfamily households: 146,881 (52,812 male householders (40,674 living alone)), 65,941 female householders (55,844 living alone)), 28,128 nonrelatives
In group quarters: 29,198 (10,313 institutionalized population)
129,243 married couples with children.
54,016 single-parent households (8,416 men, 45,600 women).
89.7% of residents of Cheshire speak English at home.
3.8% of residents speak Spanish at home (68% speak English very well, 21% speak English well, 11% speak English not well).
4.5% of residents speak other Indo-European language at home (74% speak English very well, 17% speak English well, 8% speak English not well, 1% don't speak English at all).
1.7% of residents speak Asian or Pacific Island language at home (53% speak English very well, 34% speak English well, 13% speak English not well).
0.2% of residents speak other language at home (51% speak English very well, 49% speak English well).
Foreign born population: 2,791 (9.3%)
(77.2% of them are naturalized citizens)
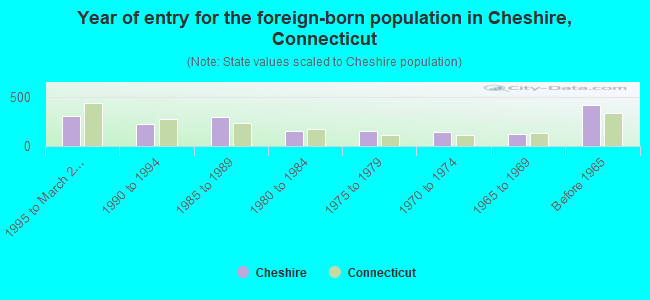
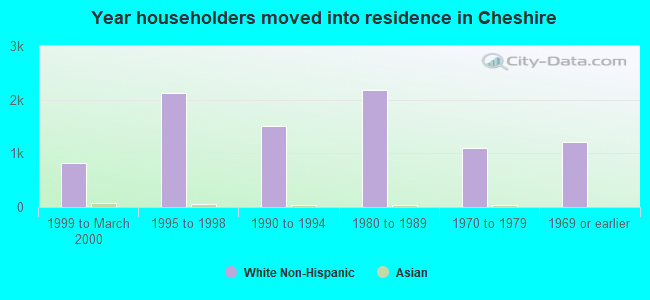
Year of entry for the foreign-born population in Cheshire, Connecticut
3021995 to March 2000
2241990 to 1994
3001985 to 1989
1491980 to 1984
1571975 to 1979
1401970 to 1974
1231965 to 1969
420Before 1965
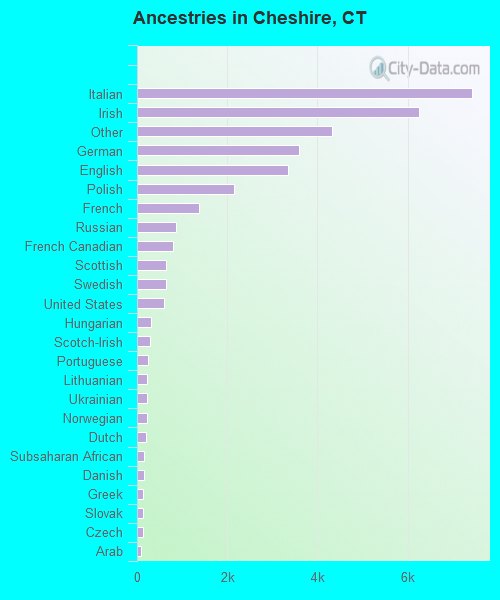
First ancestries reported:
Italian: 7,432 (21.4%)
Irish: 6,250 (18.0%)
Other: 4,328 (12.4%)
German: 3,581 (10.3%)
English: 3,346 (9.6%)
Polish: 2,155 (6.2%)
French: 1,368 (3.9%)
Russian: 875 (2.5%)
French Canadian: 794 (2.3%)
Scottish: 649 (1.9%)
Swedish: 638 (1.8%)
United States: 601 (1.7%)
Hungarian: 313 (0.9%)
Scotch-Irish: 293 (0.8%)
Portuguese: 250 (0.7%)
Lithuanian: 225 (0.6%)
Ukrainian: 224 (0.6%)
Norwegian: 222 (0.6%)
Dutch: 202 (0.6%)
Subsaharan African: 155 (0.4%)
Danish: 154 (0.4%)
Greek: 138 (0.4%)
Slovak: 125 (0.4%)
Czech: 122 (0.4%)
Arab: 99 (0.3%)
Swiss: 99 (0.3%)
West Indian: 85 (0.2%)
Welsh: 64 (0.2%)
Most common places of birth for foreign-born residents (%):
Italy
Cheshire:
9.7% (176)
Connecticut:
7.0% (26,023)
India
Cheshire:
8.3% (151)
Connecticut:
4.1% (15,108)
Korea
Cheshire:
7.9% (144)
Connecticut:
1.5% (5,508)
China, excluding Hong Kong and Taiwan
Cheshire:
7.3% (133)
Connecticut:
2.5% (9,358)
United Kingdom
Cheshire:
4.8% (87)
Connecticut:
4.4% (16,395)
Canada
Cheshire:
4.2% (77)
Connecticut:
5.2% (19,083)
Ukraine
Cheshire:
4.1% (75)
Connecticut:
1.0% (3,822)
Pakistan
Cheshire:
4.0% (73)
Connecticut:
0.9% (3,317)
Russia
Cheshire:
3.7% (67)
Connecticut:
1.4% (5,021)
Philippines
Cheshire:
3.5% (64)
Connecticut:
1.7% (6,247)
Germany
Cheshire:
3.5% (63)
Connecticut:
3.1% (11,432)
Romania
Cheshire:
3.0% (55)
Connecticut:
0.6% (2,371)
Vietnam
Cheshire:
2.8% (51)
Connecticut:
1.8% (6,680)
Mexico
Cheshire:
2.5% (46)
Connecticut:
3.6% (13,282)
Poland
Cheshire:
2.1% (38)
Connecticut:
6.9% (25,507)
Argentina
Cheshire:
1.9% (34)
Connecticut:
0.5% (1,832)
Other Western Europe
Cheshire:
1.8% (33)
Connecticut:
0.5% (1,983)
Place of birth for U.S.-born residents:
This state: 18,427
Other state: 7,685
Northeast: 5,419
Midwest: 1,121
South: 786
West: 359
65% of Cheshire residents lived in the same house 5 years ago. Out of people who lived in different houses, 62% lived in this county. Out of people who lived in different counties, 53% lived in Connecticut.
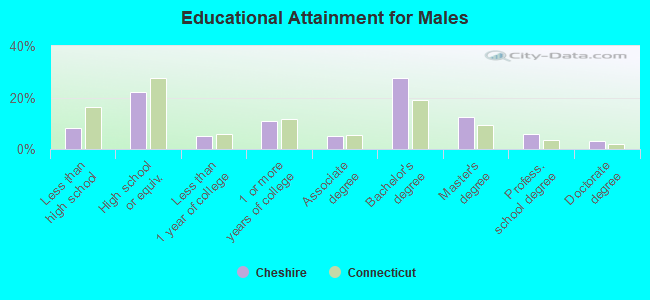
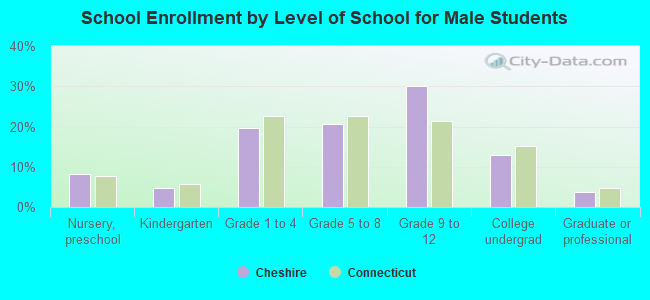
Education attainment for males 25 years and older:
No schooling: 30
Nursery to 4th grade: 11
5th and 6th grade: 90
7th and 8th grade: 89
9th grade: 147
10th grade: 138
11th grade: 136
12th grade, no diploma: 158
High school graduate (or equivalency): 2,157
Less than 1 year of college: 476
Some college more than 1 year, no degree: 1,044
Associate degree: 501
Bachelor's degree: 2,667
Master's degree: 1,205
Professional school degree: 559
Doctorate degree: 310
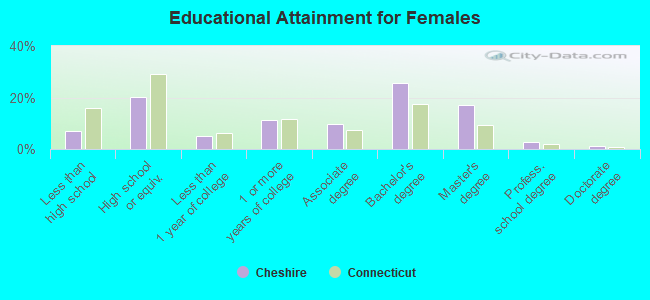
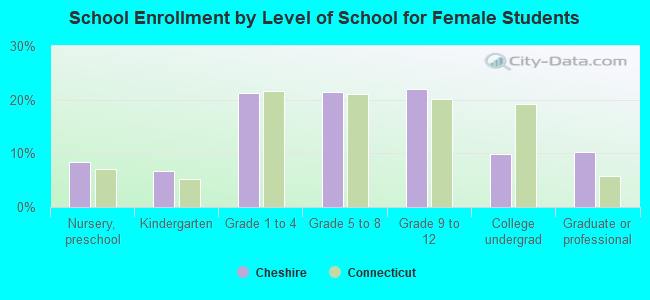
Education attainment for females 25 years and older:
No schooling: 46
Nursery to 4th grade: 0
5th and 6th grade: 18
7th and 8th grade: 148
9th grade: 74
10th grade: 92
11th grade: 111
12th grade, no diploma: 157
High school graduate (or equivalency): 1,894
Less than 1 year of college: 491
Some college more than 1 year, no degree: 1,056
Associate degree: 931
Bachelor's degree: 2,425
Master's degree: 1,607
Professional school degree: 248
Doctorate degree: 121
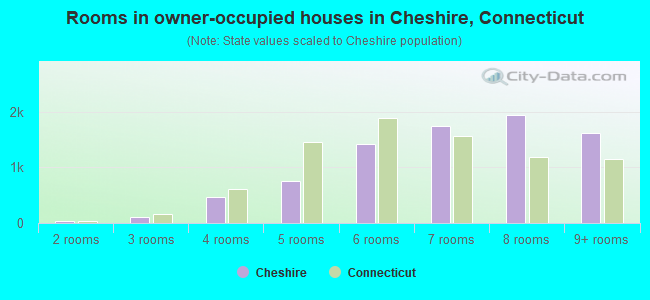
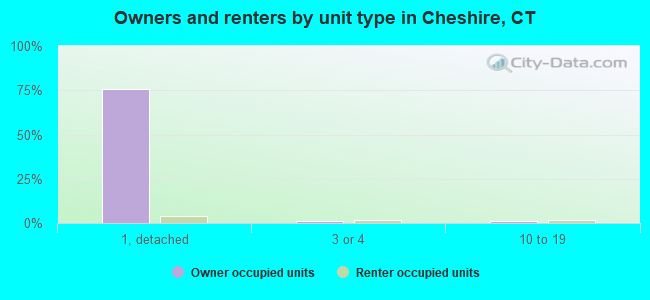
Housing units in structures:
One, detached: 7,506
One, attached: 638
Two: 175
3 or 4: 313
5 to 9: 269
10 to 19: 295
20 to 49: 207
50 or more: 130
Mobile homes: 18
Median worth of mobile homes: $407,975
Housing units lacking complete plumbing facilities: 0.3%
Housing units lacking complete kitchen facilities: 0.1%